

Super Micro Guided to 8% Gross Margin, Then Printed 17.5% — Above Dell's
Hypothesis Opus 5 · Research Opus 5 · Writing Opus 5 · Prompt v1.5
Super Micro told investors to expect roughly eight cents of gross profit on each dollar of June-quarter sales. It reported 17.5 cents — wider than Dell earned in its April quarter, at a twelfth of Dell's size — and management is already guiding the number back toward low double digits. The tension: the highest-margin of the three big AI server builders is also the only one burning cash, $6.8bn in its fiscal year, and it trades at 8.6x forward earnings against Dell's 23.5x.
On business quality Dell and Hewlett Packard Enterprise lead: Dell's infrastructure segment earned a record 10.5% operating margin on $29bn of quarterly revenue, and HPE's gross margin rose nearly nine points as Juniper-era networking outgrew its server book. Both shares have re-rated hard on that. Super Micro's, the outlier, still sit below where they traded a year ago.
| Ticker | Company | Segment | Trend · 13mo | 30D | 1Y |
|---|---|---|---|---|---|
| The subject · what this brief is about | |||||
DELL | Dell Technologies | Enterprise Storage & Software | 🟢 Cont. Bull | +12.7% | +241.6% |
HPE | Hewlett Packard Enterprise | Enterprise Storage & Software | 🟢 Cont. Bull | +17.2% | +142.3% |
SMCI | Super Micro Computer | Server & Infrastructure Systems | 🌱 Emerging Bull | +30.9% | −15.1% |
| Compared against · context, not the story | |||||
NVDA | NVIDIA | AI & Data Center GPUs | 🟢 Cont. Bull | +9.0% | +20.6% |
SPY | State Street SPDR S&P 500 ETF Trust | Asset Management | 🟢 Cont. Bull | +3.2% | +19.5% |
SNDK | Sandisk | Specialty Manufacturing & Components | 🟢 Cont. Bull | +43.7% | +3297.1% |
MU | Micron Technology | Memory (DRAM/NAND) | 🟢 Cont. Bull | +17.1% | +717.5% |
WDC | Western Digital | Data Storage Devices | 🟢 Cont. Bull | +0.1% | +504.1% |
STX | Seagate Technology | Data Storage Devices | 🟢 Cont. Bull | +12.4% | +431.5% |
NTAP | NetApp | Enterprise Storage & Software | 🟢 Cont. Bull | +10.2% | +76.5% |
ANET | Arista Networks | Cloud Networking | 🟢 Cont. Bull | +9.2% | +39.1% |
12-month price & trend


| Ticker | Mkt cap | P/E | P/E fwd | P/S | P/S fwd | P/GP | P/GP fwd | EV/EBITDA | FCF yld |
|---|---|---|---|---|---|---|---|---|---|
DELL | $293.6B | 34.5x | 23.5x | 2.2x | 1.7x | 11.5x | 8.9x | 21.2x | 3.2% |
HPE | $70.8B | 49.0x | 15.6x | 1.8x | 1.6x | 5.5x | 4.8x | 21.6x | 5.6% |
SMCI | $24.1B | 10.2x | 8.6x | 0.6x | 0.4x | 5.7x | 3.3x | 7.7x | -28.9% |


| Ticker | Mkt cap | P/E | P/E fwd | P/S | P/S fwd | P/GP | P/GP fwd | EV/EBITDA | FCF yld |
|---|---|---|---|---|---|---|---|---|---|
NVDA | $5.5T | 34.3x | 25.0x | 21.5x | 13.9x | 29.0x | 18.7x | 28.3x | 2.2% |
SPY | $773.0B | — | — | — | — | — | — | — | — |
SNDK | $232.3B | 20.2x | 7.5x | 11.5x | 4.8x | 16.1x | 6.7x | 17.4x | 4.9% |

| Ticker | Mkt cap | P/E | P/E fwd | P/S | P/S fwd | P/GP | P/GP fwd | EV/EBITDA | FCF yld |
|---|---|---|---|---|---|---|---|---|---|
MU | $1.0T | 19.9x | 12.2x | 11.2x | 7.8x | 15.4x | 10.7x | 14.5x | 2.6% |
WDC | $166.1B | 25.6x | 48.3x | 14.1x | 12.9x | 31.1x | 28.4x | 31.1x | 1.7% |
STX | $178.4B | 73.9x | 53.5x | 16.2x | 14.8x | 39.0x | 35.7x | 53.6x | 1.5% |


| Ticker | Mkt cap | P/E | P/E fwd | P/S | P/S fwd | P/GP | P/GP fwd | EV/EBITDA | FCF yld |
|---|---|---|---|---|---|---|---|---|---|
NTAP | $37.7B | 29.9x | 21.3x | 5.4x | 5.0x | 7.7x | 7.1x | 19.6x | 5.0% |
ANET | $256.4B | 63.4x | 50.6x | 24.3x | 20.6x | 38.6x | 32.7x | 49.8x | 2.0% |
Consensus projections
| Ticker | FY2026E | FY2027E | FY2028E | |
|---|---|---|---|---|
DELL | Revenue | +16.2% | +54.7% | +15.1% |
| EPS | +27.3% | +88.5% | +22.3% | |
HPE | Revenue | +30.3% | +11.5% | +5.6% |
| EPS | +80.5% | +18.1% | +9.6% | |
SMCI | Revenue | +77.7% | +69.8% | +17.7% |
| EPS | +33.5% | +54.8% | +23.3% | |
NVDA | Revenue | +65.1% | +84.2% | +43.2% |
| EPS | +59.0% | +91.7% | +42.0% | |
SNDK | Revenue | +174.4% | +143.0% | +18.2% |
| EPS | +2369.0% | +214.5% | +22.1% | |
MU | Revenue | +248.0% | +92.8% | +11.4% |
| EPS | +804.9% | +111.2% | +7.9% | |
WDC | Revenue | +36.9% | +37.2% | +26.5% |
| EPS | +106.2% | +72.8% | +48.0% | |
STX | Revenue | +32.7% | +35.9% | +24.9% |
| EPS | +86.9% | +77.9% | +48.0% | |
NTAP | Revenue | +4.3% | +10.0% | +5.7% |
| EPS | +10.4% | +12.9% | +11.1% | |
ANET | Revenue | +40.0% | +27.7% | +21.9% |
| EPS | +39.6% | +25.5% | +23.9% |
Forward fiscal years only. Blank means no analyst coverage for that year.
Three months ago the market had a tidy story about who makes money assembling artificial-intelligence computers. Dell Technologies and Hewlett Packard Enterprise, with enterprise customer lists and service contracts, were converting racks of Nvidia accelerators into segment operating profit. Super Micro Computer, the San Jose specialist that builds liquid-cooled rack-scale clusters fast and to order, was the pass-through case: it had guided its June quarter to a gross margin of 8.2–8.4%, roughly a distributor's take.
It printed 17.5%, on sales of $11.1bn, and attributed the gap to customer and product mix. That is a wider gross margin than Dell earned in its April quarter, 17.75%, on four times the revenue. Super Micro's operating margin came in at 13.4%, against Dell's 8.3% and HPE's 7.0%.
What the box makers are up against
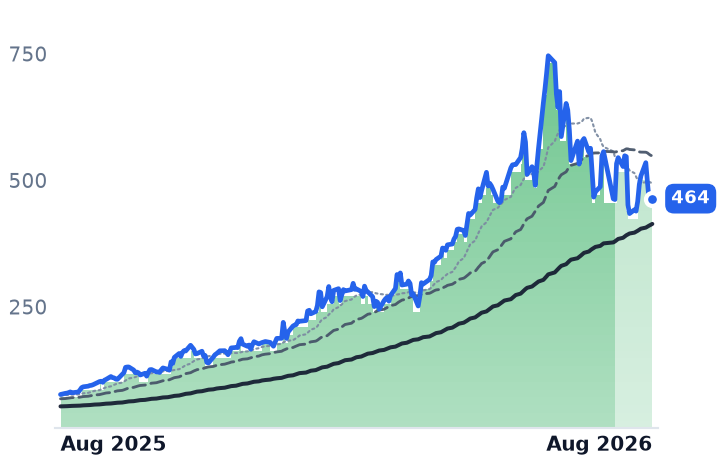
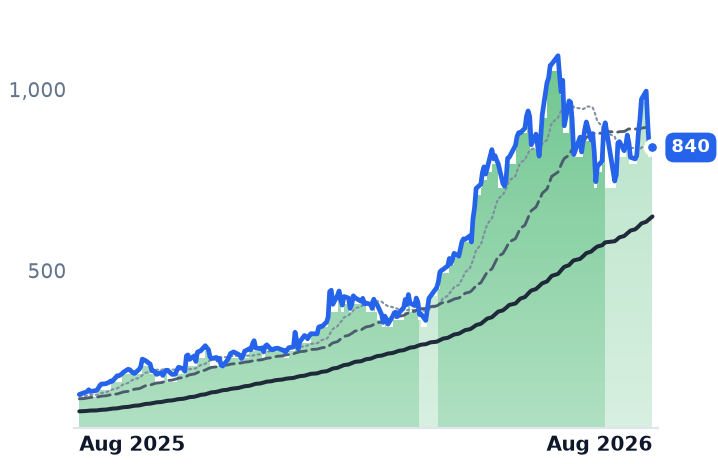
The squeeze on all three is real and it is priced in components, not systems. Server memory contract prices are set to rise 13–18% quarter on quarter in the third quarter, with NAND flash up 10–15%, and several large US cloud buyers hold multi-year agreements that bar suppliers from raising their prices — so the increases land disproportionately on everyone else, which is exactly where the enterprise server channel sits. The component makers have taken the spoils: SanDisk shares are up more than thirty-fold over twelve months, Micron sevenfold.
Dell, the largest AI server maker by volume with roughly a fifth of the market, has absorbed that and still widened its profits. Revenue grew 87.5% in the April quarter, and operating income grew 197% — the definition of operating leverage. Group gross margin fell 337 basis points on memory costs, yet the Infrastructure Solutions Group, which sells servers, storage and networking to enterprises, posted record operating income of $3.1bn on $29bn of revenue, a 10.5% margin. Dell booked $24.4bn of AI orders and closed with $51.3bn of AI server backlog. Its diluted share count fell 6.6% year on year.
HPE got there by a different route. Its gross margin rose 894 basis points to 36.52% in the April quarter, the fifth straight quarterly expansion, because the acquired Juniper networking business is growing far faster than the servers. Networking revenue rose 148% to $2.7bn at a 21.6% operating margin while the Cloud and AI segment grew 22.9% at 12.4%. Notably, the server margin nearly doubled from 6.6% a year earlier — the AI book is not diluting HPE so much as being outrun. The cost was 8.3% share dilution from the Juniper financing, the mirror of Dell's buyback.
The price of that agreement
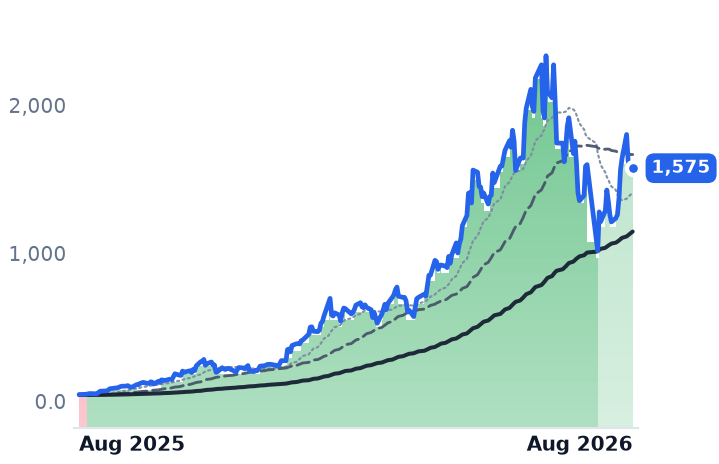
The shares have not lagged the story. Dell is up 262% in six months and 246% in twelve; HPE 150% and 145%. Over the same year Nvidia rose 22.7% and the S&P 500 20.3%. Peers moved far less — NetApp 78%, Arista 40% — so this is company-specific re-rating, not a hardware tide. Dell's shares have held an uptrend since late March, its 50-day average above its 200-day, HPE since late April.
What that costs: a dollar of Dell's trailing gross profit fetched 6.80x in early May and about 11.5x now. HPE's went from 3.28x to 5.53x. Dell trades at 23.5x forward earnings against 34.5x trailing, with consensus revenue growth of 55% this fiscal year decelerating to 15% next. HPE's trailing multiple is meaningless — fiscal-2025 net income collapsed to $57m on Juniper charges — but 15.6x forward is priced on an 80% earnings step-up that slows to 18% the year after.
Super Micro is the only one of the three to get cheaper: 5.70x trailing gross profit today against 7.02x in May, 8.6x forward earnings, 0.36x forward sales. Its shares remain 12% below a year ago, and its uptrend is three days old. The reason for the discount is on the cash flow statement — the fiscal year consumed $6.8bn, a trailing free-cash-flow yield of minus 28.9%, against positive yields at Dell and HPE — plus 11.6% dilution, guidance that margins return to low double digits, and past accounting allegations that keep part of the market treating it as speculative. It booked over $60bn of new orders and guided fiscal 2027 revenue to $65–72bn, well above consensus. Growth that fast has to be funded.
Dell reports on 1 September; HPE the next day. Both will speak into the memory reset.
The setup
Where it stands — Two server makers have re-rated on proven margin expansion; the third just proved margin and stayed cheap on cash burn. Would confirm — Dell's infrastructure operating margin holding at or above 10.5% on 1 September, with backlog above $51.3bn. Would invalidate — Super Micro's October-quarter gross margin falling back below 10% while operating cash flow stays negative. Watch next — Dell's fiscal Q2 call on 1 September, HPE's fiscal Q3 on 2 September. Valuation — Super Micro 8.6x forward earnings and 3.3x forward gross profit; Dell 23.5x and 8.9x; HPE 15.6x and 4.8x.