

ServiceNow's Gross Profit Grew 13% on 24% Revenue. Its Multiple Rose 25% Anyway.
Hypothesis Opus 5 · Research Opus 5 · Writing Opus 5 · Prompt v1.5
Enterprise software just had its best month in a year, and the largest re-rating went to the company whose gross profit is growing slowest. ServiceNow, which sells workflow automation to big enterprises and governments, lifted June-quarter revenue 24% to $3.99bn — but gross profit rose only 13%, as compute for its artificial-intelligence features and three consolidated acquisitions landed in cost of revenue and GAAP gross margin dropped 680 basis points to 70.7%. Investors paid up regardless: a dollar of ServiceNow's trailing gross profit now costs roughly 12.1 times, against 9.7 in May.
Salesforce is the other side of the trade. It rose 22% over the same month and barely re-rated, at about 5.45 times trailing gross profit versus 5.14 in May, because a $25bn accelerated buyback cut diluted shares 9.5% in two quarters. Twilio, billed per message rather than per seat, was the weakest of the three. Pricing model sorted nothing; the rotation out of chips did.
| Ticker | Company | Segment | Trend · 13mo | 30D | 1Y |
|---|---|---|---|---|---|
| The subject · what this brief is about | |||||
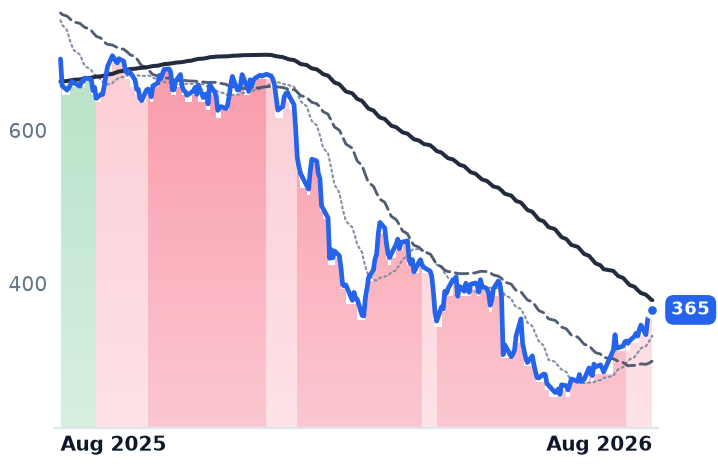
CRM | Salesforce | Customer Experience & CRM | 🔴 Cont. Bear | +27.7% | −14.8% |
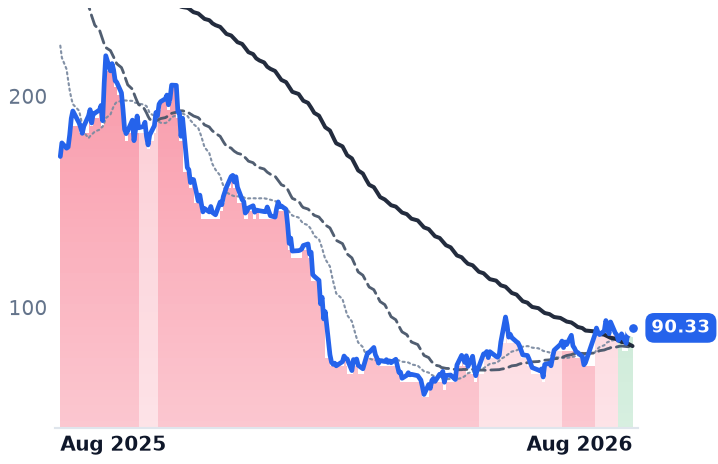
NOW | ServiceNow | Specialized Enterprise Solutions | 🔴 Cont. Bear | +35.1% | −26.5% |
TWLO | Twilio | Communications & Messaging Platforms | 🟢 Cont. Bull | +19.1% | +116.2% |
| Compared against · context, not the story | |||||
TEAM | Atlassian | Developer Tools & DevOps | 🔴 Cont. Bear | +99.0% | +3.2% |
WDAY | Workday | Enterprise Resource Planning | 🌱 Emerging Bull | +52.0% | −11.5% |
VEEV | Veeva Systems | Life Sciences Software & Data | 🌱 Emerging Bull | +34.3% | −12.2% |
NTNX | Nutanix | Cloud Infrastructure & Platforms | 🌱 Emerging Bull | +24.6% | −2.1% |
MSFT | Microsoft | Cloud Infrastructure & Platforms | 🔴 Cont. Bear | +23.8% | −3.8% |
ADBE | Adobe | Design & Content Creation | 🔴 Cont. Bear | +25.0% | −22.7% |
ORCL | Oracle | Cloud Infrastructure & Platforms | 🔴 Cont. Bear | +15.6% | −37.1% |
DT | Dynatrace | Other | 🌱 Emerging Bull | +18.2% | +0.1% |
HUBS | HubSpot | Customer Experience & CRM | 🔴 Cont. Bear | +15.1% | −48.3% |
IOT | Samsara | IoT & Connected Operations | 🌱 Emerging Bull | +16.7% | +18.4% |
BILL | Bill.com | Fintech & Digital Finance | ⚠️ Emerging Bear | +13.0% | +14.7% |
FROG | JFrog | Developer Tools & DevOps | 🟢 Cont. Bull | +9.9% | +86.8% |
SAP | SAP | Enterprise Resource Planning | 🔴 Cont. Bear | +46.3% | −17.7% |
MNDY | monday.com | Other | 🔴 Cont. Bear | +22.2% | −47.3% |
INTU | Intuit | Enterprise Resource Planning | 🔴 Cont. Bear | +28.5% | −47.3% |
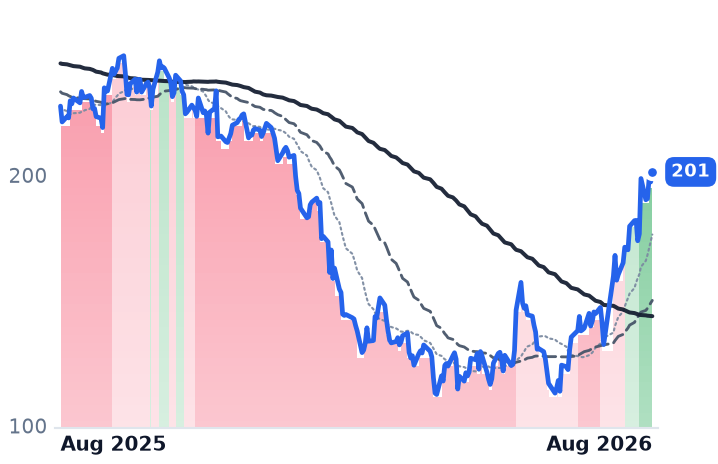
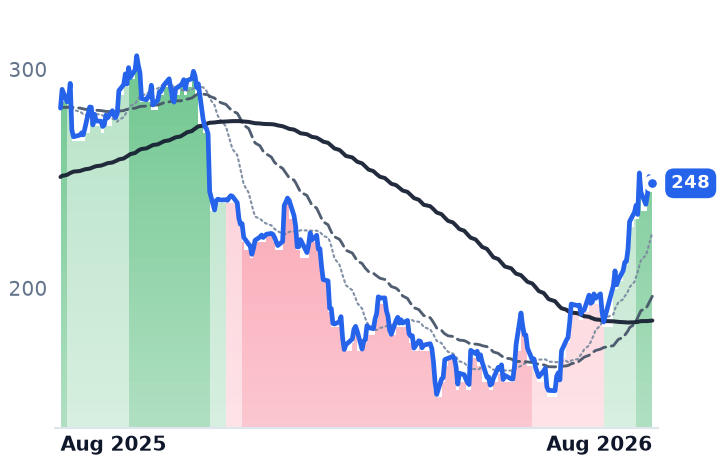
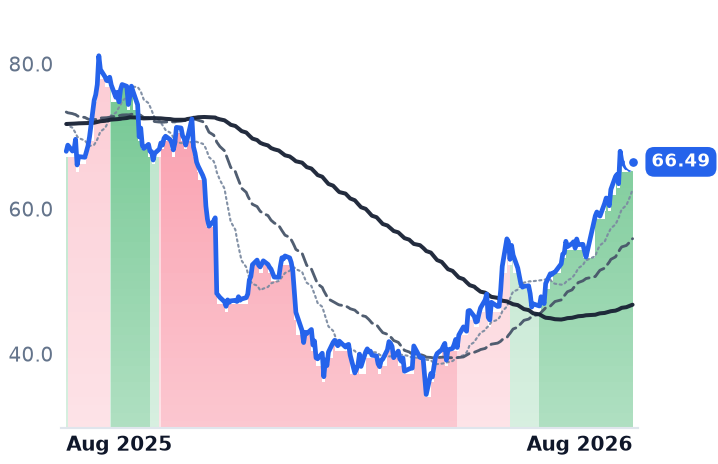
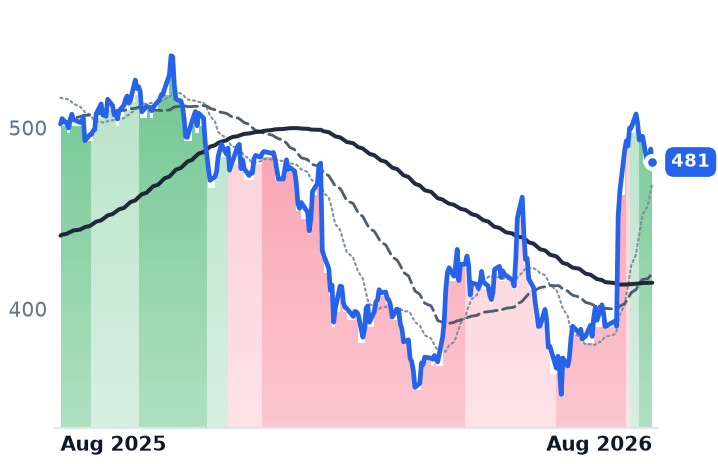
12-month price & trend
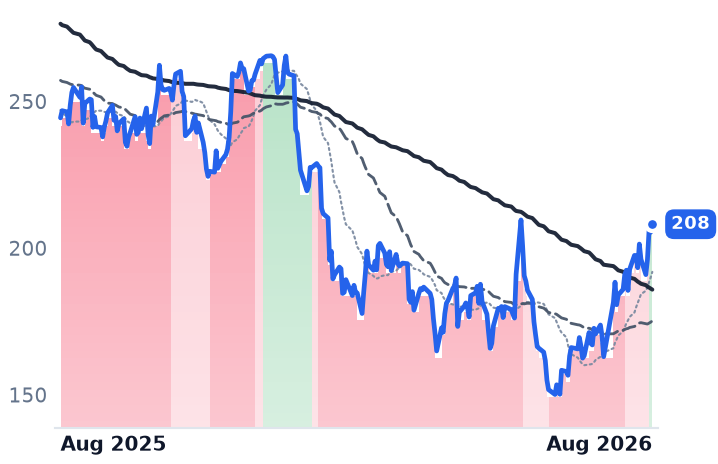
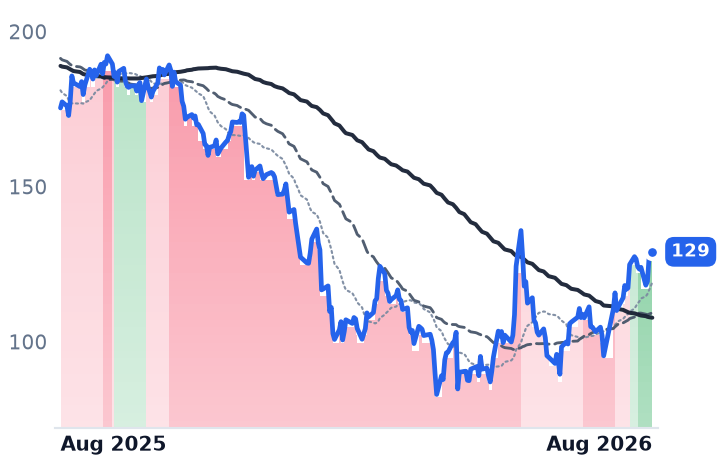
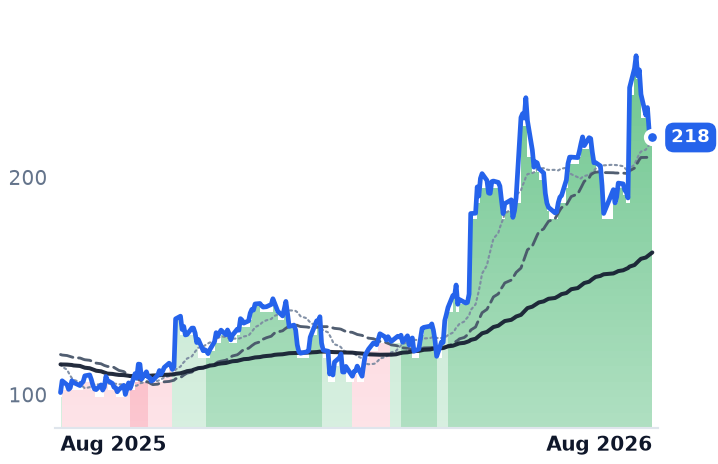
| Ticker | Mkt cap | P/E | P/E fwd | P/S | P/S fwd | P/GP | P/GP fwd | EV/EBITDA | FCF yld |
|---|---|---|---|---|---|---|---|---|---|
CRM | $171.3B | 24.1x | 14.8x | 4.0x | 3.7x | 5.2x | 4.8x | 14.6x | 8.6% |
NOW | $132.8B | 79.8x | 31.6x | 9.0x | 8.2x | 12.1x | 11.0x | 39.8x | 3.4% |
TWLO | $34.2B | 30.0x | 38.0x | 6.1x | 5.7x | 12.6x | 11.8x | 93.9x | 3.2% |
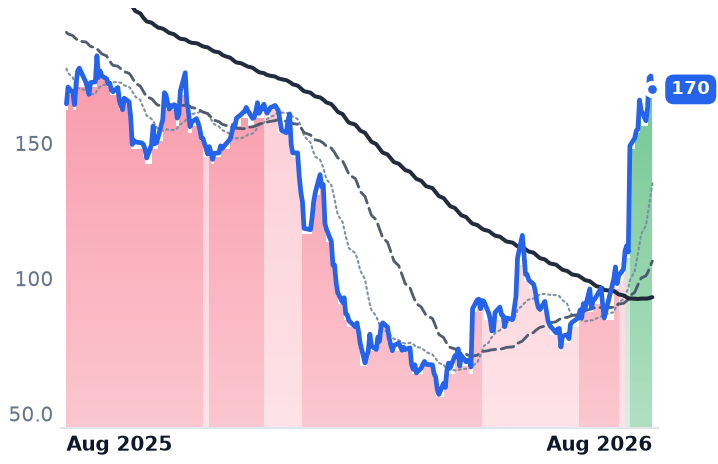
| Ticker | Mkt cap | P/E | P/E fwd | P/S | P/S fwd | P/GP | P/GP fwd | EV/EBITDA | FCF yld |
|---|---|---|---|---|---|---|---|---|---|
TEAM | $45.1B | n/m | 31.3x | 6.9x | 6.0x | 8.1x | 7.1x | 298.8x | 2.9% |
WDAY | $52.4B | 62.1x | 18.6x | 5.3x | 4.9x | 7.0x | 6.5x | 33.2x | 5.7% |
VEEV | $40.3B | 43.0x | 27.4x | 12.1x | 11.0x | 16.2x | 14.7x | 29.6x | 4.1% |
| Ticker | Mkt cap | P/E | P/E fwd | P/S | P/S fwd | P/GP | P/GP fwd | EV/EBITDA | FCF yld |
|---|---|---|---|---|---|---|---|---|---|
NTNX | $18.3B | 66.4x | 30.8x | 6.7x | 5.7x | 7.6x | 6.6x | 54.1x | 4.2% |
MSFT | $3.7T | 27.5x | 25.2x | 11.1x | 9.4x | 16.3x | 13.9x | 18.2x | 1.8% |
ADBE | $109.8B | 15.8x | 11.3x | 4.4x | 4.1x | 4.9x | 4.6x | 11.3x | 9.7% |
| Ticker | Mkt cap | P/E | P/E fwd | P/S | P/S fwd | P/GP | P/GP fwd | EV/EBITDA | FCF yld |
|---|---|---|---|---|---|---|---|---|---|
ORCL | $433.0B | 25.3x | 18.7x | 6.4x | 4.8x | 9.8x | 7.3x | 17.4x | -5.5% |
DT | $14.4B | 97.0x | 24.9x | 6.9x | 6.2x | 8.4x | 7.6x | 44.1x | 4.0% |
HUBS | $12.3B | 84.8x | 18.1x | 3.6x | 3.3x | 4.3x | 4.0x | 40.8x | 6.2% |
| Ticker | Mkt cap | P/E | P/E fwd | P/S | P/S fwd | P/GP | P/GP fwd | EV/EBITDA | FCF yld |
|---|---|---|---|---|---|---|---|---|---|
IOT | $23.0B | 389.3x | 55.9x | 13.3x | 11.4x | 17.4x | 15.0x | 234.7x | 1.0% |
BILL | $4.8B | n/m | 13.4x | 2.9x | 2.7x | 3.6x | 3.3x | 50.1x | 8.9% |
FROG | $11.2B | n/m | 94.0x | 18.6x | 17.1x | 23.9x | 22.0x | n/m | 1.5% |
| Ticker | Mkt cap | P/E | P/E fwd | P/S | P/S fwd | P/GP | P/GP fwd | EV/EBITDA | FCF yld |
|---|---|---|---|---|---|---|---|---|---|
SAP | $217.1B | 23.7x | 26.1x | 5.0x | 5.4x | 6.8x | 7.4x | 12.8x | 4.6% |
MNDY | $3.8B | 38.0x | 16.6x | 2.8x | 2.6x | 3.2x | 2.9x | 34.1x | 7.8% |
INTU | $89.0B | 19.7x | 11.9x | 4.3x | 3.7x | 5.2x | 4.6x | 13.0x | 8.7% |
Consensus projections
| Ticker | FY2026E | FY2027E | FY2028E | |
|---|---|---|---|---|
CRM | Revenue | +9.3% | +11.1% | +9.4% |
| EPS | +17.4% | +20.2% | +10.4% | |
NOW | Revenue | +22.4% | +18.7% | +18.6% |
| EPS | +17.1% | +23.2% | +21.4% | |
TWLO | Revenue | +19.4% | +11.7% | +10.6% |
| EPS | +23.5% | +14.5% | +14.2% | |
TEAM | Revenue | +24.7% | +15.4% | +14.7% |
| EPS | +55.5% | −0.1% | +21.6% | |
WDAY | Revenue | +13.4% | +11.8% | +11.0% |
| EPS | +26.5% | +18.6% | +17.3% | |
VEEV | Revenue | +16.3% | +15.1% | +12.0% |
| EPS | +23.1% | +14.1% | +10.6% | |
NTNX | Revenue | +12.2% | +12.9% | +12.6% |
| EPS | +11.0% | +14.1% | +15.9% | |
MSFT | Revenue | +18.0% | +18.2% | +19.6% |
| EPS | +26.7% | +15.4% | +18.5% | |
ADBE | Revenue | +12.0% | +9.1% | +8.8% |
| EPS | +17.2% | +12.7% | +14.2% | |
ORCL | Revenue | +17.8% | +33.2% | +45.5% |
| EPS | +25.3% | +7.6% | +35.6% | |
DT | Revenue | +18.9% | +15.6% | +15.0% |
| EPS | +22.8% | +17.8% | +14.6% | |
HUBS | Revenue | +18.2% | +14.2% | +14.0% |
| EPS | +38.2% | +25.7% | +18.6% | |
IOT | Revenue | +28.9% | +25.9% | +19.7% |
| EPS | +129.2% | +40.4% | +27.9% | |
BILL | Revenue | +13.2% | +8.9% | +10.1% |
| EPS | +26.1% | +35.2% | +19.3% | |
FROG | Revenue | +24.2% | +17.7% | +18.3% |
| EPS | +23.8% | +16.8% | +26.0% | |
SAP | Revenue | +9.3% | +11.6% | +12.1% |
| EPS | +18.7% | +17.0% | +18.3% | |
MNDY | Revenue | +19.8% | +15.2% | +14.9% |
| EPS | +27.8% | +22.3% | +19.1% | |
INTU | Revenue | +13.9% | +11.3% | +10.8% |
| EPS | +18.5% | +15.0% | +12.6% |
Forward fiscal years only. Blank means no analyst coverage for that year.
ServiceNow sold considerably more software in the June quarter and kept less of each dollar than it used to. Revenue reached $3.99bn, up 24% from a year earlier and accelerating for a second straight quarter. Gross profit grew 13%. The gap is the story: GAAP gross margin fell to 70.68% from 77.48%, as hyperscaler compute for the company's agentic features and the consolidation of three acquisitions — Moveworks, Vesa and Armis — pushed cost of revenue up faster than sales. GAAP operating income fell 55% to $162m, leaving an operating margin of 4.06% against 11.14% a year earlier.
The demand side is not in doubt. ServiceNow's second-quarter release shows subscription revenue of $3.88bn up 24.5%, current remaining performance obligation — contracted revenue due within twelve months — of $13.2bn up 21%, 123 deals above $1m of net new annual contract value, and AI annual contract value crossing $1bn. Renewals ran at 98%. Management told investors roughly half the new business it writes is no longer seat-based, guided full-year subscription gross margin to 81%, and raised full-year subscription guidance by only $15m, calling part of the beat a pull-forward of federal on-premise deals from the third quarter.
Salesforce grew slower and kept more
Salesforce, the customer-relationship-management platform founded and run by Marc Benioff, is the mirror image. Growth is far lower but rising — 8.6%, then 12.1%, then 13.3% year over year in the April quarter, on revenue of $11.13bn. Gross margin was 76.92% against 76.96% a year earlier, essentially unchanged, which is unusual for a company selling inference-heavy features. Operating income grew 25% on that 13% revenue line. In its first-quarter release the company put Agentforce annual recurring revenue at $1.2bn, up 205%, with combined AI and data revenue above $3.4bn, and reported a record 34.8% non-GAAP operating margin.
The share count did the rest. Salesforce returned $27.5bn to shareholders in the quarter, including a $25bn accelerated repurchase that delivered 103m shares upfront. Diluted shares went from 962m in October to 871m in April.
That is why a 22% month left the valuation almost where it started. Measured against reported gross profit per diluted share, Salesforce cost about 5.68 times trailing gross profit in February, 5.14 in May and 5.45 now. ServiceNow went 10.60, then 9.70, then 12.14 — a 25% re-rating in three months on 13% gross-profit growth. The premium the workflow incumbent commands over the seat-priced one widened from 1.89 times in May to 2.23 times. On forward earnings the two sit at 31.6 times and 14.8 times; on trailing free cash flow, ServiceNow yields 3.45% and Salesforce 8.56%.
The consumption-pricing test failed
If this month were the market finally paying for usage-based billing over licensed seats, Twilio should have led it. Twilio sells voice, messaging and email programming interfaces that developers embed in their own products, billed per unit of usage, with 5,587 employees against Salesforce's 83,334. It was the weakest of the three, up 11.3%. Its business is fine — four quarters of accelerating growth to 22%, dollar-based net expansion of 116%, record free cash flow of $353m, full-year organic guidance raised to 13-13.5% — and its reported margin decline is a pass-through, about $71m of US carrier fees that never touch operating income. But it already costs 12.64 times trailing gross profit against 6.95 in February, and third-quarter organic growth is guided to 11-12% from 17%.
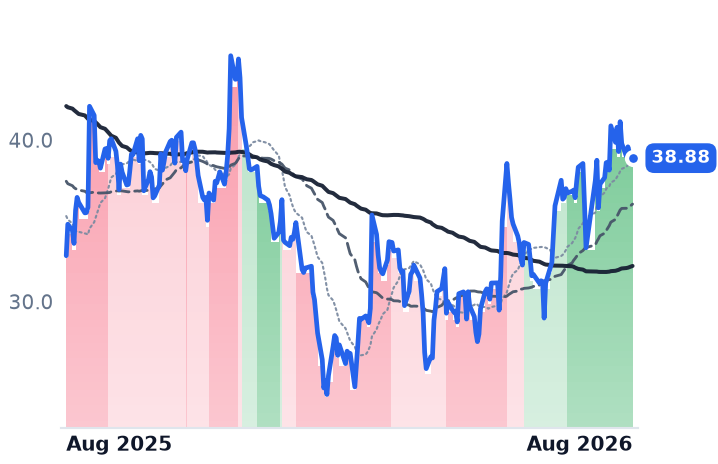
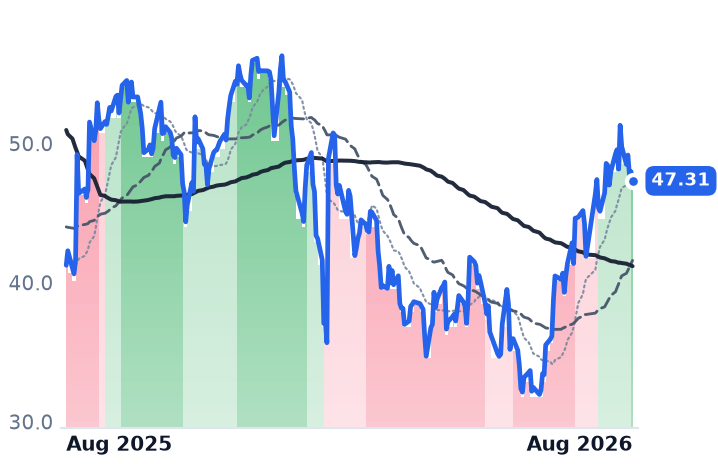
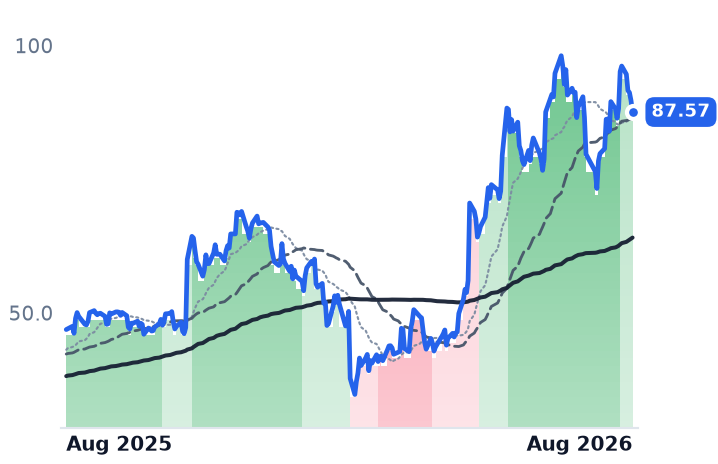
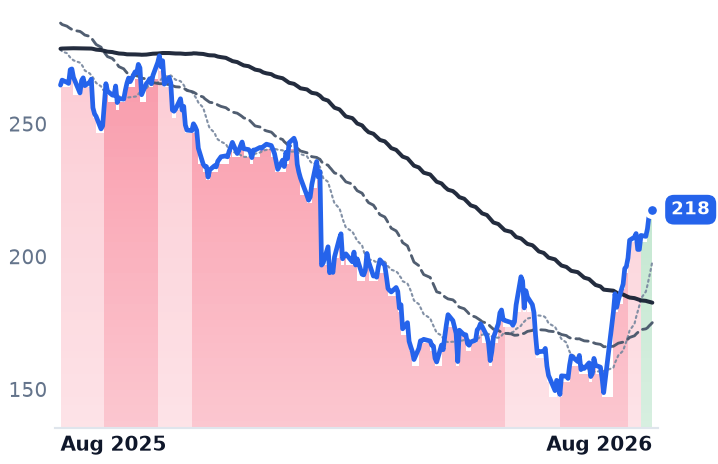
What actually moved was the whole category. Atlassian rose 87.5% over the thirty days, Workday 42.6%, Veeva 31.0%, Microsoft 21.5%, while HubSpot managed 7.9% and JFrog 1.2%. Morningstar's application-software index fell roughly 27% from October to mid-July and has bounced about 15% since Microsoft reported on 22 July, with software rising as semiconductors fall. The second leg came on 13 August, when Silver Lake was reported in talks to take Workday private at a value above $51bn — a private-equity bid read as a vote of confidence in seat-priced software. Salesforce has disclosed no new financial number since 27 May; two windows, 22-28 July and 19 August, account for 17 points of its 22-point month.
What each side is defending
ServiceNow's durability rests on its configuration management database, which encodes the dependency state of a customer's IT estate; replacing it means re-architecting operations, which is what a 98% renewal rate looks like. Salesforce's risk is subtler and runs the other way: rival platforms are indexing customer-relationship and Slack data into their own context graphs, and Atlassian's latest shareholder letter treats Salesforce as an ingested data source rather than a partner, with an agent that turns Slack threads into work items. Coordination value migrates to whoever holds the cross-application context, not to the application that generated it.
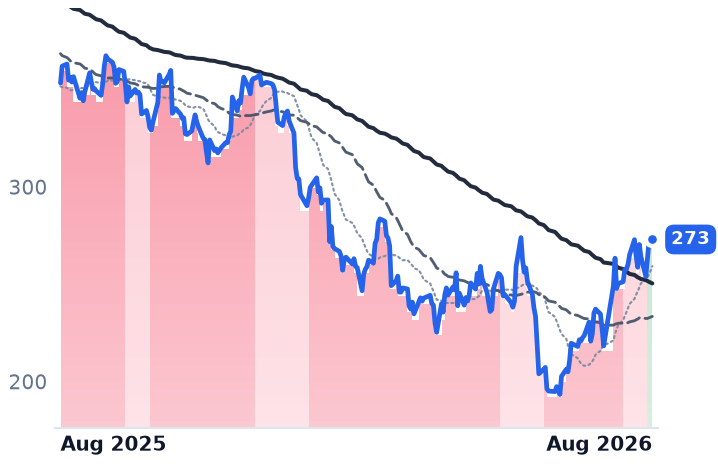
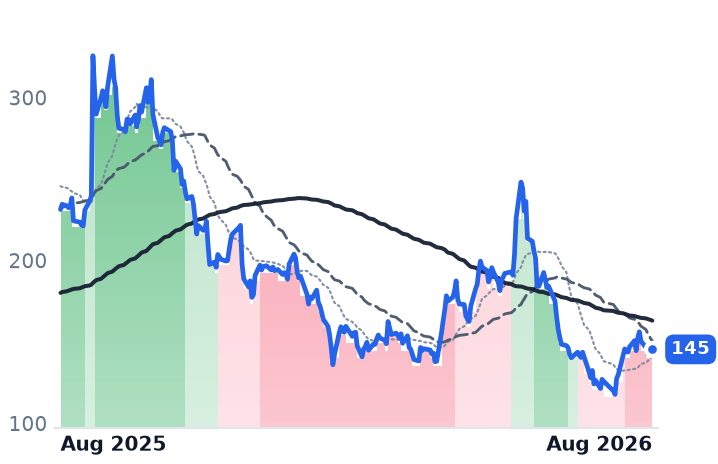
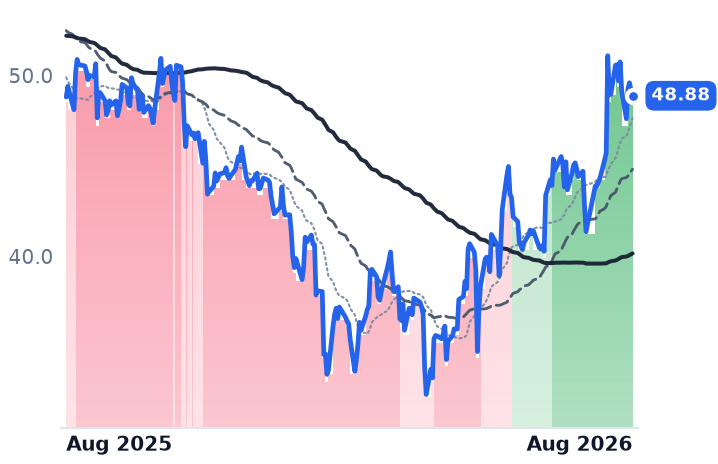
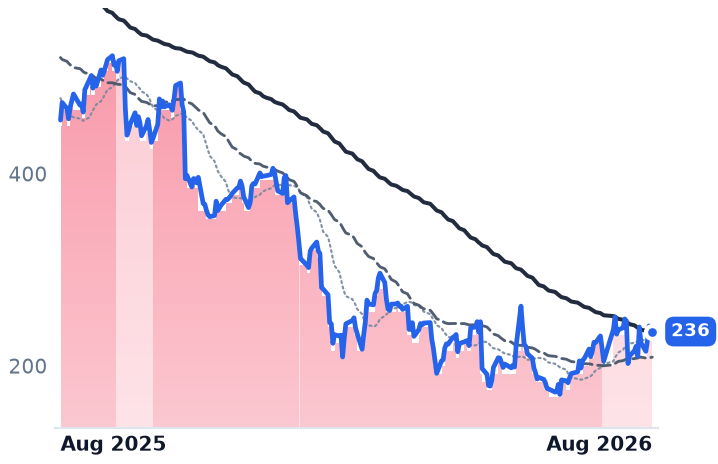
The price history frames both. Salesforce fell into a downtrend on 18 June and only regained a rising 50-day average above its 200-day on 19 August; ServiceNow got there a week earlier. Both remain well below a year ago — Salesforce by 15%, ServiceNow by 26%.
The setup
Where it stands — The market is paying a widening premium for ServiceNow's growth while its gross profit decelerates, and almost nothing extra for Salesforce's. Would confirm — ServiceNow subscription gross margin recovering toward the guided 81% while cRPO growth holds above 20%. Would invalidate — Salesforce cRPO growth falling below its total revenue growth, or Agentforce ARR growth slowing sharply from 205%. Watch next — Salesforce reports second-quarter fiscal 2027 results on 26 August 2026, after the close. Valuation — Salesforce 5.45x trailing and 4.78x forward gross profit; ServiceNow 12.14x and 10.96x, against 9.70x in May.