

Asana's Escape From Per-Seat Pricing Is $6m of AI Revenue Against $791m of Sales
Hypothesis Opus 5 · Research Opus 5 · Writing Opus 5 · Prompt v1.5
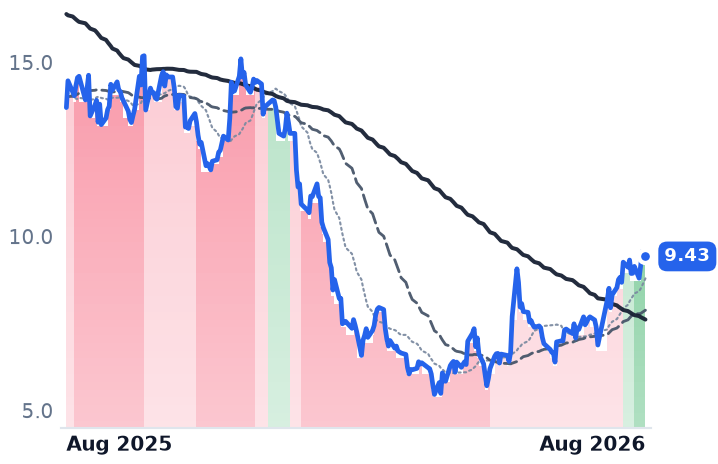
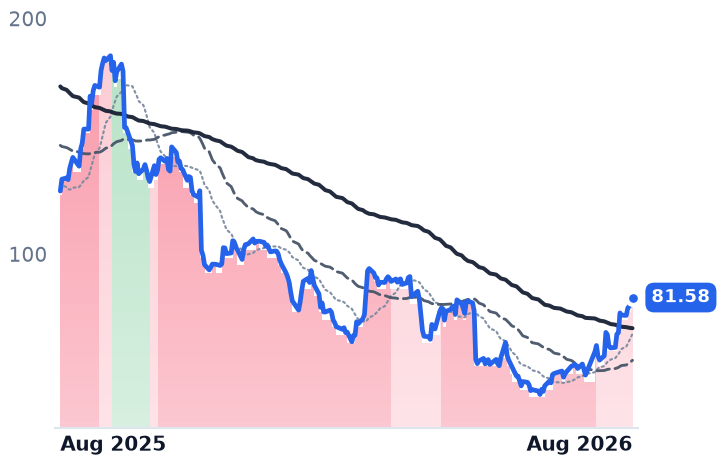
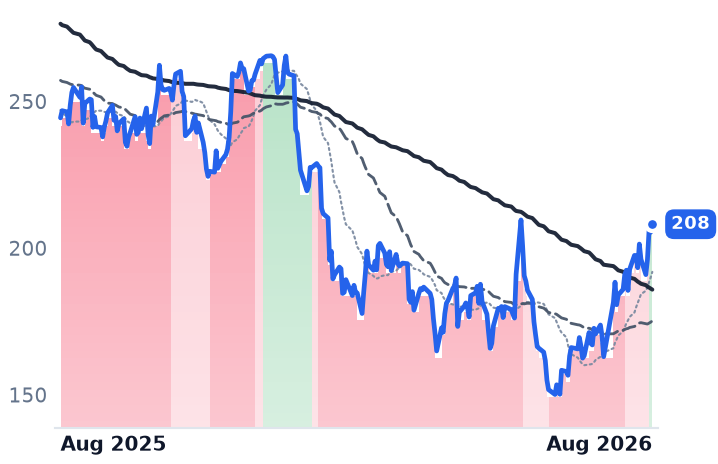
Asana's shares gained more than a third in a month during which the company said nothing at all — no results, no guidance, its next report due 3 September. The bounce belongs to a broad rebound in beaten-down software, and it leaves a question hanging. The bull case for the stock rests on AI Studio, a consumption-priced product that would sever software pricing from headcount. Asana does disclose the number: over $6m of annual recurring revenue exiting fiscal 2026, against $791m of total revenue. Every customer group meanwhile spends less than it did a year ago, with net retention at 96% including among those paying $100,000 or more. Price per dollar of trailing gross profit is 3.18x, up from 2.72x in late July. Monday.com is the mirror image: it fell across its own results as retention hit a record-low 109%, yet at 3.16x gross profit it has not re-rated at all, and it grows twice as fast.
| Ticker | Company | Segment | Trend · 13mo | 30D | 1Y |
|---|---|---|---|---|---|
| The subject · what this brief is about | |||||
ASAN | Asana | Other | 🌱 Emerging Bull | +37.0% | −31.2% |
MNDY | monday.com | Other | 🔴 Cont. Bear | +22.2% | −47.3% |
| Compared against · context, not the story | |||||
TEAM | Atlassian | Developer Tools & DevOps | 🔴 Cont. Bear | +99.0% | +3.2% |
RNG | RingCentral | Communications & Collaboration | 🟢 Cont. Bull | +77.4% | +129.6% |
WIX | Wix.com | Website & Commerce Platforms | 🔴 Cont. Bear | +67.7% | −35.7% |
PAYC | Paycom Software | HR & Workforce Management | 🌱 Emerging Bull | +64.0% | +2.1% |
APPN | Appian | Low-Code & Process Automation | 🌱 Emerging Bull | +64.6% | +28.4% |
NOW | ServiceNow | Specialized Enterprise Solutions | 🔴 Cont. Bear | +35.1% | −26.5% |
CRM | Salesforce | Customer Experience & CRM | 🔴 Cont. Bear | +27.7% | −14.8% |
HUBS | HubSpot | Customer Experience & CRM | 🔴 Cont. Bear | +15.1% | −48.3% |
IBM | International Business Machines | IT Infrastructure & Operations | ⚠️ Emerging Bear | +14.1% | −0.1% |
BILL | Bill.com | Fintech & Digital Finance | ⚠️ Emerging Bear | +13.0% | +14.7% |
12-month price & trend
| Ticker | Mkt cap | P/E | P/E fwd | P/S | P/S fwd | P/GP | P/GP fwd | EV/EBITDA | FCF yld |
|---|---|---|---|---|---|---|---|---|---|
ASAN | $2.3B | n/m | 25.7x | 2.8x | 2.6x | 3.2x | 3.0x | n/m | 4.9% |
MNDY | $3.8B | 38.0x | 16.6x | 2.8x | 2.6x | 3.2x | 2.9x | 34.1x | 7.8% |
TEAM | $44.9B | n/m | 31.1x | 6.8x | 6.0x | 8.1x | 7.1x | 297.7x | 2.9% |
| Ticker | Mkt cap | P/E | P/E fwd | P/S | P/S fwd | P/GP | P/GP fwd | EV/EBITDA | FCF yld |
|---|---|---|---|---|---|---|---|---|---|
RNG | $5.8B | 51.9x | 13.3x | 2.2x | 2.2x | 3.1x | 3.0x | 20.8x | 11.6% |
WIX | $3.0B | n/m | 11.3x | 1.5x | 1.3x | 2.2x | 2.0x | n/m | 17.9% |
PAYC | $10.0B | 23.6x | 18.4x | 4.7x | 4.5x | 5.8x | 5.7x | 12.0x | 7.5% |
| Ticker | Mkt cap | P/E | P/E fwd | P/S | P/S fwd | P/GP | P/GP fwd | EV/EBITDA | FCF yld |
|---|---|---|---|---|---|---|---|---|---|
APPN | $2.8B | n/m | 38.1x | 3.5x | 3.4x | 4.8x | 4.6x | 120.0x | 2.8% |
NOW | $121.7B | 73.1x | 28.9x | 8.3x | 7.5x | 11.0x | 10.0x | 36.6x | 3.8% |
CRM | $170.5B | 24.0x | 14.7x | 4.0x | 3.7x | 5.1x | 4.8x | 14.5x | 8.6% |
| Ticker | Mkt cap | P/E | P/E fwd | P/S | P/S fwd | P/GP | P/GP fwd | EV/EBITDA | FCF yld |
|---|---|---|---|---|---|---|---|---|---|
HUBS | $12.3B | 84.8x | 18.1x | 3.6x | 3.3x | 4.3x | 4.0x | 40.8x | 6.2% |
IBM | $222.5B | 20.6x | 19.2x | 3.2x | 3.2x | 5.5x | 5.4x | 17.3x | 6.6% |
BILL | $4.8B | n/m | 13.4x | 2.9x | 2.7x | 3.6x | 3.3x | 50.1x | 8.9% |
Consensus projections
| Ticker | FY2026E | FY2027E | FY2028E | |
|---|---|---|---|---|
ASAN | Revenue | +9.2% | +8.9% | +7.9% |
| EPS | −272.8% | +45.4% | +26.1% | |
MNDY | Revenue | +19.8% | +15.2% | +14.9% |
| EPS | +27.8% | +22.3% | +19.1% | |
TEAM | Revenue | +24.7% | +15.4% | +14.7% |
| EPS | +55.5% | −0.1% | +21.6% | |
RNG | Revenue | +5.1% | +4.6% | +4.4% |
| EPS | +16.4% | +11.1% | +10.8% | |
WIX | Revenue | +14.1% | +13.2% | +13.7% |
| EPS | −28.8% | +45.4% | +27.2% | |
PAYC | Revenue | +7.7% | +7.1% | +8.4% |
| EPS | +30.8% | +14.6% | +9.8% | |
APPN | Revenue | +15.8% | +10.7% | +9.6% |
| EPS | +85.9% | +27.4% | +24.2% | |
NOW | Revenue | +22.4% | +18.7% | +18.6% |
| EPS | +17.1% | +23.2% | +21.4% | |
CRM | Revenue | +9.3% | +11.1% | +9.4% |
| EPS | +17.4% | +20.2% | +10.4% | |
HUBS | Revenue | +18.2% | +14.2% | +14.0% |
| EPS | +38.2% | +25.7% | +18.6% | |
IBM | Revenue | +5.0% | +3.9% | +5.1% |
| EPS | +8.4% | +6.8% | +8.6% | |
BILL | Revenue | +13.2% | +8.9% | +10.1% |
| EPS | +26.1% | +35.2% | +19.3% |
Forward fiscal years only. Blank means no analyst coverage for that year.
A month of gains with nothing to report
Asana, which sells cloud software for coordinating projects, campaigns and company goals, has not communicated with the market since 28 May. Its next results land on 3 September. In between, the shares rose 37% from 22 July to 21 August. Nothing the business did explains it.
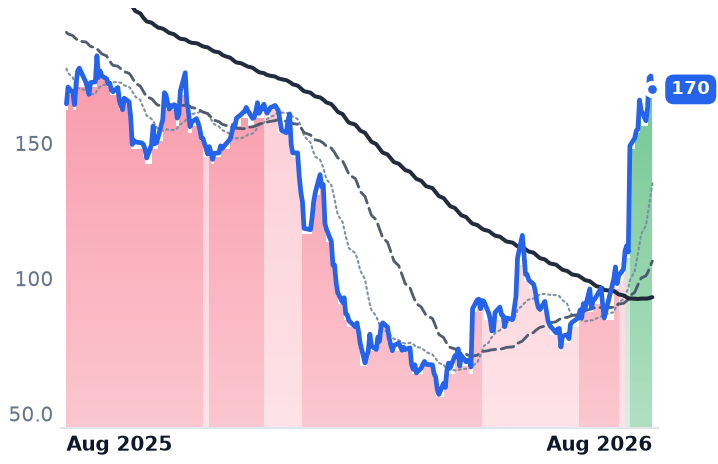
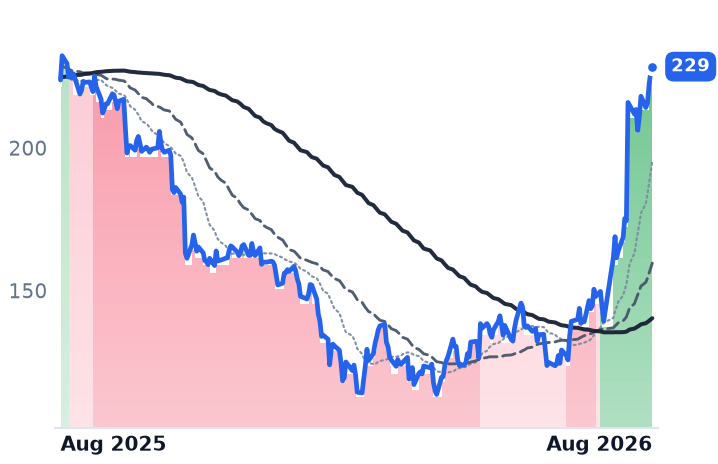
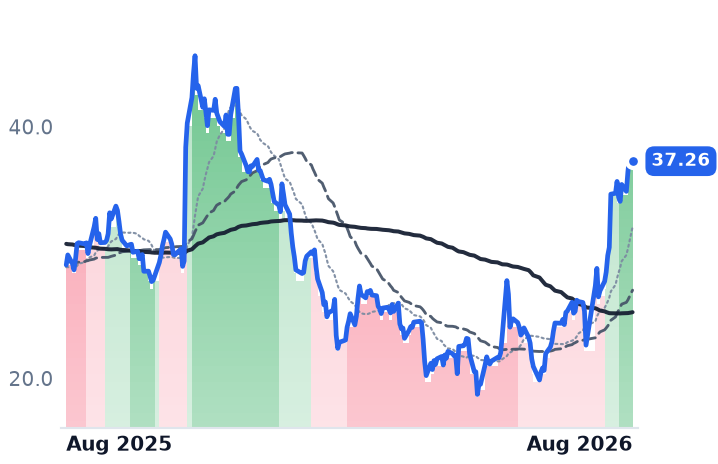
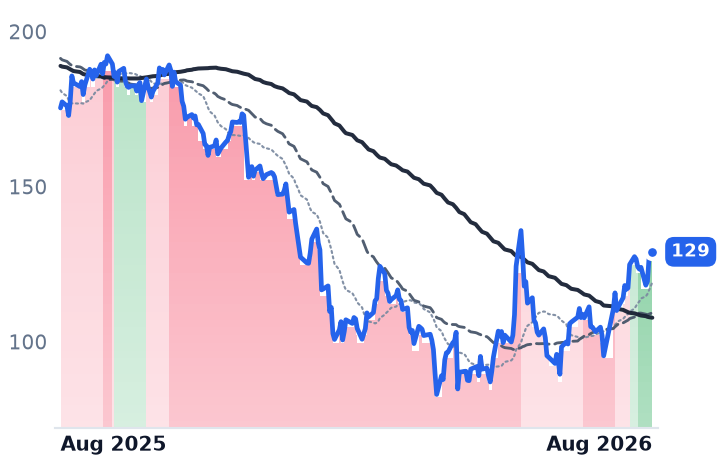
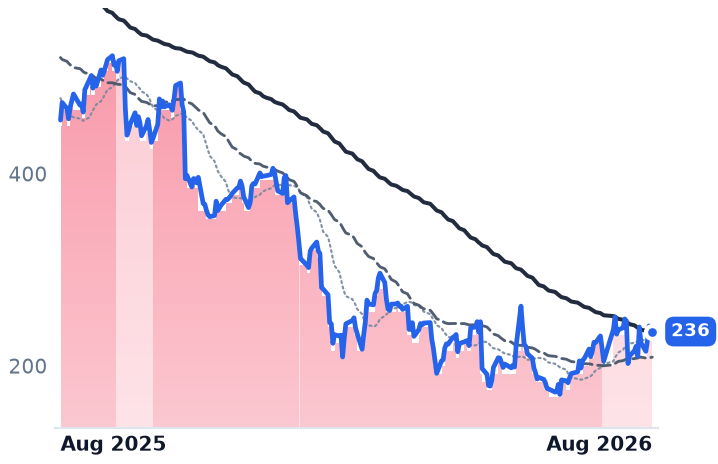
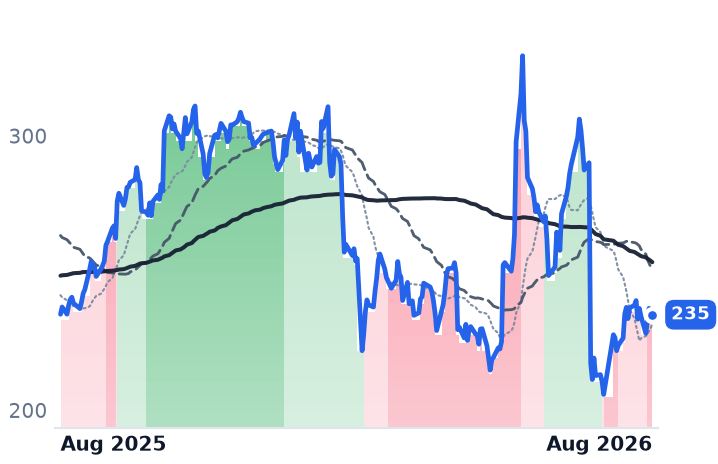
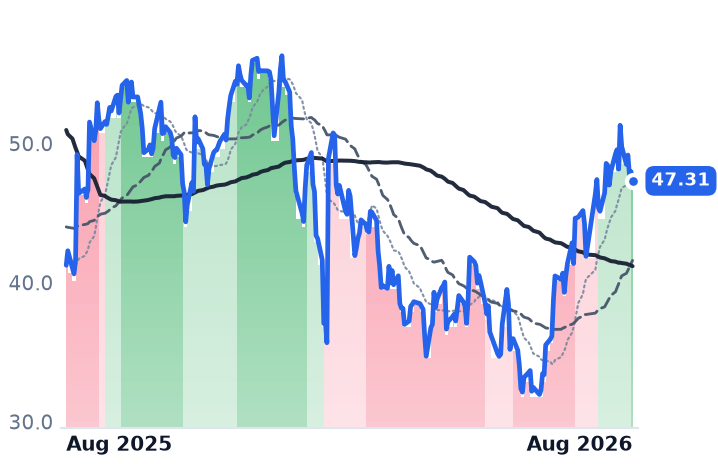
What happened instead was a rescue of the entire de-rated software complex. Nvidia's Jensen Huang told investors that agentic artificial intelligence expands rather than destroys software demand — "those agents are going to use more tools than ever" — after which ServiceNow rose 10% and Atlassian and HubSpot 6% each. Three Federal Reserve cuts through end-2025 did the rest, pulling money into long-duration, low-profitability equities of exactly this type. Asana's largest single advance came in the sessions to 28 July, when it gained 19% alongside Atlassian. Its second came on 7 August, Atlassian's earnings day, when that stock gapped 35.8% on 20.1m shares.
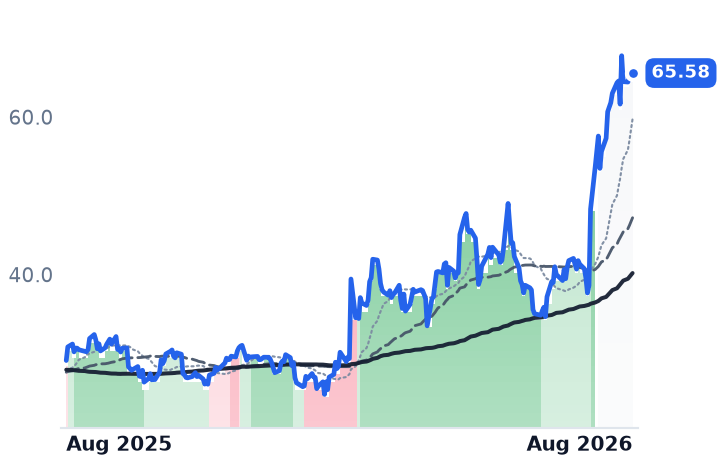
The pair did not lead the rebound; they trailed it. RingCentral rose 77% over the same window, Wix 68%, Appian 65% and Paycom 64%.
The number the whole case rests on
The argument for Asana is that AI Studio, sold by consumption rather than by user, breaks the link between revenue and headcount. It is a real disclosed line, not a slide: the company exited fiscal 2026 with over $6m of AI annual recurring revenue, growing more than 50% a quarter, with eight customers spending above $100,000 a year on it alone. Against $791m of total revenue, that is 0.8%.
The seat base it is meant to offset is still contracting. Dollar-based net retention was 96% in the April quarter, and 96% again among customers spending $100,000 or more — the largest accounts are shrinking as fast as the average one. The count of those accounts reached 817, up 12%, so what growth exists comes from new logos crossing the line, not expansion behind it. Revenue grew 9.5%, and has sat within half a point of that mark for four consecutive quarters. Guidance for the year is 7.5-8.5%. Gross margin fell 212 basis points to 87.6% as inference costs settled into cost of revenue.
The cost line is where Asana has genuinely changed. Non-GAAP operating margin hit a record 11.5%, up 720 basis points, and adjusted free cash flow was $34.4m against $9.9m a year earlier. Diluted shares grew 1.4%, a fraction of prior years. This is a business being run for cash, not a business whose demand has turned.
That matters for what the price now assumes. Asana trades at 3.18x trailing gross profit, against 2.72x in late July and roughly 2.1x three months ago. Forward gross profit takes it only to 2.99x — a 6% spread, meaning almost no gross-profit growth is expected. Atlassian, competing for the same enterprise work-coordination budget with Cloud revenue up 31% and remaining performance obligations up 44%, commands 7.1x. The market pays more than twice as much per dollar of gross profit for the name whose seats are growing.
The one that fell on its own news
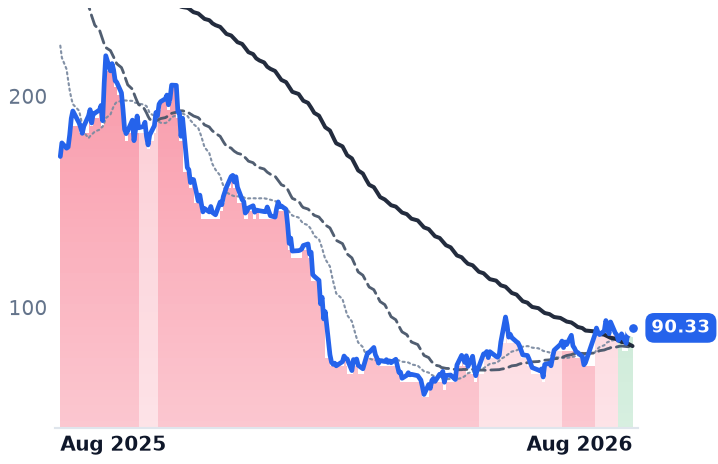
Monday.com, an Israeli company selling a configurable "Work OS" from which customers assemble their own apps, is the inverse trade. It reported on 10 August and the shares fell 5.6%. Revenue of $364.6m grew 21.9%, down from 26.2% three quarters earlier, and third-quarter guidance implies 16-17%. Net dollar retention slipped to 109%, its lowest ever, with management calling 108% the floor. In July it cut about 630 jobs, a fifth of staff, for roughly $100m of annual savings.
The other half of the print was strong. It crossed $1.5bn in annual recurring revenue, with customers above $100,000 up 37% and above $500,000 up 68%. AI revenue doubled in a quarter to 17% of net new bookings — twenty times Asana's share. Operating income turned positive at $19.9m. Diluted shares fell 16.6% on an $870m buyback that is now fully spent.
And its multiple never moved: 3.16x trailing gross profit, unchanged since late July, for a company growing twice as fast as Asana at the same price per dollar of gross profit. Forward earnings are 16.6x against 38.0x trailing, trailing free-cash-flow yield is 7.8%, and the shares sit 59% below their high.
The setup
Where it stands — A sector-wide rebound lifted both names; only Asana's multiple re-rated, and only monday.com's numbers were tested by an earnings print.
Would confirm — Asana's 3 September report showing net retention back above 100% and AI revenue past 2% of total.
Would invalidate — Asana guiding fiscal 2027 revenue growth below 7.5% with net retention still at 96%.
Watch next — Asana reports second-quarter results after the close on Thursday 3 September.
Valuation — Asana 3.18x trailing gross profit, 2.99x forward, versus 2.72x in late July and 7.1x at Atlassian.