

Amplitude Bought Half Its New Recurring Revenue and Lost 4.5 Points of Gross Margin
Hypothesis Opus 5 · Research Opus 5 · Writing Opus 5 · Prompt v1.5
Amplitude's revenue growth accelerated in the June quarter for the first time in over a year, and the shares have nearly doubled since May. Both facts are true; the second is running well ahead of the first. Of the $36m of annual recurring revenue Amplitude added, $17m arrived with the Statsig acquisition rather than from selling more software, and gross margin fell to 68.5% from 73.0% three months earlier as acquired workloads, inference costs and record data ingestion landed in cost of revenue.
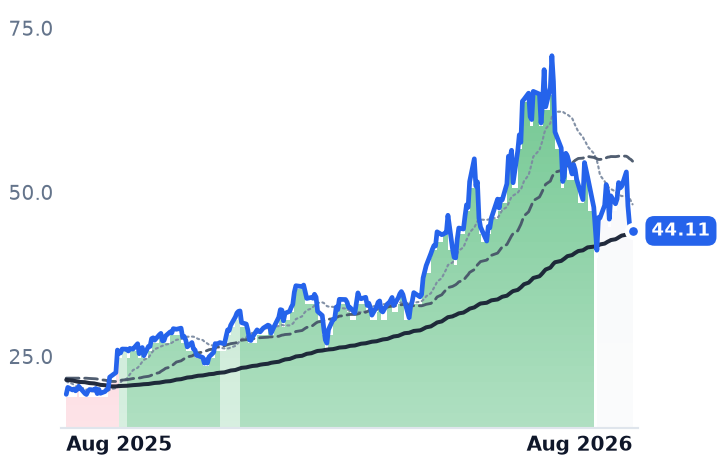
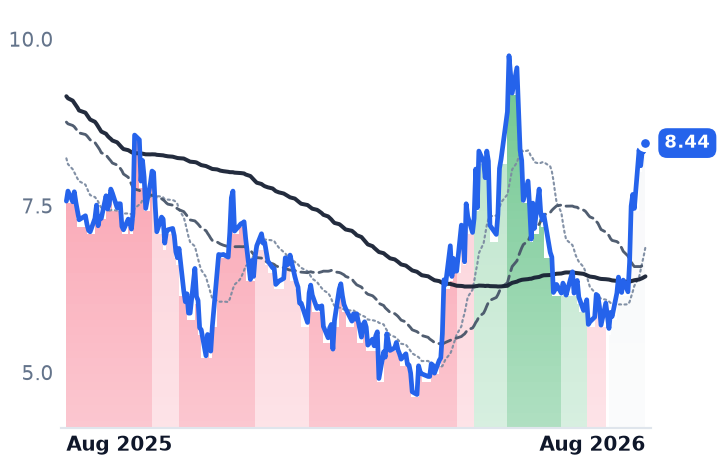
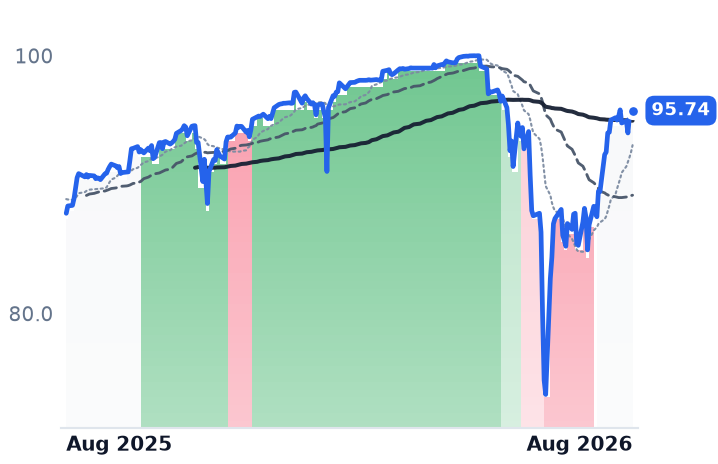
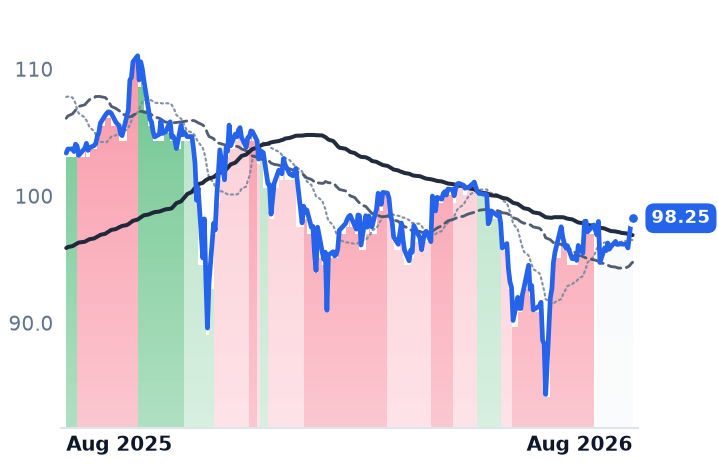
The price paid per dollar of Amplitude's trailing gross profit has gone from 3.31x in May to 6.51x — a 97% expansion against gross profit that grew 6.8%. Dynatrace, the larger and cash-generative observability vendor, sits on the opposite side: it raised guidance, is buying back stock, and still trades at 8.43x gross profit against Datadog's 26.3x, flat over twelve months.
| Ticker | Company | Segment | Trend · 13mo | 30D | 1Y |
|---|---|---|---|---|---|
| The subject · what this brief is about | |||||
AMPL | Amplitude | Other | 🌱 Emerging Bull | +45.8% | +16.6% |
DT | Dynatrace | Other | 🌱 Emerging Bull | +18.2% | +0.1% |
| Compared against · context, not the story | |||||
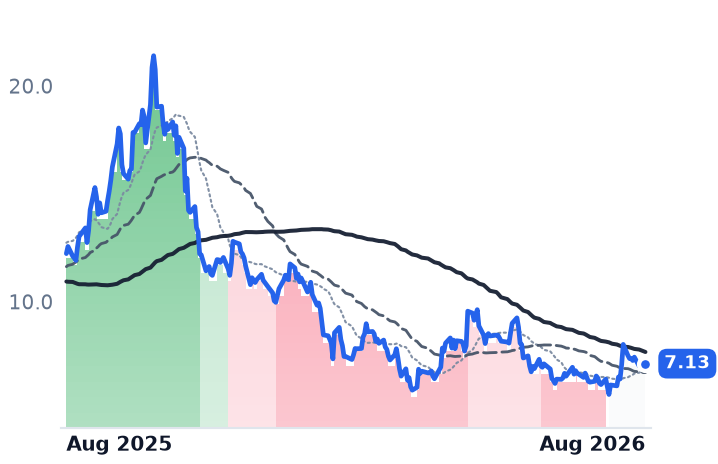
PRGS | Progress Software | Other | 🔴 Cont. Bear | +14.4% | −3.0% |
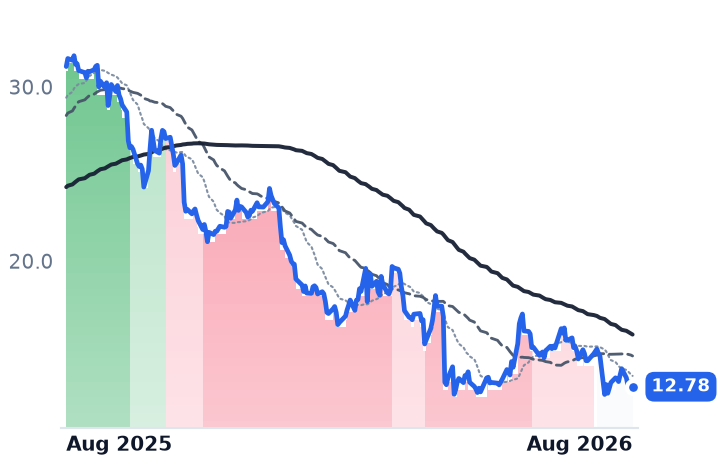
CXM | Sprinklr | Other | 🔴 Cont. Bear | +29.2% | −13.4% |
DDOG | Datadog | Data & Analytics Platforms | 🟢 Cont. Bull | −5.0% | +80.7% |
PANW | Palo Alto Networks | Cybersecurity & Threat Protection | 🌱 Emerging Bull | +4.5% | +91.1% |
MNDY | monday.com | Other | 🔴 Cont. Bear | +22.2% | −47.3% |
HUBS | HubSpot | Customer Experience & CRM | 🔴 Cont. Bear | +15.1% | −48.3% |
INTU | Intuit | Enterprise Resource Planning | 🔴 Cont. Bear | +28.5% | −47.3% |
ASAN | Asana | Other | 🌱 Emerging Bull | +37.0% | −31.2% |
BULL | Webull Corporation Class A Ordinary Shares | Other | 🌱 Emerging Bull | +13.1% | −35.8% |
BVC | BitVentures | Other | 🟢 Cont. Bull | +31.2% | +2306.4% |
DJCO | Daily Journal | Other | 🟢 Cont. Bull | +5.4% | +38.8% |
GRND | Grindr | Other | 🌱 Emerging Bull | +6.3% | −2.1% |
HKD | AMTD Digital | Other | 🌱 Emerging Bull | +5.8% | +8.5% |
HQ | Horizon Quantum Holdings Ltd. Class A Ordinary Shares | Other | 🌱 Emerging Bull | +21.3% | +80.3% |
IBTA | Ibotta | Other | 🌱 Emerging Bull | +35.7% | +36.8% |
KDK | Kodiak AI | Other | 🔴 Cont. Bear | −13.0% | −51.4% |
LIF | Life360 | Other | 🔴 Cont. Bear | −14.5% | −48.4% |
NATL | NCR Atleos | Other | 🟢 Cont. Bull | −2.2% | +24.5% |
PDFS | PDF Solutions | Other | 🟢 Cont. Bull | −17.4% | +129.5% |
RUM | Rumble | Other | 🌱 Emerging Bull | +37.2% | +11.5% |
SOUN | SoundHound AI | Other | 🔴 Cont. Bear | +10.4% | −41.7% |
SRAD | Sportradar | Other | 🔴 Cont. Bear | −10.5% | −59.0% |
STRC | Strategy | Other | ⚠️ Emerging Bear | +9.5% | +9.1% |
STRF | MicroStrategy Incorporated 10.00% Series A Perpetual Strife Preferred Stock | Other | 🔴 Cont. Bear | +0.2% | −5.0% |
UPBD | Upbound | Other | 🌱 Emerging Bull | −12.4% | −16.5% |
WLTH | Wealthfront | Other | 🔴 Cont. Bear | +1.4% | −33.2% |
YALA | Yalla | Other | 🔴 Cont. Bear | +2.4% | −29.2% |
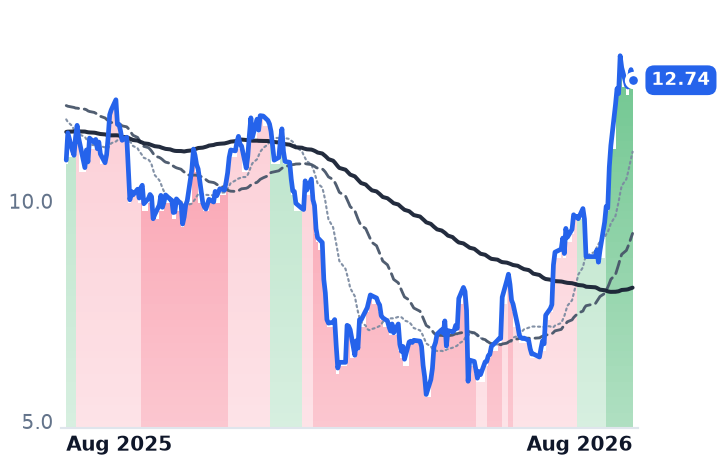
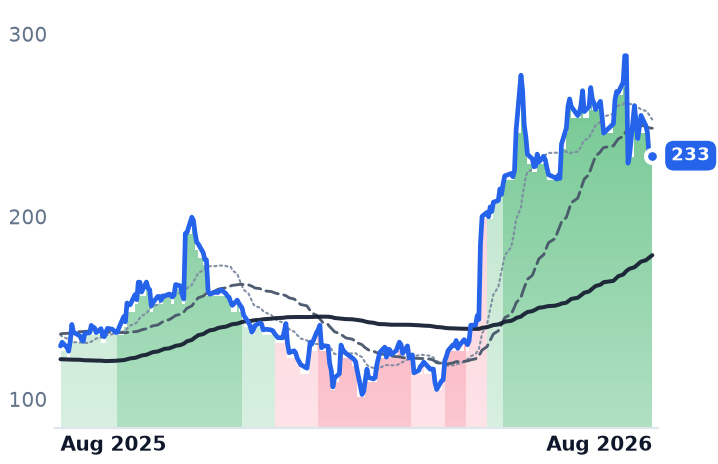
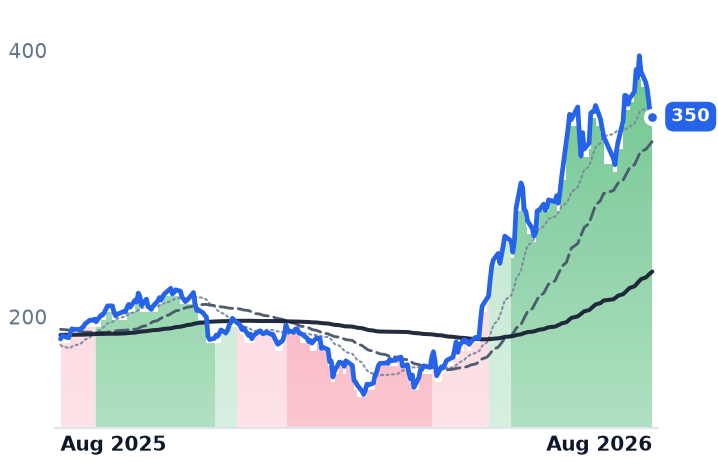
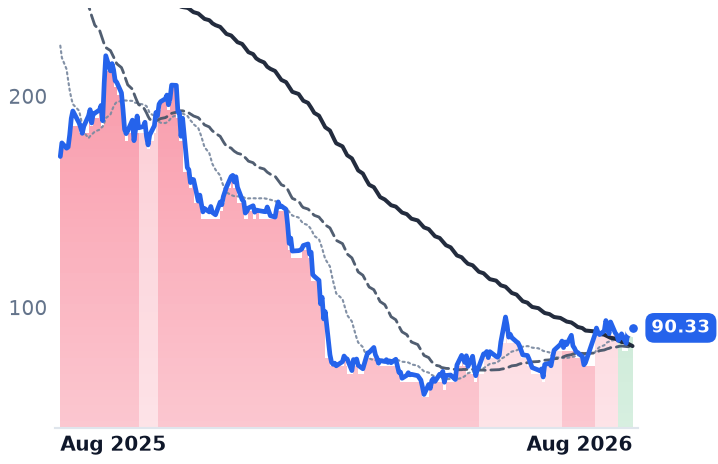
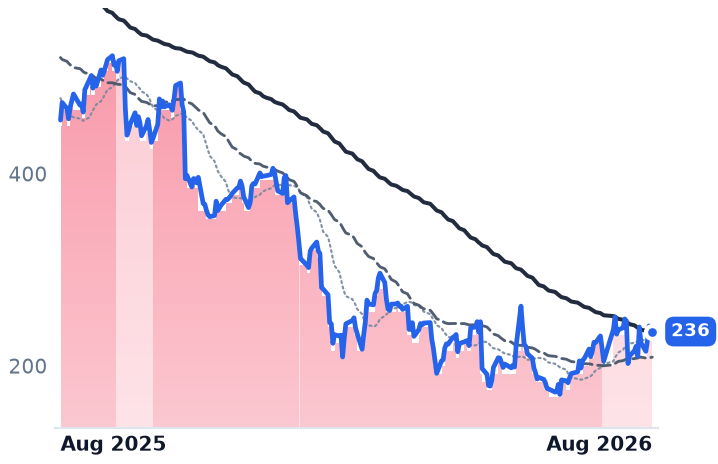
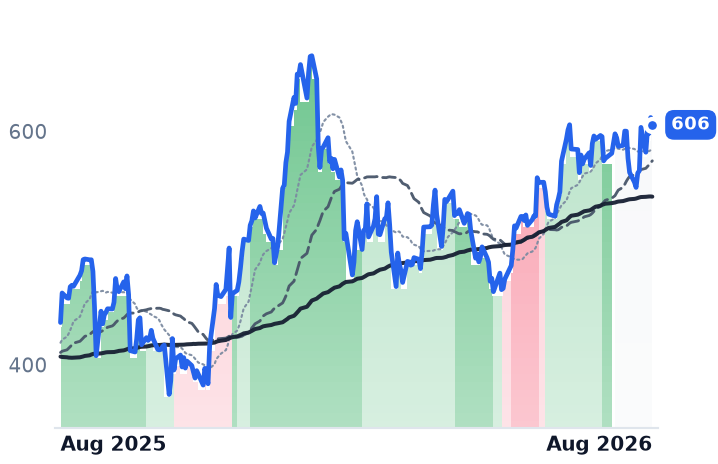
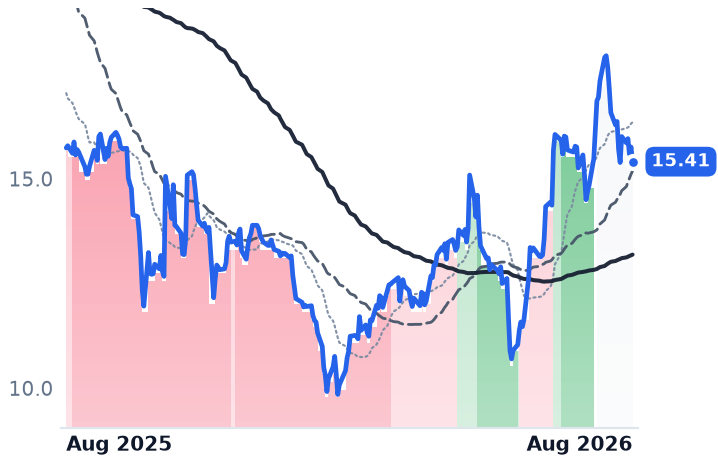
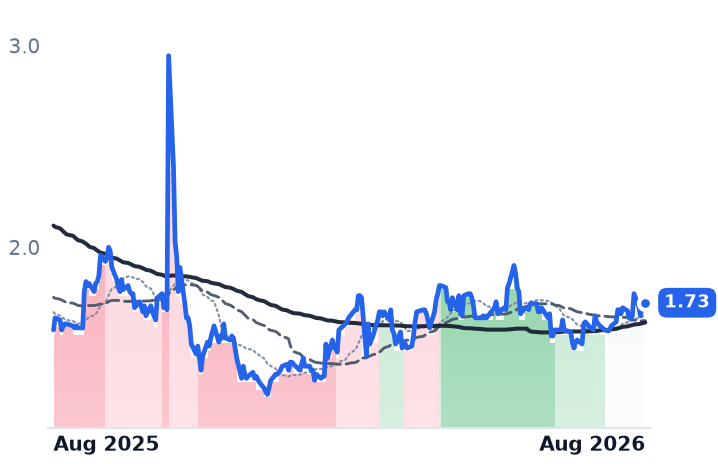
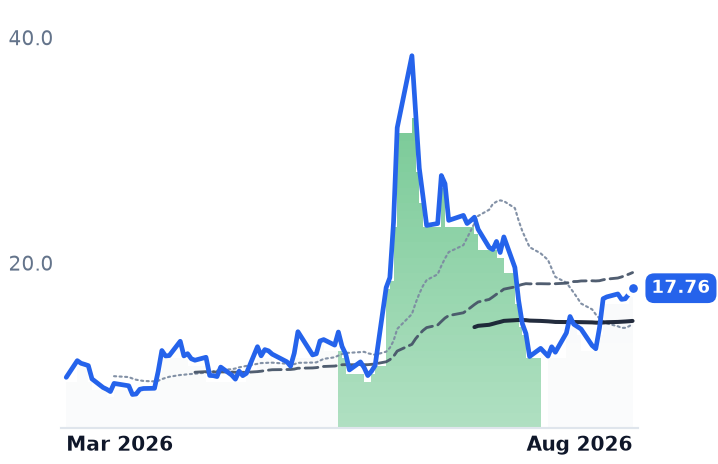
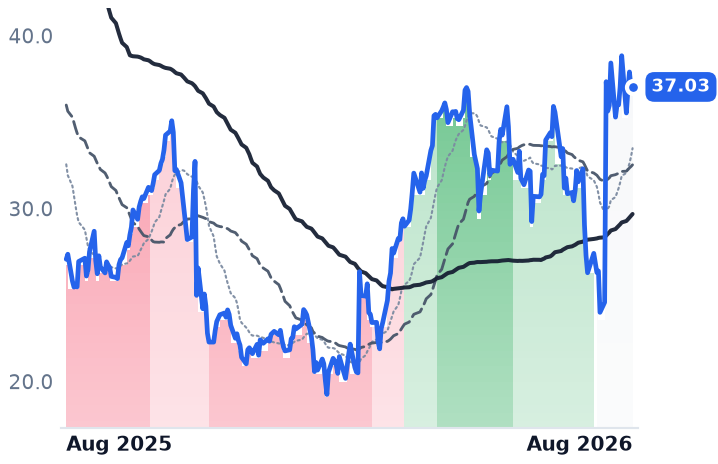
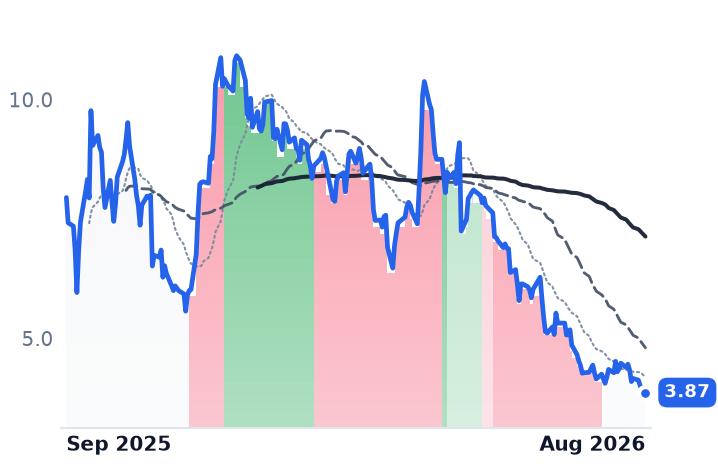
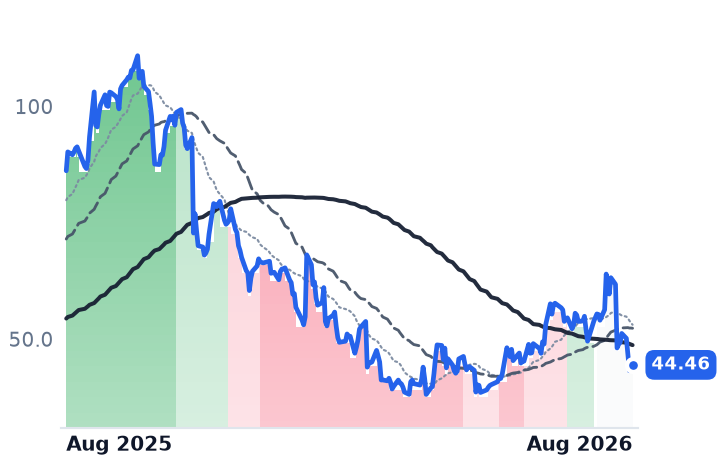
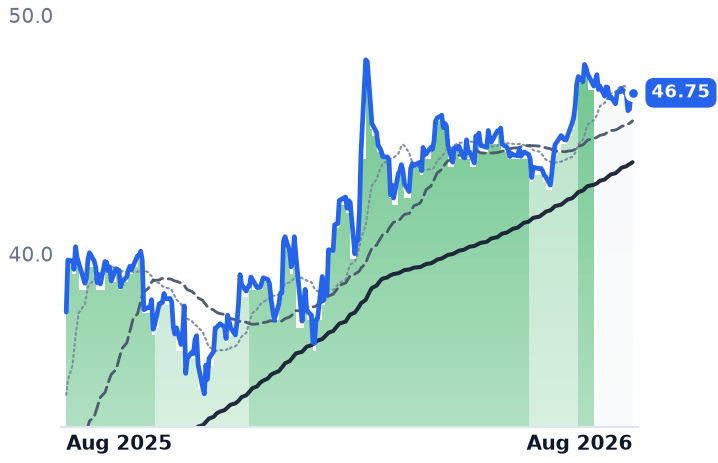
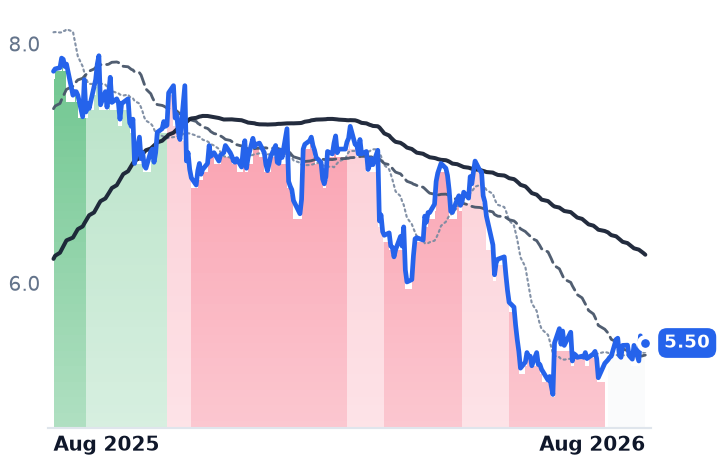
12-month price & trend
| Ticker | Mkt cap | P/E | P/E fwd | P/S | P/S fwd | P/GP | P/GP fwd | EV/EBITDA | FCF yld |
|---|---|---|---|---|---|---|---|---|---|
AMPL | $1.8B | n/m | 187.3x | 4.7x | 4.3x | 6.5x | 5.9x | n/m | 1.6% |
DT | $14.4B | 97.0x | 24.9x | 6.9x | 6.2x | 8.4x | 7.6x | 44.1x | 4.0% |
PRGS | $1.8B | 21.2x | 7.2x | 1.8x | 1.8x | 2.3x | 2.3x | 10.6x | 16.8% |
| Ticker | Mkt cap | P/E | P/E fwd | P/S | P/S fwd | P/GP | P/GP fwd | EV/EBITDA | FCF yld |
|---|---|---|---|---|---|---|---|---|---|
CXM | $1.8B | 64.3x | 15.1x | 2.1x | 2.1x | 3.2x | 3.2x | 25.1x | 7.5% |
DDOG | $82.6B | 466.8x | 91.8x | 20.8x | 18.5x | 26.2x | 23.3x | 317.0x | 1.4% |
PANW | $290.7B | 299.7x | 86.9x | 27.4x | 21.0x | 38.1x | 29.2x | 127.4x | 1.5% |
| Ticker | Mkt cap | P/E | P/E fwd | P/S | P/S fwd | P/GP | P/GP fwd | EV/EBITDA | FCF yld |
|---|---|---|---|---|---|---|---|---|---|
MNDY | $3.8B | 38.0x | 16.6x | 2.8x | 2.6x | 3.2x | 2.9x | 34.1x | 7.8% |
HUBS | $12.3B | 84.8x | 18.1x | 3.6x | 3.3x | 4.3x | 4.0x | 40.8x | 6.2% |
INTU | $89.0B | 19.7x | 11.9x | 4.3x | 3.7x | 5.2x | 4.6x | 13.0x | 8.7% |
| Ticker | Mkt cap | P/E | P/E fwd | P/S | P/S fwd | P/GP | P/GP fwd | EV/EBITDA | FCF yld |
|---|---|---|---|---|---|---|---|---|---|
ASAN | $2.3B | n/m | 25.7x | 2.8x | 2.6x | 3.2x | 3.0x | n/m | 4.9% |
BULL | $4.7B | 102.5x | 42.5x | 6.9x | 5.9x | 8.9x | 7.7x | 40.9x | 0.0% |
BVC | $2.5B | n/m | — | n/m | — | — | — | n/m | -0.3% |
| Ticker | Mkt cap | P/E | P/E fwd | P/S | P/S fwd | P/GP | P/GP fwd | EV/EBITDA | FCF yld |
|---|---|---|---|---|---|---|---|---|---|
DJCO | $826.4M | n/m | — | 8.5x | — | 15.1x | — | 18.6x | 2.1% |
GRND | $2.8B | 29.9x | 26.4x | 5.4x | 5.1x | 7.2x | 6.8x | 22.6x | 5.4% |
HKD | $812.1M | 9.7x | — | 13.8x | — | 20.9x | — | 9.2x | 0.0% |
| Ticker | Mkt cap | P/E | P/E fwd | P/S | P/S fwd | P/GP | P/GP fwd | EV/EBITDA | FCF yld |
|---|---|---|---|---|---|---|---|---|---|
HQ | $1.1B | n/m | 3.8x | n/m | — | — | — | n/m | -1.4% |
IBTA | $958.2M | n/m | — | 2.8x | 2.7x | 3.6x | 3.5x | 150.1x | 6.9% |
KDK | $761.0M | n/m | — | 106.4x | 70.5x | — | — | n/m | -24.6% |
| Ticker | Mkt cap | P/E | P/E fwd | P/S | P/S fwd | P/GP | P/GP fwd | EV/EBITDA | FCF yld |
|---|---|---|---|---|---|---|---|---|---|
LIF | $3.6B | 22.6x | 36.8x | 6.3x | 5.4x | 8.2x | 6.9x | 93.5x | 3.2% |
NATL | $3.4B | 17.6x | 9.7x | 0.8x | 0.8x | 3.1x | 3.0x | 7.6x | 3.2% |
PDFS | $1.9B | 181.4x | 35.4x | 7.9x | 7.2x | 11.1x | 10.1x | 61.2x | -0.1% |
| Ticker | Mkt cap | P/E | P/E fwd | P/S | P/S fwd | P/GP | P/GP fwd | EV/EBITDA | FCF yld |
|---|---|---|---|---|---|---|---|---|---|
RUM | $3.9B | n/m | — | 33.4x | 16.1x | 157.7x | 76.1x | n/m | -3.9% |
SOUN | $3.2B | n/m | — | 15.7x | 13.4x | 42.0x | 36.0x | n/m | -3.7% |
SRAD | $3.8B | 216.9x | 55.5x | 2.4x | 2.5x | 8.3x | 8.7x | 8.9x | 8.9% |
| Ticker | Mkt cap | P/E | P/E fwd | P/S | P/S fwd | P/GP | P/GP fwd | EV/EBITDA | FCF yld |
|---|---|---|---|---|---|---|---|---|---|
STRC | $33.2B | n/m | — | 79.2x | 66.8x | 117.1x | 98.8x | n/m | 28.7% |
STRF | $29.6B | n/m | — | 79.2x | — | 117.1x | — | n/m | 28.7% |
UPBD | $1.1B | 11.8x | 4.5x | 0.2x | 0.2x | 0.5x | 0.5x | 1.5x | 32.5% |
| Ticker | Mkt cap | P/E | P/E fwd | P/S | P/S fwd | P/GP | P/GP fwd | EV/EBITDA | FCF yld |
|---|---|---|---|---|---|---|---|---|---|
WLTH | $1.4B | n/m | 25.4x | 3.7x | 3.6x | 13.7x | 13.4x | n/m | 9.8% |
YALA | $870.8M | 6.3x | 7.1x | 2.6x | 2.6x | 3.8x | 3.8x | 4.5x | 0.0% |
Consensus projections
| Ticker | FY2026E | FY2027E | FY2028E | |
|---|---|---|---|---|
AMPL | Revenue | +19.9% | +16.3% | +19.1% |
| EPS | +1.6% | +133.8% | +61.5% | |
DT | Revenue | +18.9% | +15.6% | +15.0% |
| EPS | +22.8% | +17.8% | +14.6% | |
PRGS | Revenue | +1.9% | +0.7% | +2.4% |
| EPS | +11.4% | +1.8% | +0.6% | |
CXM | Revenue | +7.5% | +1.6% | +4.0% |
| EPS | +41.6% | +7.9% | +11.1% | |
DDOG | Revenue | +31.7% | +22.3% | +23.0% |
| EPS | +25.3% | +17.0% | +22.2% | |
PANW | Revenue | +24.3% | +21.2% | +14.2% |
| EPS | +15.3% | +8.8% | +17.7% | |
MNDY | Revenue | +19.8% | +15.2% | +14.9% |
| EPS | +27.8% | +22.3% | +19.1% | |
HUBS | Revenue | +18.2% | +14.2% | +14.0% |
| EPS | +38.2% | +25.7% | +18.6% | |
INTU | Revenue | +13.9% | +11.3% | +10.8% |
| EPS | +18.5% | +15.0% | +12.6% | |
ASAN | Revenue | +9.2% | +8.9% | +7.9% |
| EPS | −272.8% | +45.4% | +26.1% | |
BULL | Revenue | +39.8% | +23.4% | −6.4% |
| EPS | +5.1% | +46.8% | +47.2% | |
GRND | Revenue | +24.5% | +17.1% | +15.3% |
| EPS | +21.9% | +34.0% | +24.8% | |
HQ | Revenue | — | — | — |
| EPS | — | −109.4% | +9.3% | |
IBTA | Revenue | +4.4% | +8.9% | +9.9% |
| EPS | −589.8% | −58.4% | −53.0% | |
KDK | Revenue | +189.3% | +209.7% | +315.3% |
| EPS | −86.1% | +35.4% | −26.2% | |
LIF | Revenue | +38.6% | +22.6% | +18.1% |
| EPS | +20.5% | +45.2% | +45.9% | |
NATL | Revenue | +2.6% | +4.2% | +5.3% |
| EPS | +19.6% | +11.7% | +22.4% | |
PDFS | Revenue | +20.6% | +20.8% | +20.3% |
| EPS | +51.1% | +26.3% | +24.1% | |
RUM | Revenue | +142.1% | +129.3% | −50.7% |
| EPS | +103.4% | −72.0% | −342.4% | |
SOUN | Revenue | +41.4% | +34.0% | −17.9% |
| EPS | +71.7% | +5.3% | −100.0% | |
SRAD | Revenue | +20.2% | +11.9% | +10.8% |
| EPS | −41.5% | +112.9% | +48.1% | |
STRC | Revenue | +5.0% | +2.0% | +3.8% |
| EPS | −208.6% | −141.3% | +472.7% | |
UPBD | Revenue | +1.4% | +4.3% | +5.4% |
| EPS | +1.3% | +10.6% | +11.7% | |
WLTH | Revenue | +6.7% | +4.6% | +19.5% |
| EPS | −100.7% | −1689.6% | +39.0% | |
YALA | Revenue | −0.8% | +12.1% | +10.4% |
| EPS | −4.2% | +1.9% | −100.0% |
Forward fiscal years only. Blank means no analyst coverage for that year.
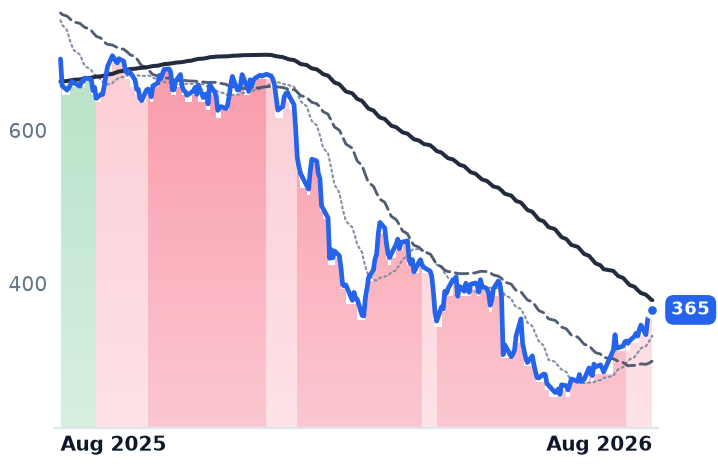
Amplitude, which sells software that tells app and website owners which features people actually use, told investors on 5 August that June-quarter revenue grew 21.2% to $100.9m. That was an acceleration from 16.9% in the March quarter, and the first genuine reacceleration in more than a year at a company that had spent two years decelerating. The shares, which had fallen 21.4% in a single session after the March report, have since gone from $6.52 in late May to $12.74.
The reacceleration was, in large part, purchased. Annual recurring revenue reached $410m, up 22%, but only $19m of the $36m added in the quarter was organic — the other $17m came with Statsig, the experimentation and feature-flagging startup Amplitude acquired. Of the 824 customers now paying more than $100,000 a year, up 30%, forty arrived in the same transaction. Net dollar retention of 105% is quoted on a pro forma basis that includes Statsig's book.
What the acquisition costs to run
The bill shows up one line down. Gross margin fell to 68.5% from 73.0% in March and 72.6% a year earlier, so gross profit grew 14.3% while revenue grew 21.2%. Management named three causes: Statsig runs on Google Cloud at margins currently in the low 50s pending optimization, AI tooling is generating elevated inference costs, and customer data ingestion is at an all-time high. Margins are guided to stay in the low 70s near term.
That last item is the mechanism the whole usage-priced software story rests on — more data ingested means more billed — arriving as a cost before it arrives as revenue. The rest of Amplitude's quarter is stronger than the headline suggests: free cash flow was a record $23.7m, the non-GAAP operating loss narrowed to $1.5m, remaining performance obligations rose 35% to $483m, and the company bought back $69m of stock, shrinking the diluted share count. On a GAAP basis the operating loss widened to $35.2m.
Amplitude is the number-two product-analytics vendor by deployments, at 28.1% of tracked installations against PostHog's 45.6% and Mixpanel's 10.5%. Management's own stated near-term risk is that customers do not know what it now sells — many were unaware of the Statsig deal or the wider suite.
The price ran further than the business
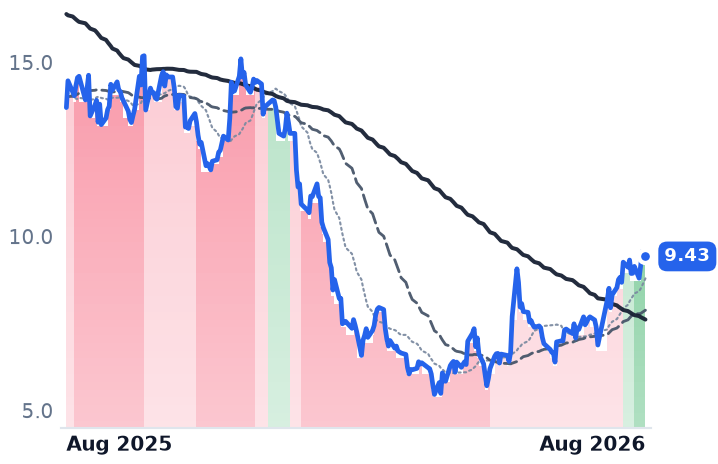
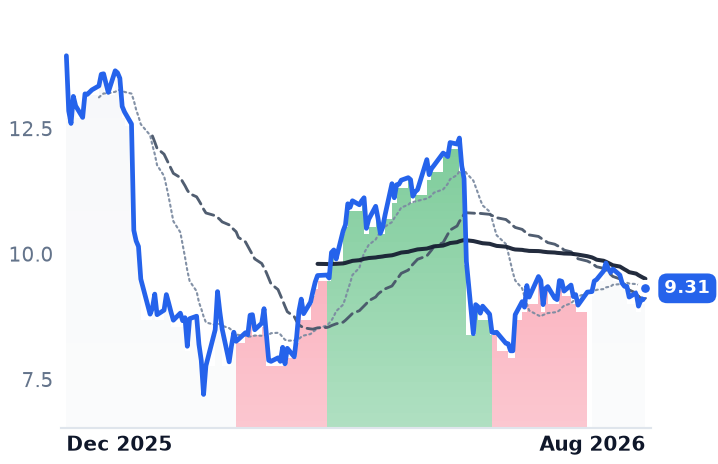
Amplitude now costs 6.51x its trailing gross profit and 5.94x the forward figure, against 3.31x in May and 3.73x in February. That is a 97% multiple expansion in three months against trailing gross profit that grew 6.8%. As recently as late July the shares fetched 4.42x. The post-earnings continuation came not from new disclosure but from a run of analyst price-target increases — Piper Sandler and UBS to $13, Morgan Stanley to $16 and Bank of America to $14.
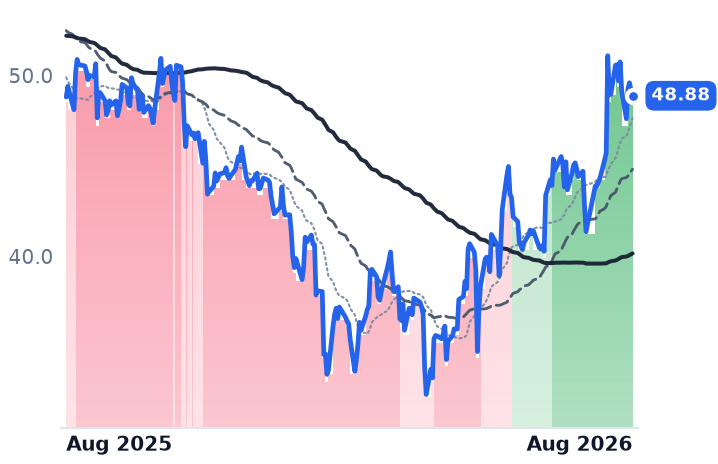
Dynatrace, which monitors cloud applications for large enterprises and diagnoses what breaks, is the other side of the comparison. Its ARR reached $2.14bn, up 17% in constant currency, with net new ARR of $85m; trailing-twelve-month organic net-new-ARR growth hit 17% against 12% a quarter earlier, a fourth straight quarter of acceleration. Adjusted free cash flow runs at 28% of revenue, the diluted share count is down 3.5% year over year after $275m of buybacks in one quarter, and full-year revenue and margin guidance were both raised. The shares jumped nearly 11% premarket on the print. At 8.43x trailing gross profit it remains the cheapest large observability name — Datadog trades at 26.3x — and at $48.88 it is exactly flat against $48.81 a year ago.
Not a telemetry re-rating
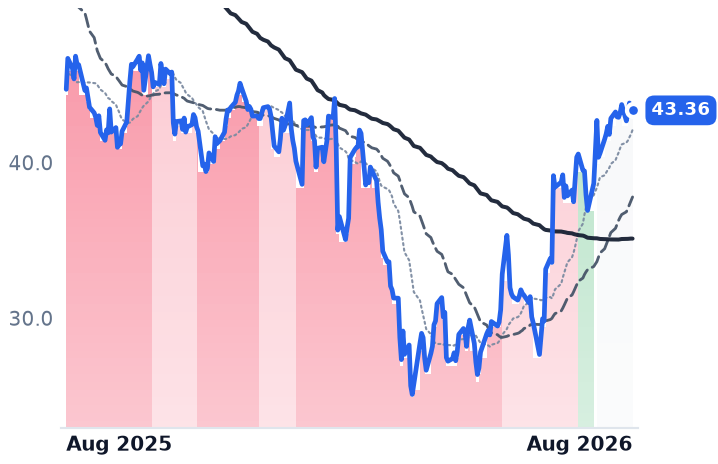
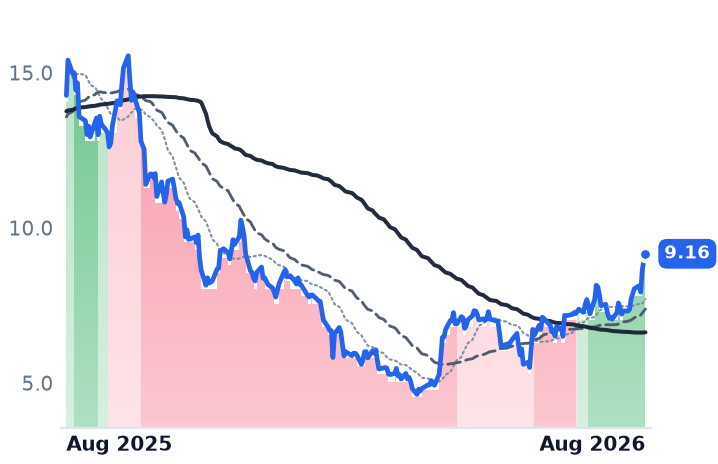
The tempting reading is that software priced by data volume re-rated while software priced by seats did not. It does not survive the dates. Dynatrace's entire 90-day advance sits in three sessions — 5 August's results, 26 June and 1 July. Strip those and the ninety days are worth 0.4%. Two of the three are shared: Progress Software rose 11.2% and 16.6% on those same dates, Sprinklr 5.1% on the first.
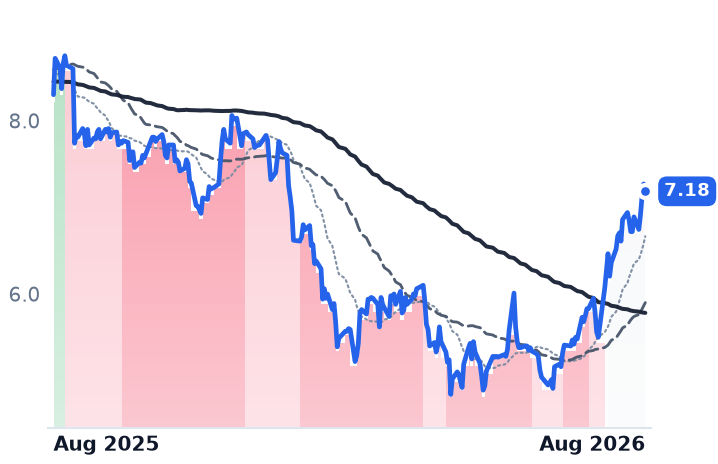
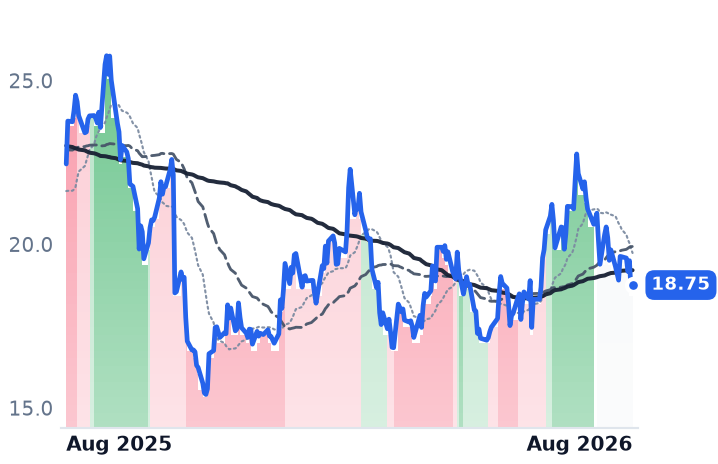
Progress, which sells developer and infrastructure software including the OpenEdge platform and MOVEit file transfer, had its own catalyst — June-quarter earnings of $1.62 a share against a $1.49 consensus, with full-year cash-flow guidance raised. It grew revenue 6.8% and still trades at 2.24x gross profit, a round trip to where it stood in February. Sprinklr, which sells customer-experience management software to large brands, is the weakest business of the four: revenue up 6.8%, gross margin down to 65.2% from 69.5%, gross profit essentially flat, and a chief executive who calls this a transition year spent paying down technical debt. Its multiple rose anyway, to 3.07x from 2.31x.
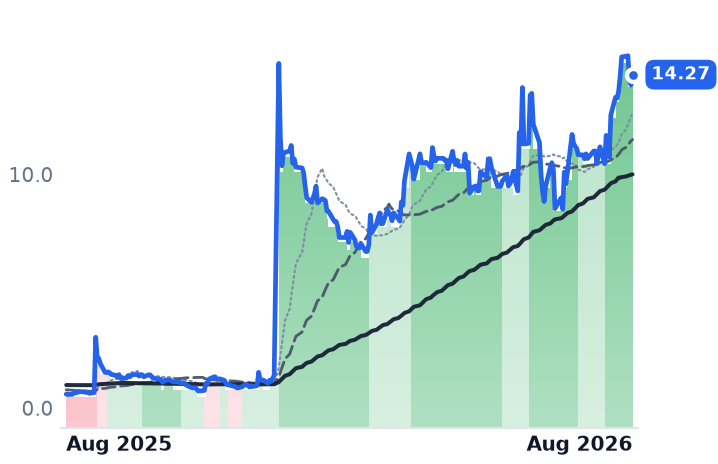
Nor is this falling rates. The 10-year Treasury yield sat at 4.682% in mid-August with investors shifting from expecting cuts to weighing increases. What moved was capital: the Philadelphia semiconductor index peaked above 14,600 in June and fell toward 11,200 in July, and money rotated into software, the side of the AI trade that had been priced as the loser. That bid is indiscriminate — Monday.com rose 7%, HubSpot 6% and Intuit 5% in a single session on 18 August, none of them priced by data ingested.
The setup
Where it stands — Amplitude's growth reaccelerated on an acquisition while its multiple nearly doubled; Dynatrace's accelerated organically and its multiple rose a quarter as much.
Would confirm — Amplitude organic net new ARR above $19m in the September quarter with gross margin recovering into the low 70s.
Would invalidate — Gross margin holding at or below 68.5% while net dollar retention slips back under 100% once Statsig laps.
Watch next — Amplitude's September-quarter report in November, its first full quarter with Statsig; Dynatrace's fiscal second half, when 70% of subscription renewals reset.
Valuation — Amplitude at 6.51x trailing and 5.94x forward gross profit, against 3.31x in May; Dynatrace 8.43x and 7.61x, against Datadog's 26.3x.