

Prysmian's Growth Now Comes From Data-Center Fiber, and It Fell With Corning
Hypothesis Opus 5 · Research Opus 5 · Writing Opus 5 · Prompt v1.5
Two suppliers of the physical inputs to the artificial-intelligence build-out — Prysmian's cable and Linde's gases — booked record order books this summer and lost ground anyway. Neither selloff was about artificial intelligence demand, and that is the unresolved part.
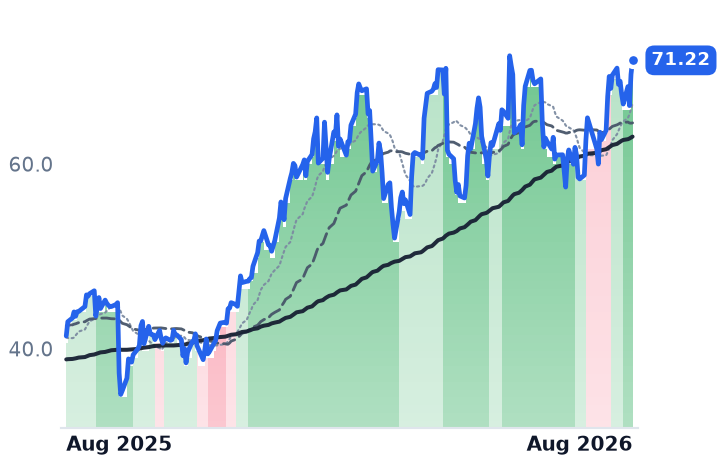
Prysmian, Europe's largest high-voltage cable maker, posted its best quarter ever on 30 July: revenue up 24.1% to €6.06bn and a record €730m of adjusted earnings before interest, tax, depreciation and amortization. Its marginal growth is no longer grid cable but optical fiber sold into data centers, and it accordingly dropped 8.9% during the late-July rout in optical stocks led by Corning. Linde's sale-of-gas backlog reached a record $8.1bn and electronics was its fastest end market at 18% growth — but the shares gapped down 5.95% on 31 July over margins at Lincare, a US home-oxygen unit. Prysmian's forward multiple is 25.5x, against roughly 32x in May.
| Ticker | Company | Segment | Trend · 13mo | 30D | 1Y |
|---|---|---|---|---|---|
| The subject · what this brief is about | |||||
PRY.MI | Prysmian S.p.A | Electrical Equipment & Parts | ⚠️ Emerging Bear | −3.0% | +70.3% |
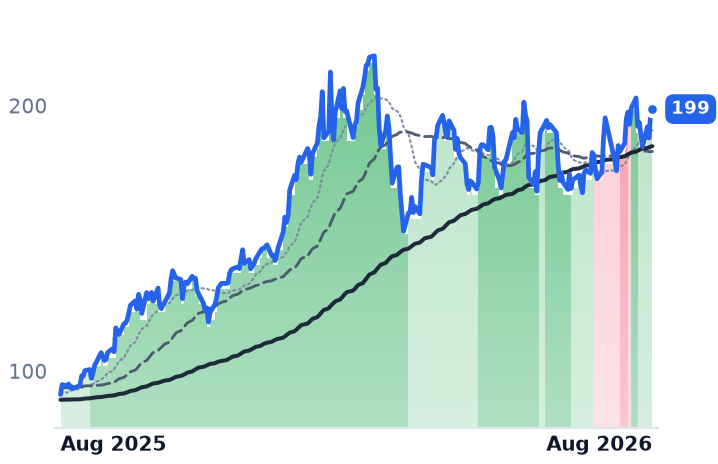
LIN | Linde | Industrial Gases | 🟢 Cont. Bull | −3.5% | +3.2% |
TECK | Teck Resources | Major Diversified Mining | 🟢 Cont. Bull | +20.5% | +117.9% |
| Compared against · context, not the story | |||||
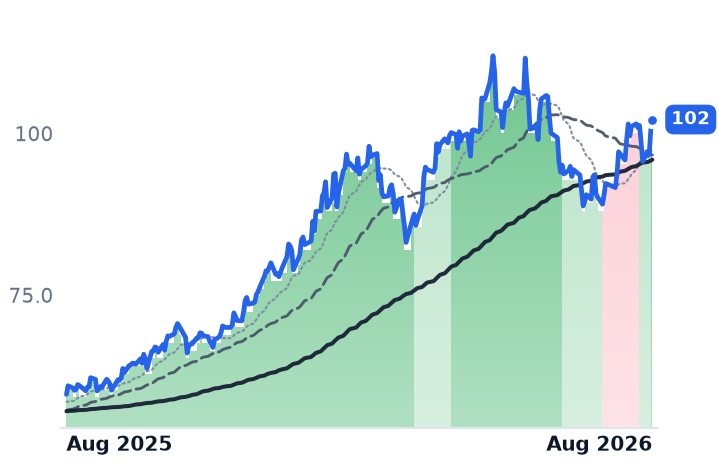
APD | Air Products and Chemicals | Industrial Gases | 🟢 Cont. Bull | +3.3% | +6.7% |
FCX | Freeport-McMoRan | Copper | 🟢 Cont. Bull | +17.7% | +85.0% |
SCCO | Southern Copper | Copper | 🟢 Cont. Bull | +10.2% | +136.1% |
RIO | Rio Tinto | Major Diversified Mining | 🟢 Cont. Bull | +14.0% | +76.4% |
NKT.CO | NKT A/S | Electrical Equipment & Parts | 🟢 Cont. Bull | +4.1% | +55.0% |
NEX.PA | Nexans | Electrical Equipment & Parts | ⚠️ Emerging Bear | +6.2% | +6.0% |
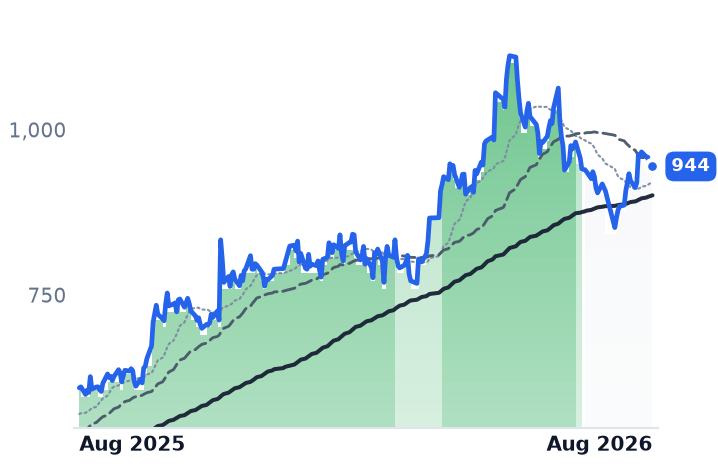
GLW | Corning | Display & Optical Materials | 🟢 Cont. Bull | −3.1% | +132.1% |
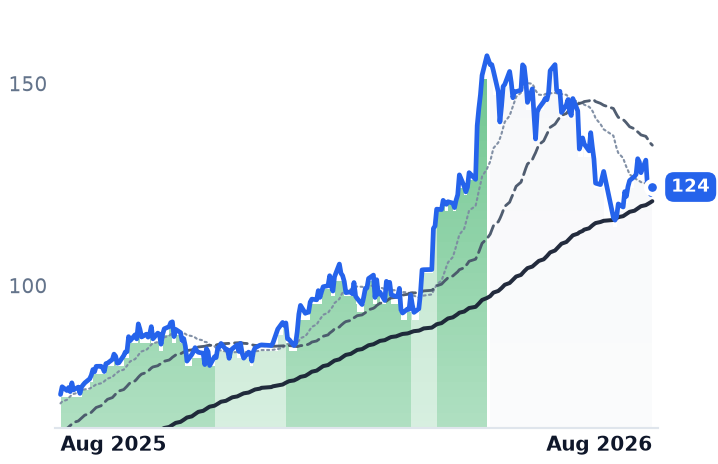
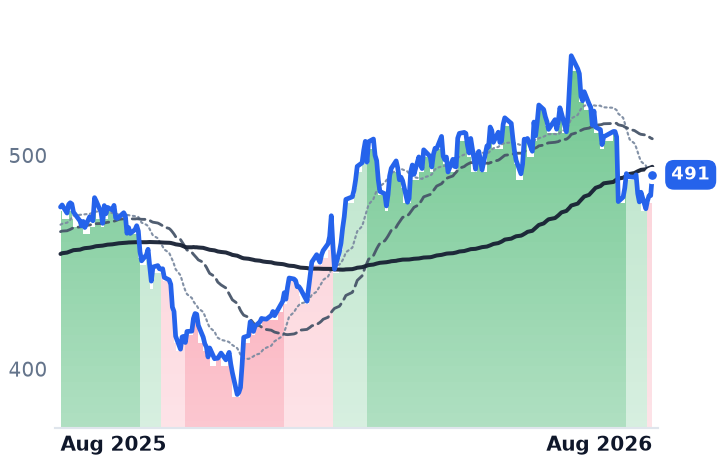
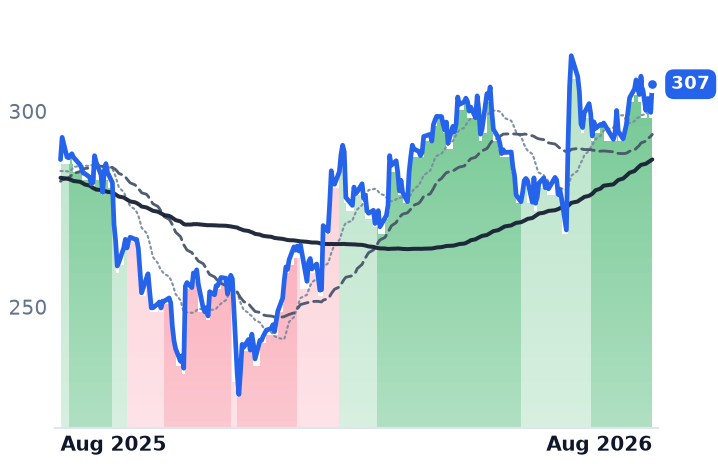
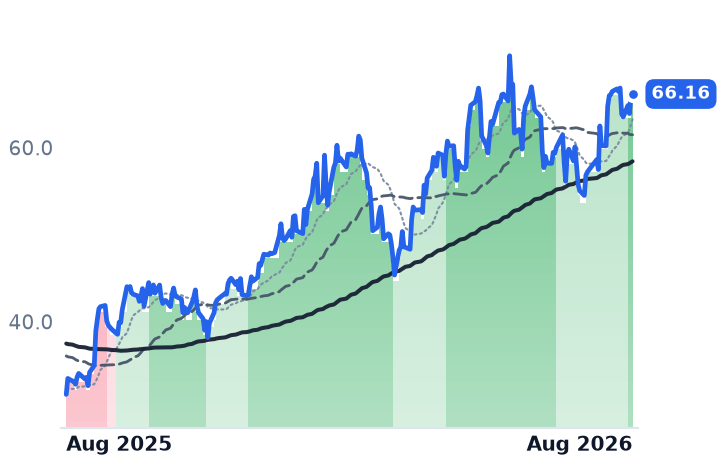
12-month price & trend
| Ticker | Mkt cap | P/E | P/E fwd | P/S | P/S fwd | P/GP | P/GP fwd | EV/EBITDA | FCF yld |
|---|---|---|---|---|---|---|---|---|---|
PRY.MI | $36.2B | 26.5x | 25.5x | 1.7x | 1.6x | 6.4x | 6.1x | 14.6x | 2.8% |
LIN | $225.5B | 31.3x | 27.3x | 6.4x | 6.2x | 13.9x | 13.6x | 18.5x | 2.2% |
APD | $67.9B | n/m | 22.7x | 5.4x | 5.3x | 16.8x | 16.6x | 65.6x | 3.0% |
| Ticker | Mkt cap | P/E | P/E fwd | P/S | P/S fwd | P/GP | P/GP fwd | EV/EBITDA | FCF yld |
|---|---|---|---|---|---|---|---|---|---|
TECK | $33.4B | 18.6x | 11.4x | 3.3x | 2.2x | 9.4x | 6.2x | 7.7x | 3.3% |
FCX | $99.3B | 34.0x | 23.7x | 3.8x | 3.4x | 14.3x | 12.6x | 11.7x | 6.0% |
SCCO | $154.0B | 27.0x | 24.1x | 9.8x | 9.2x | 15.7x | 14.7x | 15.8x | 3.9% |
| Ticker | Mkt cap | P/E | P/E fwd | P/S | P/S fwd | P/GP | P/GP fwd | EV/EBITDA | FCF yld |
|---|---|---|---|---|---|---|---|---|---|
RIO | $166.0B | 13.8x | 12.3x | 2.7x | 2.6x | 9.9x | 9.5x | 7.5x | 3.4% |
NKT.CO | $52.4B | 25.5x | — | 2.0x | — | 5.9x | — | 13.7x | -11.4% |
NEX.PA | $7.0B | 33.4x | 21.9x | 0.9x | 0.9x | 7.8x | 8.1x | 11.9x | 6.5% |
| Ticker | Mkt cap | P/E | P/E fwd | P/S | P/S fwd | P/GP | P/GP fwd | EV/EBITDA | FCF yld |
|---|---|---|---|---|---|---|---|---|---|
GLW | $129.0B | 67.8x | 45.7x | 7.6x | 6.7x | 20.9x | 18.5x | 34.8x | 1.9% |
Consensus projections
| Ticker | FY2026E | FY2027E | FY2028E | |
|---|---|---|---|---|
PRY.MI | Revenue | +13.2% | +10.5% | +7.4% |
| EPS | +19.3% | +27.6% | +18.4% | |
LIN | Revenue | +7.2% | +4.8% | +5.5% |
| EPS | +8.9% | +9.5% | +10.0% | |
APD | Revenue | +6.0% | +5.7% | +6.2% |
| EPS | +11.9% | +7.5% | +8.6% | |
TECK | Revenue | +45.4% | +0.1% | −15.4% |
| EPS | +130.4% | −14.6% | −25.9% | |
FCX | Revenue | +15.2% | +20.6% | +3.7% |
| EPS | +87.7% | +36.2% | +10.3% | |
SCCO | Revenue | +27.7% | −4.3% | +2.7% |
| EPS | +47.9% | −6.3% | −2.0% | |
RIO | Revenue | +12.4% | +2.1% | +1.5% |
| EPS | +24.8% | −0.3% | −2.0% | |
NKT.CO | Revenue | +3.0% | +15.5% | +14.5% |
| EPS | −8.9% | +39.9% | +48.0% | |
NEX.PA | Revenue | +3.9% | +5.9% | +5.3% |
| EPS | −11.4% | +21.2% | +16.4% | |
GLW | Revenue | +17.4% | +18.7% | +21.5% |
| EPS | +29.9% | +31.8% | +37.3% |
Forward fiscal years only. Blank means no analyst coverage for that year.
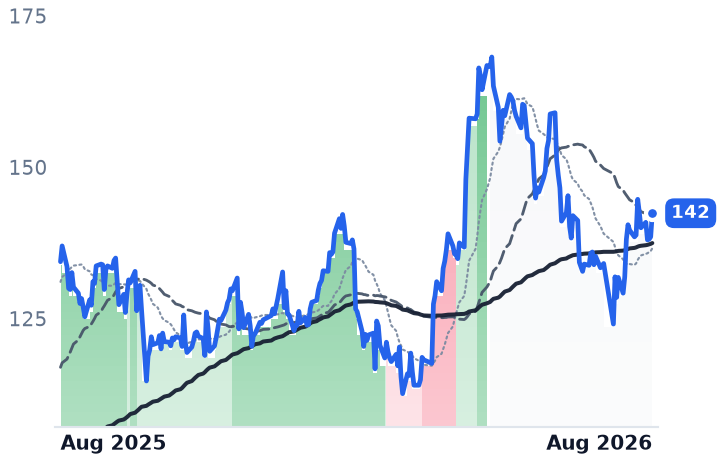
Prysmian, the Milan-based maker of the high- and extra-high-voltage cable that connects power plants, offshore wind farms and substations, reported the best quarter in its history on 30 July. Revenue rose 24.1% year on year to €6.06bn. Adjusted EBITDA hit a record €730m, full-year guidance went from €2.7bn to €2.8–2.9bn, and free cash flow guidance was lifted to about €1.7bn. The shares are down 20.7% from their 11 May peak of €156.90.
The cable maker became an optical company
The reason is not the grid. Prysmian's Transmission unit — the part whose order book is, in effect, the interconnection queue priced in euros — grew 14.3% organically last quarter at a 21.2% margin, up from 17.1% a year earlier, on a €17bn backlog against an estimated €10bn annual market. That business is compounding fine.
What changed is where the next euro of growth comes from. In July Prysmian signed a ten-year agreement with Molex worth up to €5.5bn for optical cable used inside data centers, backed by a €1.25bn plan that more than doubles its US fiber capacity. Management has now signed more than €10bn of optical data-center business in total, including over €4.5bn with hyperscale cloud operators, and expects optical revenue to reach €1.7bn by 2030 from €600m in 2025, with 85–90% of it going to data centers versus about a third today. Digital Solutions is already the highest-margin unit in the group at 24%, above Transmission.
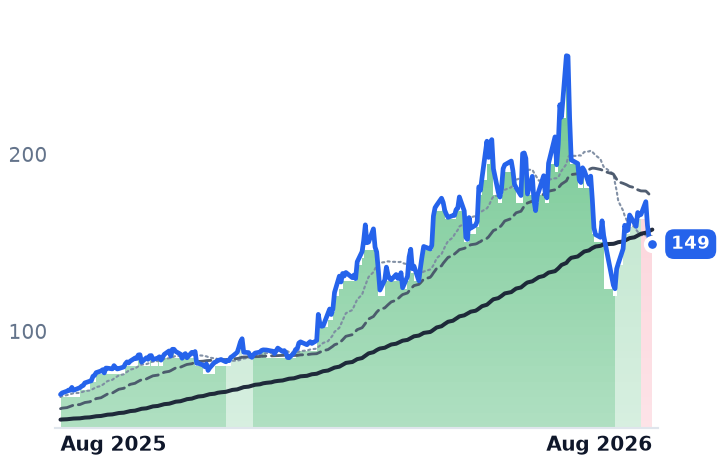
That repositioning has a price. Prysmian fell 8.9% between 22 and 28 July on no news of its own — the week Corning tumbled 12% and dragged the optical complex with it. A company most investors still file under European grid infrastructure now trades on the same sentiment as transceiver suppliers. Its cable peers de-rated too, Nexans down 10.7% and Denmark's NKT down 14.0% over three months, so some of this is sector-wide. Prysmian's forward price/earnings ratio is 25.5x against a trailing 26.5x, down from roughly 32x at the May high, while consensus has earnings per share compounding from €4.86 this year to €8.79 in 2029 — about 22% a year.
Linde's problem is oxygen tanks, not chips
Linde, which builds air-separation plants over the fence from customers and pipes gas to them under take-or-pay contracts lasting a decade or more, is the other name in this group that lost ground. Its numbers went the other way. Revenue growth has accelerated for four straight quarters, from 3.1% to 9.3%, reaching a record $9.29bn. Electronics — ultra-high-purity nitrogen, argon and specialty gases fed into semiconductor fabs — was the fastest end market at 18% growth. The sale-of-gas backlog reached a record $8.1bn, up $1bn in a single quarter, on roughly $1bn of advanced-node fab wins in the western United States and an approximately $800m Taiwanese joint venture. Full-year earnings guidance went up, to $17.70–17.90.
The stock's entire 30-day decline happened in one session. It fell 5.95% on 31 July, the day after results, on adjusted operating margin of 29.5% versus 30.1%. The culprit was Lincare, its US home-oxygen business, a roughly $45m quarterly drag; chief executive Sanjiv Lamba said he was not satisfied and is weighing options including a sale. Excluding it, Americas margins would have risen. The trend break that followed on 18 August was a moving average catching up to a three-week-old gap, not a fresh event.
A rates explanation is tempting — the 30-year Treasury yield topped 5.33% on 18 August, a 19-year high, and Linde is as bond-like as equities get. It does not hold. Air Products, the direct on-site rival with the same electronics tailwind and roughly $3bn of traditional gas backlog skewed two-thirds to semiconductors, rose 3.3% through the same yield spike. Linde now trades at 31.3x trailing earnings against 35.0x in early May, and at 13.94 times trailing gross profit against 14.25.
One label, three businesses
The grouping that contains these names also contains the copper miners, and it is not one trade. Teck Resources, now a near-pure copper producer, rose 20.5% in 30 days and Freeport-McMoRan 17.7%, after COMEX copper set an all-time high of $6.77/lb on 7 August on Congo's concentrate export ban and a US tariff-driven import squeeze. That is a metals event with an AI label attached. Linde's backlog and Prysmian's Molex contract are signed AI revenue that the shares moved away from.
The setup
Where it stands — The two names with record order books fell on causes unrelated to their AI-linked segments; the miners rose on spot copper. Would confirm — Prysmian's optical revenue tracking toward €1.7bn by 2030, and Linde's backlog ending 2026 above $8bn as guided. Would invalidate — Linde's electronics growth slowing below high single digits, or Prysmian's Transmission margin falling back toward 17%. Watch next — Third-quarter results: Linde has guided to $4.45–4.55 in earnings per share; Prysmian reports in late October. Valuation — Prysmian 25.5x forward against 26.5x trailing and roughly 32x in May; Linde 27.3x forward, 31.3x trailing versus 35.0x in early May.