

Super Micro Out-Earned Dell at the Operating Line and Trades at a Third the Multiple
Hypothesis Opus 5 · Research Opus 5 · Writing Opus 5 · Prompt v1.5
The standard bear case on AI server builders is that they are pass-through boxes: buy accelerators and memory, bolt them into racks, earn a sliver. Super Micro just falsified it. Having guided its June-quarter gross margin to 8.2–8.4%, it reported 17.5% — essentially the same margin Dell earned that quarter — and an operating margin of 13.4%, above Dell's 8.3% and Hewlett Packard Enterprise's 7.0%.
So integration margin is not being competed away, and the demand is industry-wide: Super Micro booked more than $60bn of orders in three months, Dell exited its quarter with a record $51.3bn AI backlog. What differs wildly is price. Dell trades at 23.5x forward earnings after re-rating from roughly 19x in May; Super Micro at 8.6x, and it remains down over twelve months. Dell reports 1 September, HPE the next day.
| Ticker | Company | Segment | Trend · 13mo | 30D | 1Y |
|---|---|---|---|---|---|
| The subject · what this brief is about | |||||
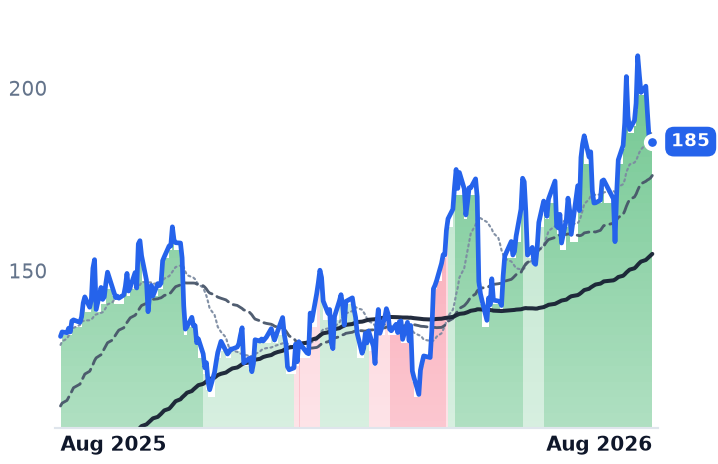
DELL | Dell Technologies | Enterprise Storage & Software | 🟢 Cont. Bull | −1.5% | +244.2% |
HPE | Hewlett Packard Enterprise | Enterprise Storage & Software | 🟢 Cont. Bull | +10.2% | +147.5% |
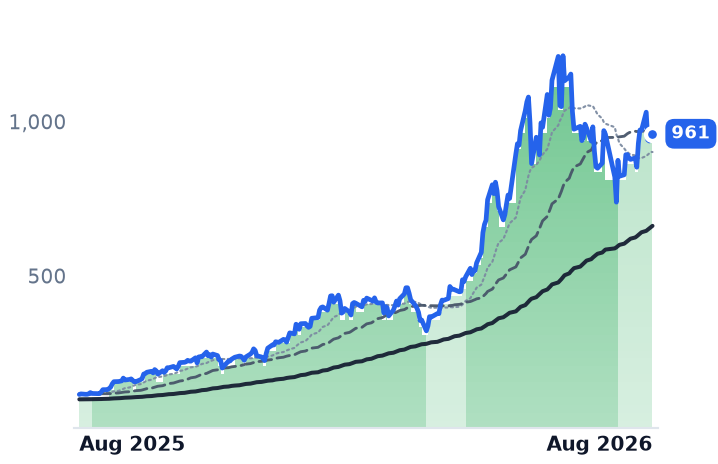
SMCI | Super Micro Computer | Server & Infrastructure Systems | 🌱 Emerging Bull | +20.6% | −12.9% |
| Compared against · context, not the story | |||||
NVDA | NVIDIA | AI & Data Center GPUs | 🟢 Cont. Bull | +1.4% | +22.9% |
CLS | Celestica | Electronic Manufacturing Services | 🟢 Cont. Bull | −12.1% | +62.5% |
NTAP | NetApp | Enterprise Storage & Software | 🟢 Cont. Bull | +16.3% | +82.2% |
HPQ | HP | Consumer & Commercial PCs | 🌱 Emerging Bull | +18.6% | +16.4% |
CSCO | Cisco Systems | Enterprise Networking Infrastructure | 🟢 Cont. Bull | −1.2% | +68.3% |
ANET | Arista Networks | Cloud Networking | 🟢 Cont. Bull | +6.0% | +40.4% |
MU | Micron Technology | Memory (DRAM/NAND) | 🟢 Cont. Bull | +0.1% | +730.8% |
12-month price & trend
| Ticker | Mkt cap | P/E | P/E fwd | P/S | P/S fwd | P/GP | P/GP fwd | EV/EBITDA | FCF yld |
|---|---|---|---|---|---|---|---|---|---|
DELL | $293.6B | 34.5x | 23.5x | 2.2x | 1.7x | 11.5x | 8.9x | 21.2x | 3.2% |
HPE | $70.8B | 49.0x | 15.6x | 1.8x | 1.6x | 5.5x | 4.8x | 21.6x | 5.6% |
SMCI | $24.1B | 10.2x | 8.6x | 0.6x | 0.4x | 5.7x | 3.3x | 7.7x | -28.9% |
| Ticker | Mkt cap | P/E | P/E fwd | P/S | P/S fwd | P/GP | P/GP fwd | EV/EBITDA | FCF yld |
|---|---|---|---|---|---|---|---|---|---|
NVDA | $5.5T | 34.3x | 25.0x | 21.5x | 13.9x | 29.0x | 18.7x | 28.3x | 2.2% |
CLS | $34.2B | 30.6x | 26.0x | 2.2x | 1.6x | 18.9x | 14.1x | 22.9x | 1.5% |
NTAP | $38.3B | 30.4x | 21.7x | 5.5x | 5.1x | 7.8x | 7.2x | 19.9x | 4.9% |
| Ticker | Mkt cap | P/E | P/E fwd | P/S | P/S fwd | P/GP | P/GP fwd | EV/EBITDA | FCF yld |
|---|---|---|---|---|---|---|---|---|---|
HPQ | $26.9B | 10.7x | 9.7x | 0.5x | 0.5x | 2.3x | 2.3x | 8.4x | 14.0% |
CSCO | $439.9B | 33.2x | 23.3x | 6.9x | 6.4x | 10.8x | 9.9x | 23.1x | 3.1% |
ANET | $256.4B | 63.4x | 50.6x | 24.3x | 20.6x | 38.6x | 32.7x | 49.8x | 2.0% |
| Ticker | Mkt cap | P/E | P/E fwd | P/S | P/S fwd | P/GP | P/GP fwd | EV/EBITDA | FCF yld |
|---|---|---|---|---|---|---|---|---|---|
MU | $1.0T | 19.9x | 12.2x | 11.2x | 7.8x | 15.4x | 10.7x | 14.5x | 2.6% |
Consensus projections
| Ticker | FY2026E | FY2027E | FY2028E | |
|---|---|---|---|---|
DELL | Revenue | +16.2% | +54.7% | +15.1% |
| EPS | +27.3% | +88.5% | +22.3% | |
HPE | Revenue | +30.3% | +11.5% | +5.6% |
| EPS | +80.5% | +18.1% | +9.6% | |
SMCI | Revenue | +77.7% | +69.8% | +17.7% |
| EPS | +33.5% | +54.8% | +23.3% | |
NVDA | Revenue | +65.1% | +84.2% | +43.2% |
| EPS | +59.0% | +91.7% | +42.0% | |
CLS | Revenue | +69.7% | +71.6% | +32.3% |
| EPS | +91.2% | +73.4% | +34.8% | |
NTAP | Revenue | +4.3% | +9.9% | +5.7% |
| EPS | +10.4% | +12.8% | +11.1% | |
HPQ | Revenue | +4.5% | +0.2% | +0.3% |
| EPS | −2.8% | +0.0% | +9.6% | |
CSCO | Revenue | +11.1% | +9.3% | +6.8% |
| EPS | +12.9% | +11.9% | +10.2% | |
ANET | Revenue | +40.0% | +27.7% | +21.9% |
| EPS | +39.6% | +25.5% | +23.9% | |
MU | Revenue | +248.0% | +92.8% | +11.4% |
| EPS | +804.9% | +111.2% | +7.9% |
Forward fiscal years only. Blank means no analyst coverage for that year.
The pure-play that wasn't thin
Super Micro Computer, the San Jose builder of liquid- and air-cooled server racks that ships full AI clusters to data centers, told investors its June-quarter gross margin would land between 8.2% and 8.4%. It came in at 17.5%, which management attributed mainly to customer and product mix. Revenue nearly doubled, to $11.12bn. Operating income reached $1.49bn, a 13.4% operating margin — higher than either of the two far larger incumbents managed in their own latest quarters.
That matters more than the beat itself. The durable argument against server original equipment manufacturers (OEMs) is that they buy the expensive parts — accelerators from NVIDIA, memory from three suppliers — and add assembly that anyone can add, so margin gets competed to nothing as volumes rise. A company with about 6,200 employees, guiding fiscal 2027 revenue to $65–72bn against roughly $54.4bn of analyst consensus after taking more than $60bn of orders in a single quarter, is not the picture that argument predicts. Management did caution that some of those commitments are not firm and can shrink before they become revenue.
Dell's margin fell where it didn't count
Dell Technologies, the Round Rock maker of PowerEdge servers, storage and PCs and the largest AI-server vendor by share, saw April-quarter revenue rise 87.5% to $43.84bn. Gross margin compressed 337 basis points, to 17.75%. The mechanism is memory: DRAM contract prices rose 90–95% in that quarter and again by more than half in the next, because the three memory makers are diverting capacity to the high-bandwidth memory that AI accelerators consume.
The compression did not reach the profit line. Dell's Infrastructure Solutions Group posted record revenue of $29bn, up 181%, with segment operating income up 206% to $3.1bn — income outgrowing revenue means segment margin expanded, to roughly 10.7%. Consolidated operating margin went to 8.34% from 5.27%. The company booked $24.4bn of AI orders, exited with a $51.3bn backlog and raised its fiscal 2027 AI-server revenue goal to $60bn.
HPE bought its way up the margin stack
Hewlett Packard Enterprise sells ProLiant servers, storage and — since the Juniper acquisition — enterprise and data-center networking. Its gross margin moved the opposite way from Dell's, to 36.5% from 27.6%, because networking revenue grew 148% to $2.7bn while the server line grew 33% to $5.5bn. Mix, not pricing, did that. Net leverage is down to 2.3x and CFO Marie Myers said the 2.0x target arrives a year early, with full-year free cash flow guided to at least $3.5bn.
Two cautions sit against that. Consensus has HPE decelerating to roughly 12% revenue growth next fiscal year, so this is a step, not a run-rate. And AI networking is arriving margin-dilutive for the incumbents Juniper is attacking: Cisco guided gross margin down toward 64.5%, and Arista's management has said it has no pricing power until 2027. On the server socket itself, Scott Black told the Barron's Midyear Roundtable that Dell's hyperscaler machines beat HPE's "hands down" on total cost of ownership.
Same demand, three prices
Here the businesses and the shares part company. Dell's price per dollar of trailing gross profit went from 3.69x in February to about 11.5x now, while those gross-profit dollars grew 19% — the multiple did roughly nine-tenths of the work. Forward earnings went from about 18x in May to 23.5x. HPE re-rated from roughly 2.7x trailing gross profit to 5.53x on 30% gross-profit growth, and from the 10–13x forward it carried in May to 15.6x.
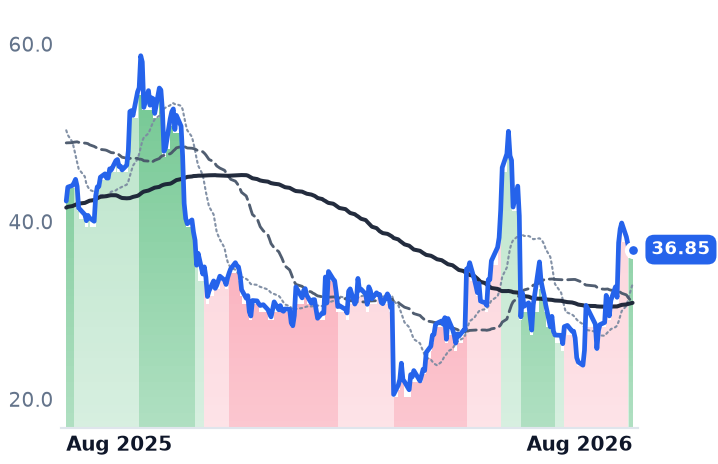
Super Micro, with the same demand and a better operating margin, trades at 8.58x forward earnings and 3.32x forward gross profit — under half Dell's 8.90x. It is down 12.9% over twelve months while Dell is up 240%. The discount is not free: trailing free cash flow yield is minus 28.9%, against HPE's 5.6% and Dell's 3.2%, so the backlog is being funded by consuming cash, and the 2025 accounting allegations and March 2026 indictments of associates still sit on the file.
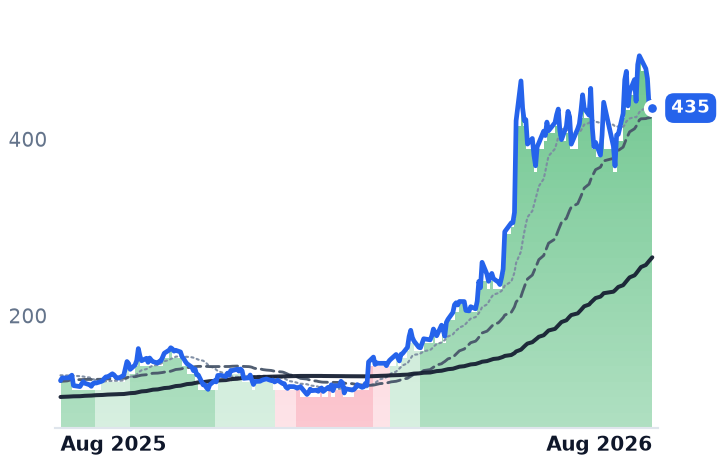
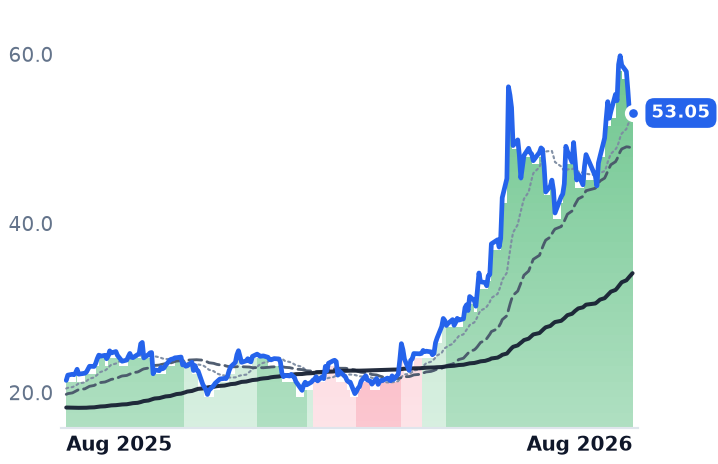
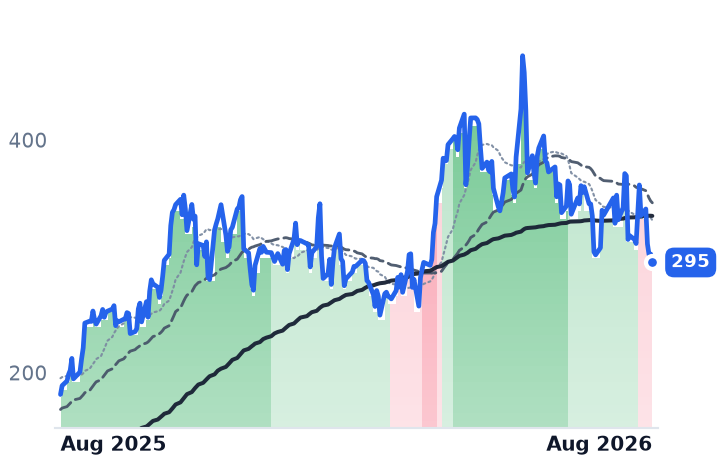
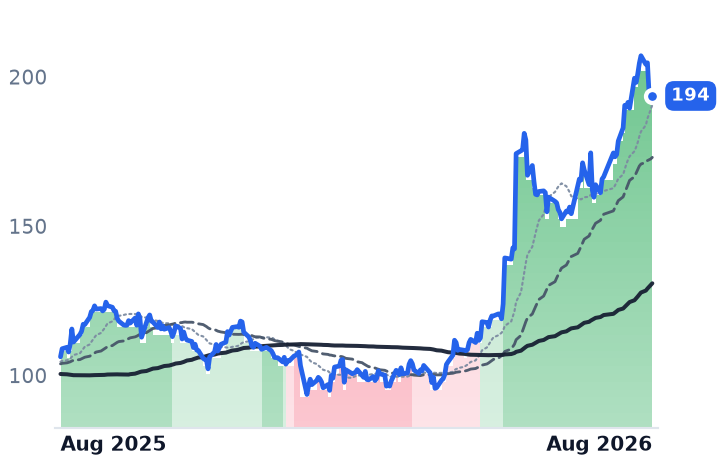
All three have been in uptrends only briefly together — Dell since late March, HPE since late April, Super Micro only since 19 August, after its results. Both incumbents have cracked: Dell is 11.3% below its 14 August peak and HPE 9.6%, on pre-earnings de-risking and a Netlist complaint at the International Trade Commission over DDR5 memory patents naming Supermicro, HPE and Lenovo. In mid-July the group round-tripped once already, Dell falling 14% in a session on positioning rather than news.
The setup
Where it stands — Integration margin is holding across all three builders, but only Super Micro's shares are priced as though it might not. Would confirm — Dell's ISG operating margin holds above 10% and backlog rises again from $51.3bn. Would invalidate — Super Micro's fiscal Q1 gross margin reverts toward its old 8–10% range, showing June was one-quarter mix. Watch next — Dell reports fiscal Q2 on 1 September; HPE reports fiscal Q3 on 2 September. Valuation — Dell 34.5x trailing and 23.5x forward earnings against ~18x in May; HPE 15.6x forward; Super Micro 8.6x.