

Bill Holdings Widened Its Take Rate on $98bn of Payments. Its Shares Fell Anyway.
Hypothesis Opus 5 · Research Opus 5 · Writing Opus 5 · Prompt v1.5
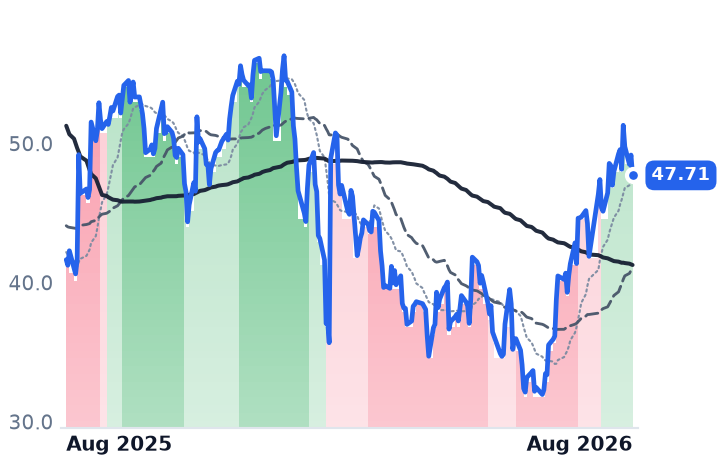
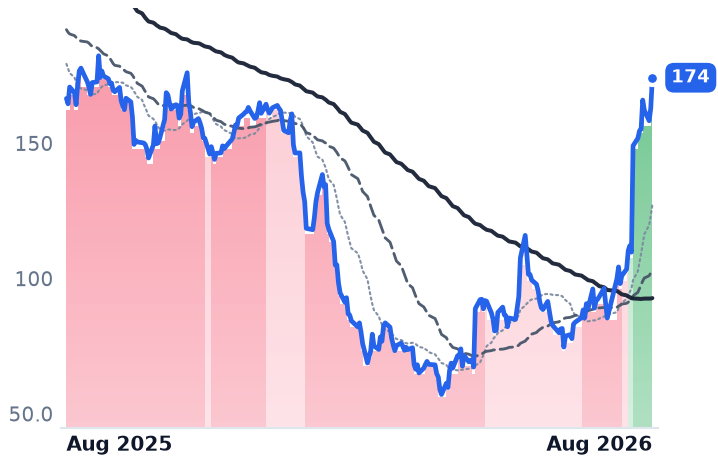
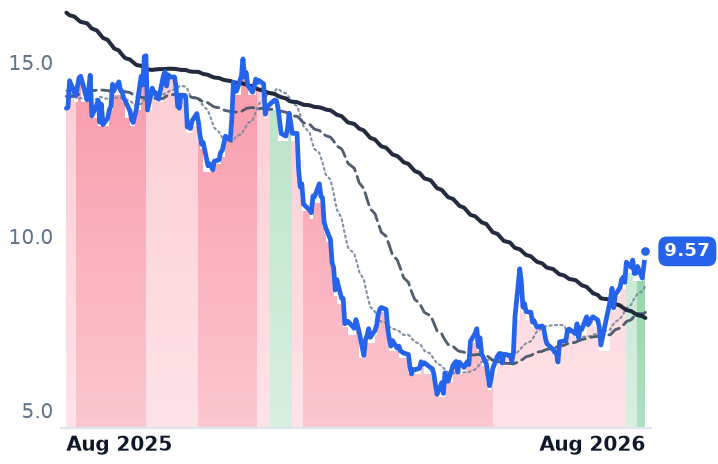
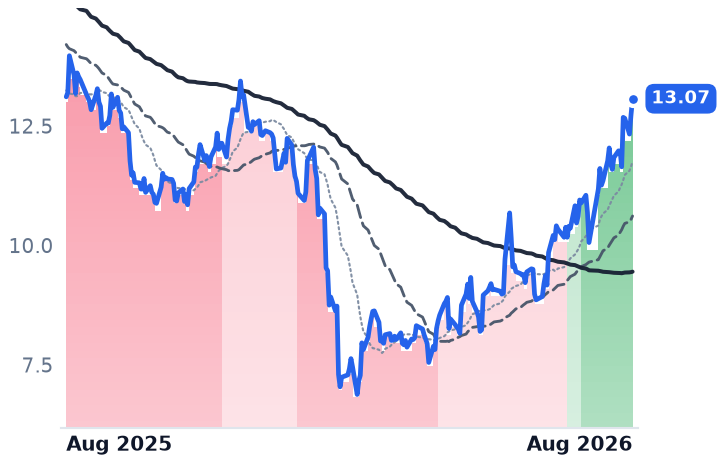
The back-office software names that were supposed to be agentic AI's first casualties have risen roughly 24% in a month. Only one of them published new numbers inside that window, and it is the one the rally left behind. Bill Holdings, a bill-payment network for small firms, moved $98bn in the June quarter and kept a wider slice of it — transaction fees grew 17% on volume up 14% — then fell 3% on a fiscal-2027 outlook of 11-14% core growth against the 16% just delivered.
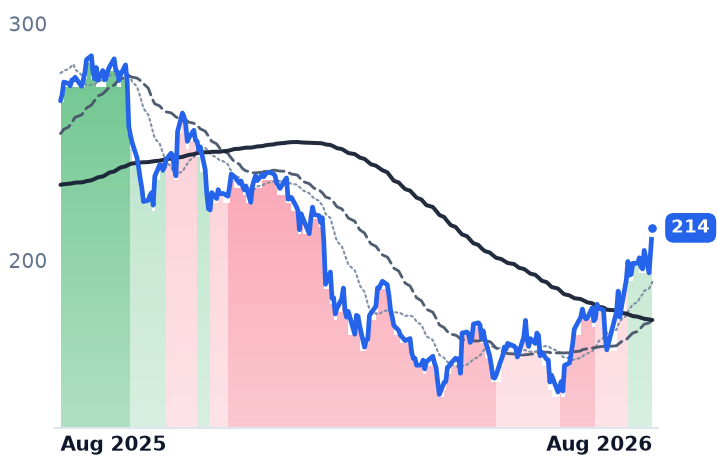
The rest of the group's month is rotation. Strip 28 July, the session after Jensen Huang told investors AI agents buy software rather than replace it, and the advance halves. Workday has disclosed nothing since May and reports on 27 August. Paycom's operating margin went from 23.2% to 31.7% on cost cuts and a buyback of a fifth of the company, not on seats.
| Ticker | Company | Segment | Trend · 13mo | 30D | 1Y |
|---|---|---|---|---|---|
| The subject · what this brief is about | |||||
BILL | Bill.com | Fintech & Digital Finance | ⚠️ Emerging Bear | +7.8% | +14.5% |
WDAY | Workday | Enterprise Resource Planning | 🌱 Emerging Bull | +40.6% | −12.8% |
PAYC | Paycom Software | HR & Workforce Management | 🌱 Emerging Bull | +54.0% | −1.5% |
| Compared against · context, not the story | |||||
ADP | Automatic Data Processing | HCM Software & Payroll | 🌱 Emerging Bull | +12.6% | −8.5% |
PAYX | Paychex | HCM Software & Payroll | 🌱 Emerging Bull | +10.6% | −8.9% |
PCTY | Paylocity | HR & Workforce Management | 🔴 Cont. Bear | +20.5% | −17.6% |
DOCU | DocuSign | Specialized Enterprise Solutions | 🌱 Emerging Bull | +22.4% | −12.6% |
MNDY | monday.com | Other | 🔴 Cont. Bear | +24.9% | −47.5% |
TEAM | Atlassian | Developer Tools & DevOps | 🔴 Cont. Bear | +92.3% | +4.6% |
ASAN | Asana | Other | 🌱 Emerging Bull | +29.5% | −30.0% |
APPF | AppFolio | Specialized Enterprise Solutions | 🔴 Cont. Bear | +27.3% | −20.1% |
WK | Workiva | Security & Compliance | ⚠️ Emerging Bear | +37.8% | −1.0% |
FRSH | Freshworks | Security & Compliance | 🌱 Emerging Bull | +22.3% | −0.3% |
NOW | ServiceNow | Specialized Enterprise Solutions | 🔴 Cont. Bear | +24.6% | −28.6% |
CRM | Salesforce | Customer Experience & CRM | 🔴 Cont. Bear | +21.2% | −15.9% |
INTU | Intuit | Enterprise Resource Planning | 🔴 Cont. Bear | +25.0% | −47.8% |
SAP | SAP | Enterprise Resource Planning | 🔴 Cont. Bear | +39.7% | −19.5% |
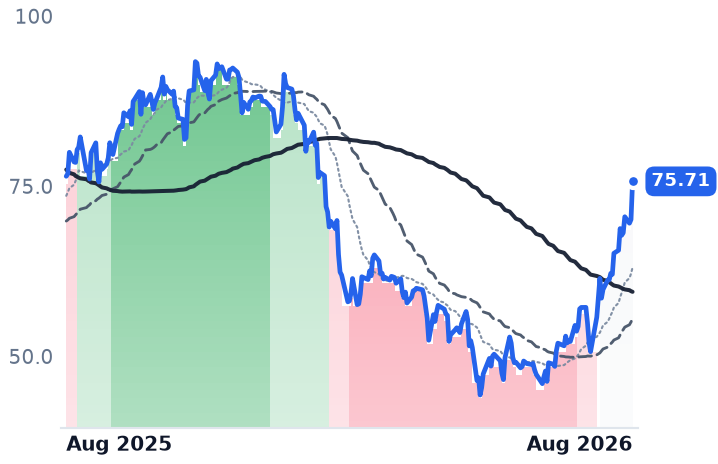
SPY | State Street SPDR S&P 500 ETF Trust | Asset Management | 🟢 Cont. Bull | +2.8% | +21.5% |
NVDA | NVIDIA | AI & Data Center GPUs | 🟢 Cont. Bull | +6.3% | +25.6% |
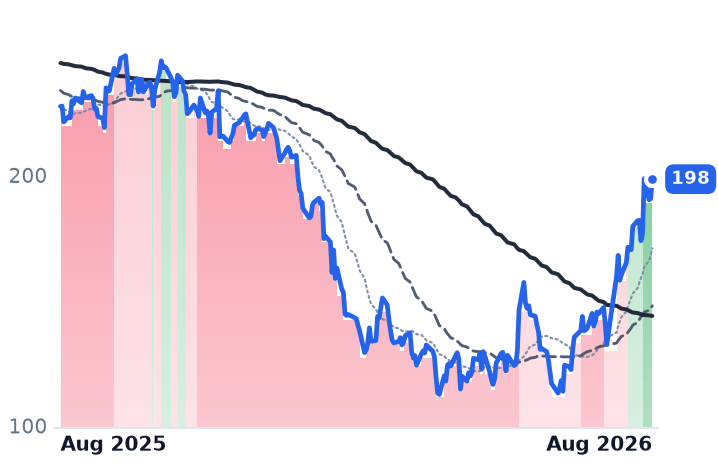
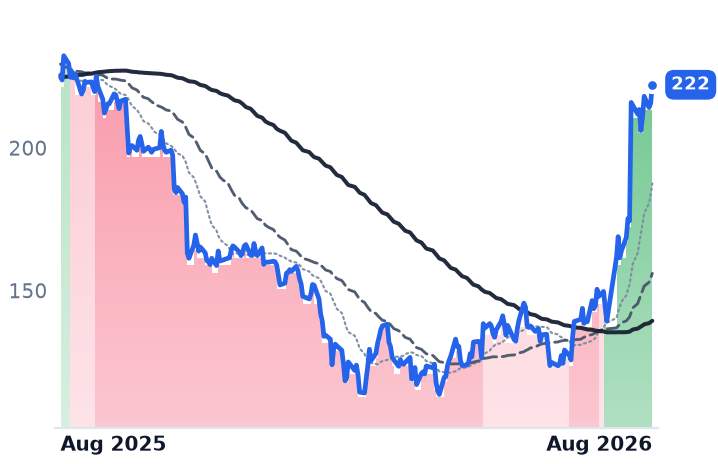
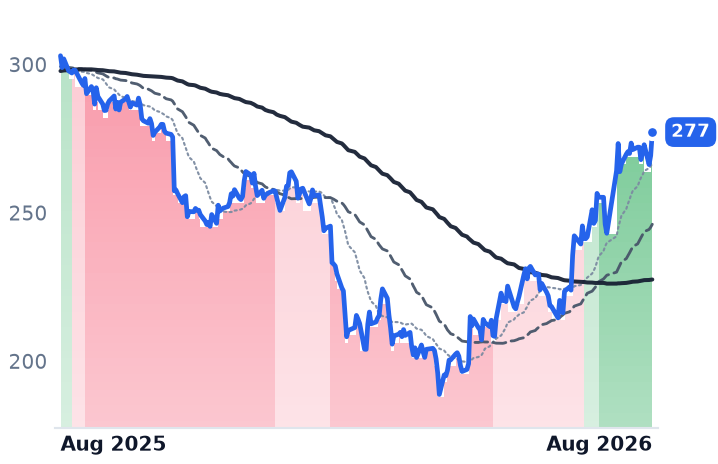
12-month price & trend
| Ticker | Mkt cap | P/E | P/E fwd | P/S | P/S fwd | P/GP | P/GP fwd | EV/EBITDA | FCF yld |
|---|---|---|---|---|---|---|---|---|---|
BILL | $4.8B | n/m | 14.2x | 2.9x | 2.6x | 3.6x | 3.2x | 49.9x | 8.9% |
WDAY | $52.0B | 61.6x | 18.4x | 5.3x | 4.9x | 7.0x | 6.4x | 33.0x | 5.7% |
PAYC | $10.0B | 23.6x | 18.4x | 4.7x | 4.5x | 5.8x | 5.7x | 12.0x | 7.5% |
| Ticker | Mkt cap | P/E | P/E fwd | P/S | P/S fwd | P/GP | P/GP fwd | EV/EBITDA | FCF yld |
|---|---|---|---|---|---|---|---|---|---|
ADP | $108.5B | 24.7x | 22.2x | 4.9x | 4.7x | 10.3x | 9.7x | 17.2x | 4.6% |
PAYX | $32.8B | 20.1x | 16.7x | 5.2x | 5.0x | 7.0x | 6.8x | 12.8x | 6.6% |
PCTY | $8.0B | 29.9x | 16.9x | 4.5x | 4.2x | 6.5x | 6.1x | 15.7x | 5.6% |
| Ticker | Mkt cap | P/E | P/E fwd | P/S | P/S fwd | P/GP | P/GP fwd | EV/EBITDA | FCF yld |
|---|---|---|---|---|---|---|---|---|---|
DOCU | $11.5B | 38.4x | 13.3x | 3.5x | 3.3x | 4.4x | 4.1x | 17.2x | 9.7% |
MNDY | $4.7B | 39.8x | 20.3x | 3.6x | 3.2x | 4.1x | 3.6x | 51.1x | 6.4% |
TEAM | $44.8B | n/m | 28.0x | 6.8x | 6.1x | 8.0x | 7.2x | 296.5x | 2.9% |
| Ticker | Mkt cap | P/E | P/E fwd | P/S | P/S fwd | P/GP | P/GP fwd | EV/EBITDA | FCF yld |
|---|---|---|---|---|---|---|---|---|---|
ASAN | $1.9B | n/m | 22.0x | 2.4x | 2.3x | 2.7x | 2.6x | n/m | 5.8% |
APPF | $7.7B | 48.8x | 31.2x | 7.4x | 6.8x | 11.7x | 10.9x | 36.2x | 3.5% |
WK | $2.7B | 189.9x | 16.3x | 2.9x | 2.6x | 3.6x | 3.2x | 95.9x | 6.5% |
| Ticker | Mkt cap | P/E | P/E fwd | P/S | P/S fwd | P/GP | P/GP fwd | EV/EBITDA | FCF yld |
|---|---|---|---|---|---|---|---|---|---|
FRSH | $3.5B | 19.3x | 19.0x | 3.9x | 3.6x | 4.6x | 4.3x | 39.0x | 7.1% |
NOW | $121.7B | 73.1x | 28.9x | 8.3x | 7.5x | 11.0x | 10.0x | 36.6x | 3.8% |
CRM | $160.7B | 22.6x | 13.9x | 3.8x | 3.5x | 4.8x | 4.5x | 13.8x | 9.1% |
| Ticker | Mkt cap | P/E | P/E fwd | P/S | P/S fwd | P/GP | P/GP fwd | EV/EBITDA | FCF yld |
|---|---|---|---|---|---|---|---|---|---|
INTU | $89.0B | 19.7x | 11.9x | 4.3x | 3.7x | 5.2x | 4.6x | 13.0x | 8.7% |
SAP | $217.1B | 23.7x | 26.1x | 5.0x | 5.4x | 6.8x | 7.4x | 12.8x | 4.6% |
SPY | $773.0B | — | — | — | — | — | — | — | — |
| Ticker | Mkt cap | P/E | P/E fwd | P/S | P/S fwd | P/GP | P/GP fwd | EV/EBITDA | FCF yld |
|---|---|---|---|---|---|---|---|---|---|
NVDA | $5.5T | 34.3x | 25.0x | 21.5x | 13.9x | 29.0x | 18.7x | 28.3x | 2.2% |
Consensus projections
| Ticker | FY2026E | FY2027E | FY2028E | |
|---|---|---|---|---|
BILL | Revenue | +13.2% | +12.2% | +12.0% |
| EPS | +26.0% | +27.2% | +20.5% | |
WDAY | Revenue | +13.4% | +11.8% | +11.0% |
| EPS | +26.5% | +18.6% | +17.3% | |
PAYC | Revenue | +7.7% | +7.1% | +8.4% |
| EPS | +30.8% | +14.6% | +9.8% | |
ADP | Revenue | +7.0% | +5.9% | +5.7% |
| EPS | +11.0% | +10.6% | +9.3% | |
PAYX | Revenue | +16.5% | +5.4% | +5.4% |
| EPS | +10.1% | +7.6% | +6.5% | |
PCTY | Revenue | +11.1% | +7.5% | +7.6% |
| EPS | +15.4% | +9.0% | +9.7% | |
DOCU | Revenue | +8.4% | +8.9% | +7.6% |
| EPS | +6.9% | +19.5% | +12.6% | |
MNDY | Revenue | +19.8% | +16.1% | +16.1% |
| EPS | +7.0% | +21.4% | +10.9% | |
TEAM | Revenue | +24.7% | +13.4% | +15.9% |
| EPS | +55.5% | +10.5% | +18.0% | |
ASAN | Revenue | +9.2% | +8.9% | +7.9% |
| EPS | −272.8% | +45.4% | +26.1% | |
APPF | Revenue | +18.5% | +17.3% | +17.8% |
| EPS | +33.8% | +22.1% | +24.5% | |
WK | Revenue | +17.9% | +15.6% | +17.5% |
| EPS | +77.9% | +20.3% | +33.4% | |
FRSH | Revenue | +15.6% | +14.2% | +15.6% |
| EPS | +4.9% | +23.5% | +20.5% | |
NOW | Revenue | +22.4% | +18.7% | +18.6% |
| EPS | +17.1% | +23.2% | +21.4% | |
CRM | Revenue | +9.3% | +11.1% | +9.4% |
| EPS | +17.4% | +20.2% | +10.4% | |
INTU | Revenue | +13.9% | +11.3% | +10.8% |
| EPS | +18.5% | +15.0% | +12.6% | |
SAP | Revenue | +9.3% | +11.6% | +12.1% |
| EPS | +18.7% | +17.0% | +18.3% | |
NVDA | Revenue | +65.1% | +84.2% | +43.2% |
| EPS | +59.0% | +91.7% | +42.0% |
Forward fiscal years only. Blank means no analyst coverage for that year.
Bill Holdings runs the plumbing small American companies use to pay their suppliers — accounts-payable and receivable automation, sold largely through accounting firms — and it reported the June quarter on Wednesday evening. Payment volume reached $98bn, up 14% year over year across 37 million transactions. The more interesting figure is the sliver it keeps. Transaction fees grew 17%, faster than volume, so the implied take rate widened to roughly 33.1 basis points from about 32.3bp a year earlier.
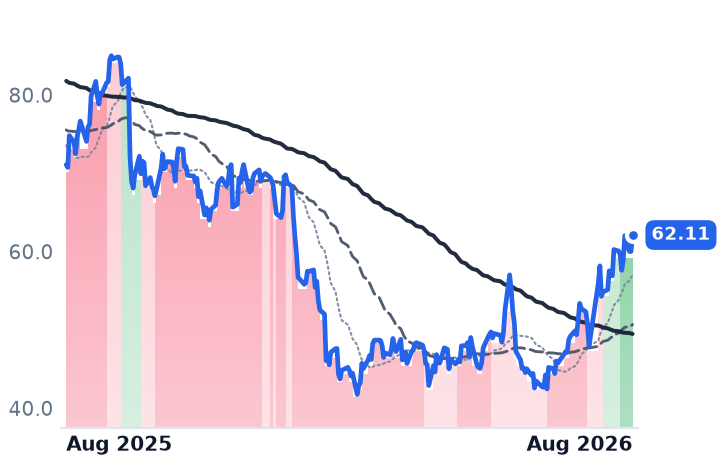
Take-rate compression is the standard bear case on payment networks. This was the reverse. Underneath, subscription fees were $76.2m, transaction fees $324.3m and float revenue — interest on customer money in transit — $35.7m, which makes float about 8% of the line and transactions, not seats, the engine. Core revenue rose 16% to $400.5m and non-GAAP operating income rose 80% to $101.6m, with adjusted earnings of $0.84 a share against a $0.71 consensus. The shares fell 3.0% — the only one of thirteen back-office and workflow software names down that session. The stated reason was the outlook: fiscal 2027 core revenue of $1.669-1.719bn, or 11-14% growth, a step down from the 16% just delivered.
The month was one session
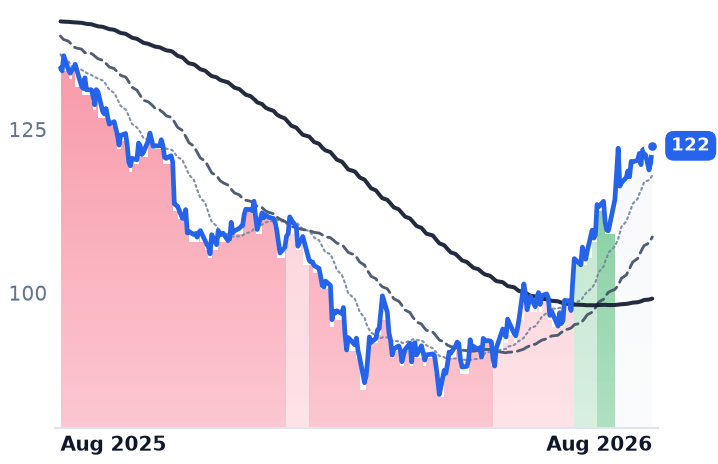
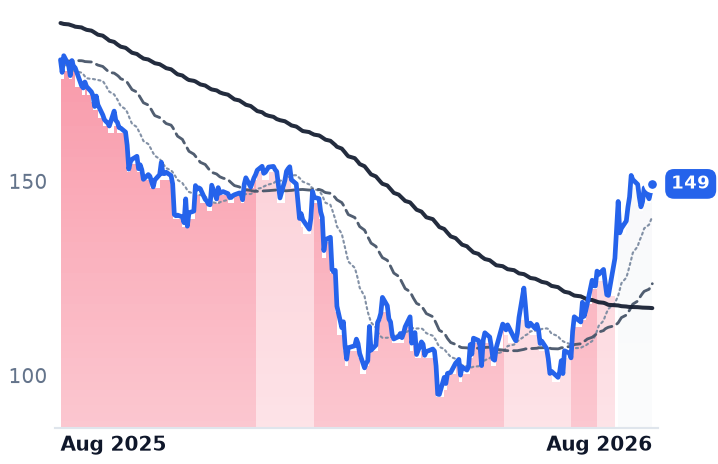
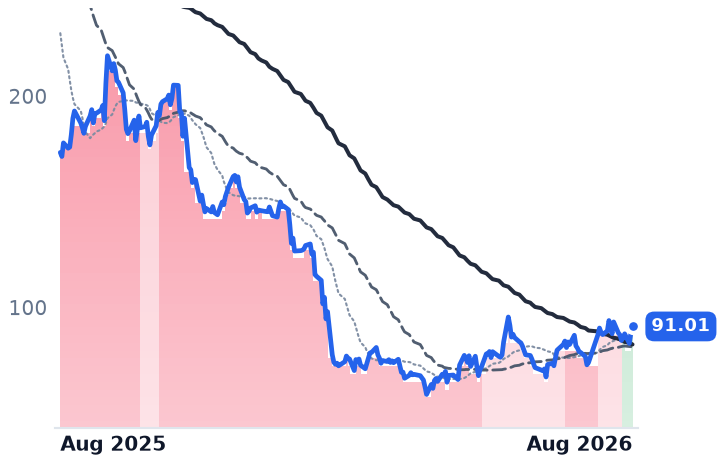
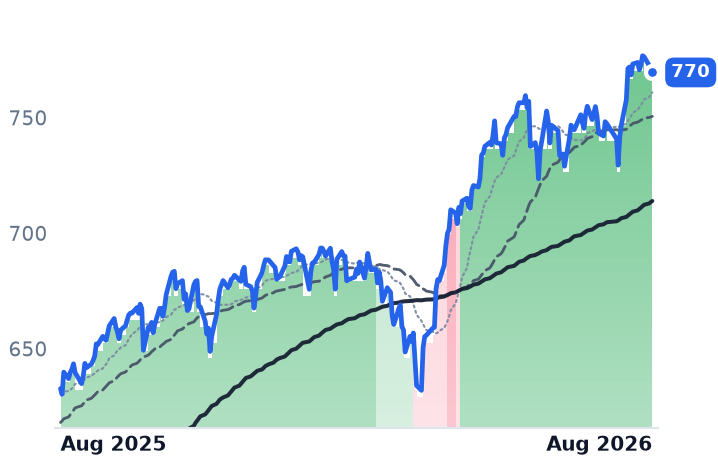
That matters because of what the rest of the group did on no numbers at all. Averaged across thirteen names — Workday, Paycom, Bill, ADP, Paychex, Paylocity, DocuSign, Monday.com, Atlassian, Asana, AppFolio, Workiva and Freshworks — the month to 19 August produced a 23.5% gain against 3.6% for the S&P 500 tracker. Nearly all of it arrived twice. On 28 July every one of the ten members with price data rose between 8.7% and 20.6% while the index was flat, after Nvidia's Jensen Huang told investors that AI agents increase demand for software tools rather than replace them. Remove that day and the group's month is 10.7%. Remove Atlassian's 7 August earnings session too and it is 4.9%, with five of the thirteen negative.
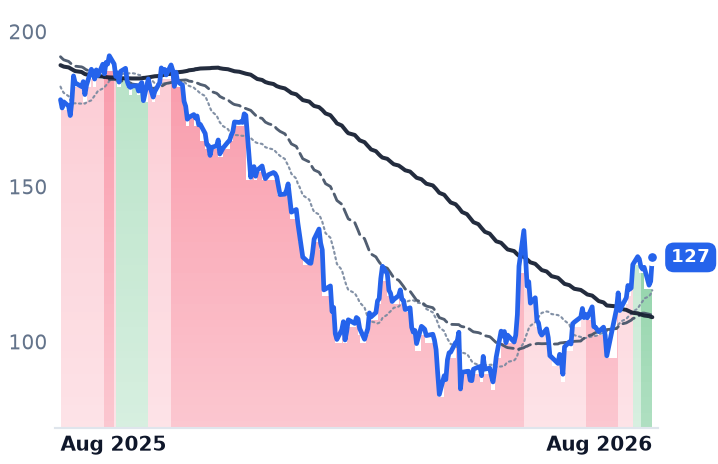
Workday, which sells human-capital, financial and spend management software to large enterprises, gained 34.8% in that month having disclosed nothing since 21 May; it does not report until after the close on 27 August. The last numbers it published were good ones — 12-month subscription backlog up 15.5% to $8.806bn, ahead of subscription revenue growth of 14.3%, with total backlog up 10.9% to $27.294bn — and operating margin has widened from 1.7% to 13.3% across four quarters. Backlog growing faster than revenue is the single cleanest rebuttal to the claim that AI agents are eating enterprise seats. It is also three months old.
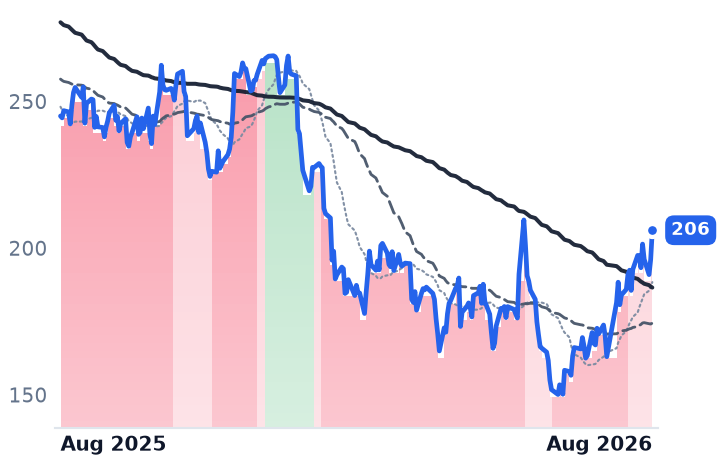
Paycom, which sells the same category of software to mid-sized American employers at a price per employee per month, is the group's clearest case of profit without volume. Revenue grew 9.8% to $531.2m last quarter; operating income rose 50%, lifting margin from 23.2% to 31.7%, on more than $100m of annual research savings from its own automation and a $30m cut in third-party AI token fees. It bought back a fifth of the company for $1.4bn this year, taking diluted shares from 56.3m to 45.9m. Management said client employment was stable with no acceleration — and US nonfarm payrolls actually fell by 23,000 in July, which is the denominator for every per-employee biller here. Consensus has Paycom earnings growing 30.8% this year on revenue growth of 7.7%.
One premise worth retiring: interest on client payroll balances is not a headwind. Paycom's guide includes about $105m of interest on funds held for clients, on average daily balances of roughly $2.9bn, up 9%, and the Federal Reserve held at 3.50-3.75% on 29 July with three dissenters preferring a hike.
What the prices now assume
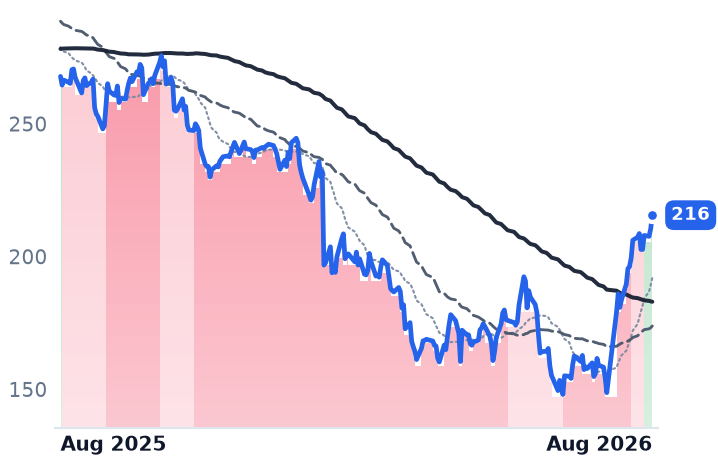
Because Bill runs a GAAP loss, earnings multiples are useless for comparison; gross margins across the three run 76-83%, so price against trailing gross profit is the usable common measure. Workday has gone from 4.61x in mid-May to 6.76x, against 9.17x a year ago — half the de-rating recovered before the confirming print. Paycom has gone from 4.23x to 5.95x against 7.94x, at 18.4x forward earnings and a 7.5% free-cash-flow yield, on 7-8% guided revenue growth. Bill sits at 3.49x, versus 3.04x in May and 3.58x a year ago: no dearer than before the sector's trough, despite gross profit compounding 12.4%, at 14.2x forward earnings and an 8.9% free-cash-flow yield.
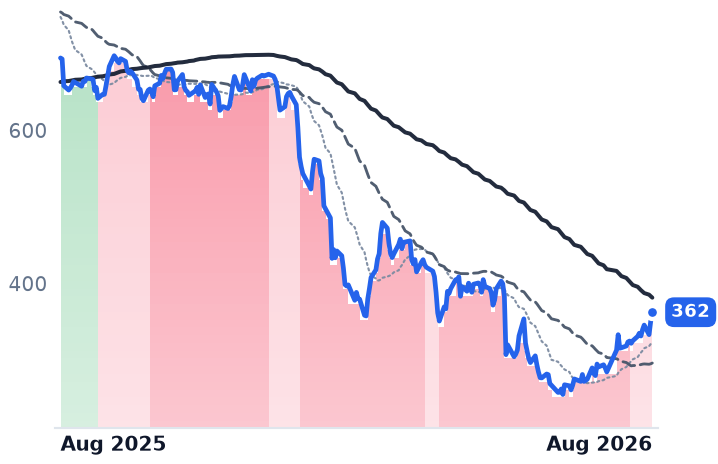
The trend has, in fact, turned. Seven of the thirteen — including Workday and Paycom — ended 19 August with their 50-day average above the 200-day, after bearish readings in May. The twelve-month picture is still ugly: the group is down 11.5% on average, Monday.com by 48.3%. What separates Bill is that its moat is not a seat. Payments cannot be routed around money-transmitter licensing, know-your-customer and anti-money-laundering compliance, or bank partnerships, and rivals are arriving by function rather than scale — Ramp and Brex pushing from corporate cards into payables, Tipalti in global mass payments, Melio in small-business bill pay. Automation there adds throughput rather than removing billable units.
The setup
Where it stands — Bill delivered the group's only new numbers and was the only member sold on them; Workday and Paycom rallied on a rotation and a buyback. Would confirm — Take rate holding above 33bp with payment volume growth at or above 14% in the September quarter. Would invalidate — Core revenue growth falling toward the low end of the 11-14% guide, or net customer adds below the ~1,800 just posted. Watch next — Workday reports fiscal second-quarter results after the close on 27 August; 12-month backlog growth above 15% is the test. Valuation — Bill at 3.49x trailing gross profit and 14.2x forward earnings, against 3.04x in May and 3.58x a year ago.