

Fabrinet Grew 45% Last Quarter at a 12% Gross Margin, and Investors Sold the Margin
Hypothesis Opus 5 · Research Opus 5 · Writing Opus 5 · Prompt v1.5
Fabrinet reported the best quarter in its history on 17 August and lost a fifth of its market value the next session — the steepest one-day fall on a 110-name watchlist. The businesses that move data between AI chips are not slowing: Fabrinet's revenue growth accelerated for four straight quarters to 44.6%, Ciena's backlog rose past $7.7bn, and Corning's Optical Communications sales grew 32% to $2.07bn with three hyperscaler supply agreements signed this year.
What broke was the price, not the demand. The group had rallied in early August on a reported US move to ban new Chinese transceiver imports, then gave it all back alongside a soft Anthropic revenue figure and a 19-year high in long-bond yields. Fabrinet now trades at 29x trailing gross profit against roughly 48x in May — but its gross margin, at 11.99% for the year, did not budge as revenue grew 36%.
| Ticker | Company | Segment | Trend · 13mo | 30D | 1Y |
|---|---|---|---|---|---|
| The subject · what this brief is about | |||||
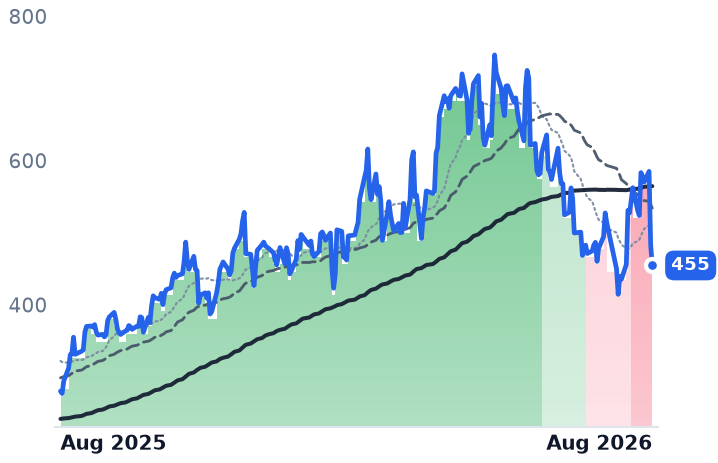
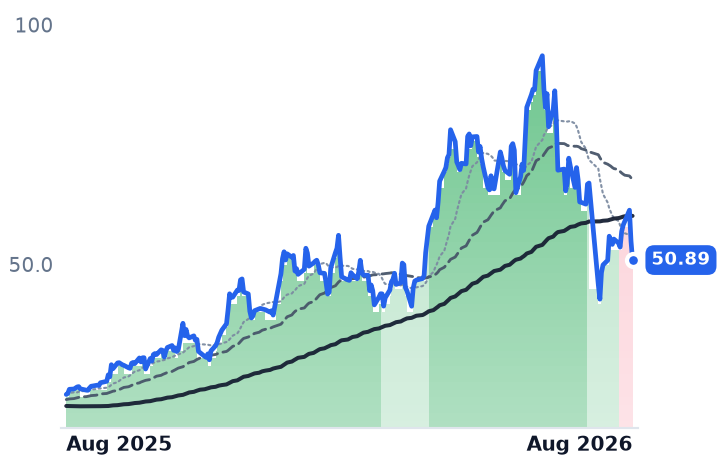
FN | Fabrinet | Specialty Manufacturing & Components | ⚠️ Emerging Bear | −13.8% | +62.1% |
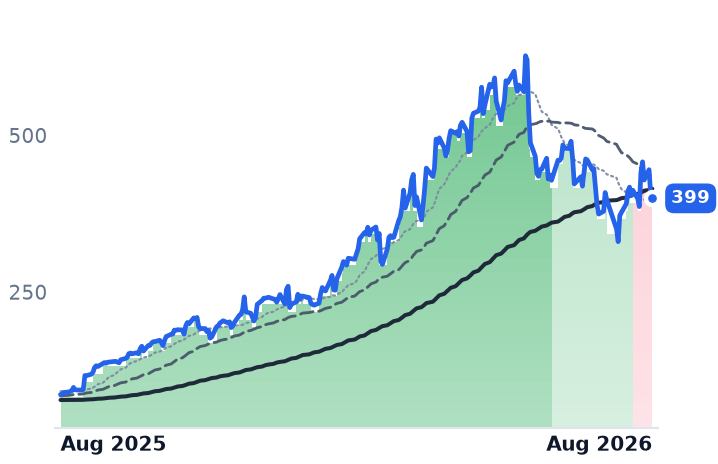
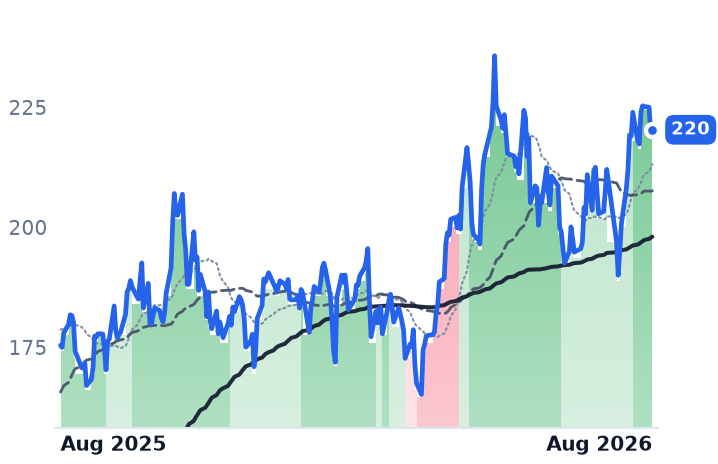
CIEN | Ciena | Optical Transport & Switching | 🟢 Cont. Bull | −2.3% | +361.1% |
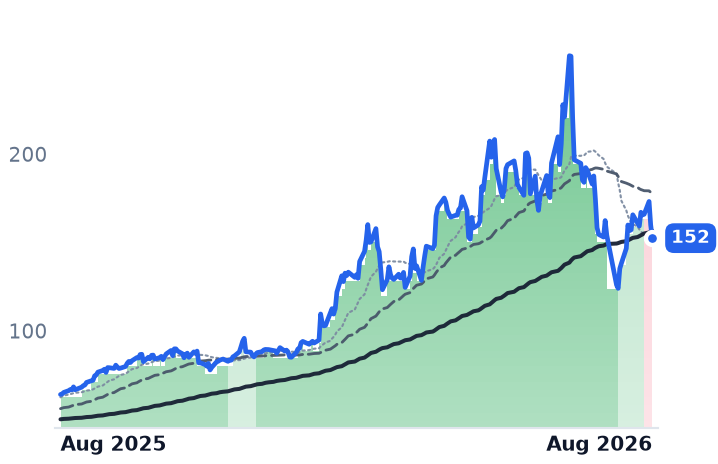
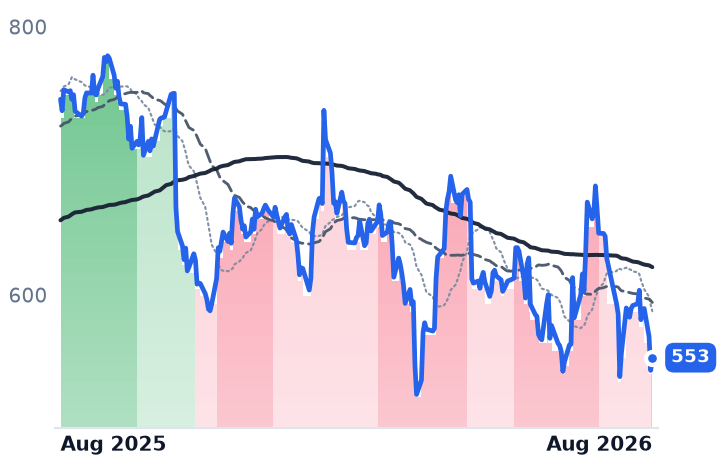
GLW | Corning | Display & Optical Materials | 🟢 Cont. Bull | −6.1% | +138.2% |
| Compared against · context, not the story | |||||
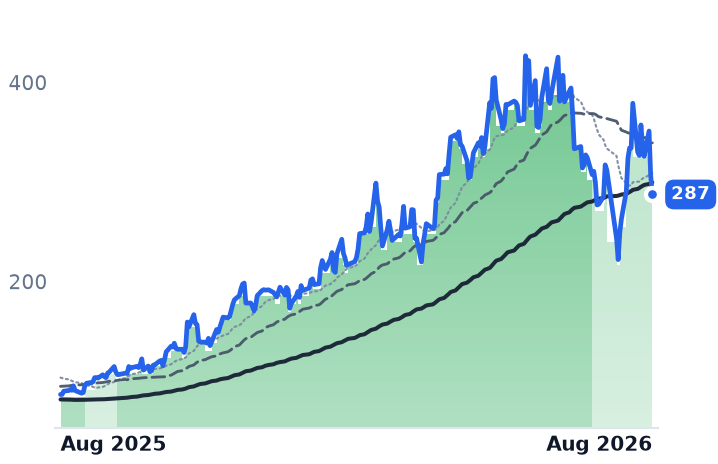
COHR | Coherent | Instrumentation & Test Equipment | 🟢 Cont. Bull | −9.4% | +232.1% |
LITE | Lumentum | Optical Transport & Switching | 🟢 Cont. Bull | −1.2% | +614.1% |
AAOI | Applied Optoelectronics | RF & Wireless | 🟢 Cont. Bull | +2.5% | +457.2% |
CRDO | Credo Technology | Optical Transport & Switching | 🟢 Cont. Bull | +4.9% | +121.5% |
APH | Amphenol | Connectors & Interconnect Systems | 🟢 Cont. Bull | −1.1% | +44.4% |
POET | POET Technologies | Discrete & Power | 🟢 Cont. Bull | +0.8% | +70.9% |
MRVL | Marvell Technology | Specialty Semiconductors | 🟢 Cont. Bull | +14.1% | +233.8% |
AXTI | AXT | Discrete & Power | 🟢 Cont. Bull | +29.9% | +2825.5% |
MTSI | MACOM Technology Solutions | RF & Wireless | 🟢 Cont. Bull | −4.6% | +122.8% |
AMKR | Amkor Technology | Packaging & Assembly | 🟢 Cont. Bull | −23.7% | +122.9% |
NVDA | NVIDIA | AI & Data Center GPUs | 🟢 Cont. Bull | +6.3% | +25.6% |
META | Meta Platforms | Social Media & Messaging | 🔴 Cont. Bear | −14.1% | −25.8% |
AMZN | Amazon.com | Online Marketplaces | 🟢 Cont. Bull | +6.9% | +18.2% |
CSCO | Cisco Systems | Enterprise Networking Infrastructure | 🟢 Cont. Bull | −1.5% | +67.5% |
NOK | Nokia Oyj | Optical Transport & Switching | 🟢 Cont. Bull | −4.7% | +138.9% |
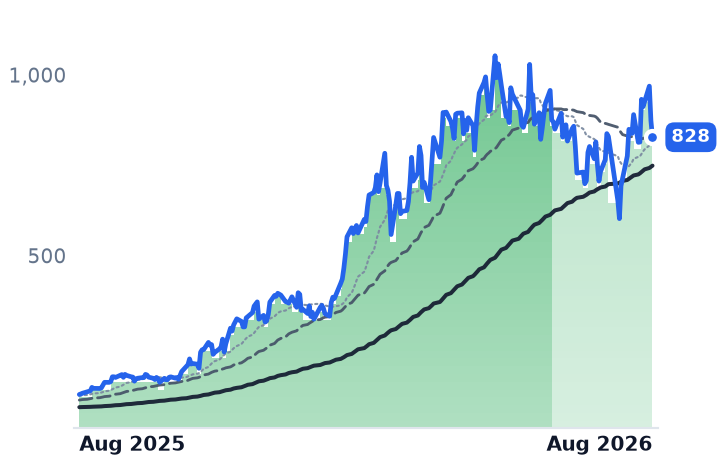
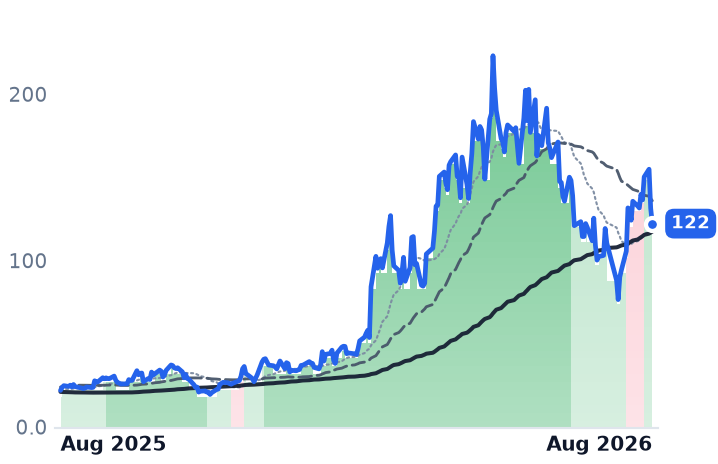
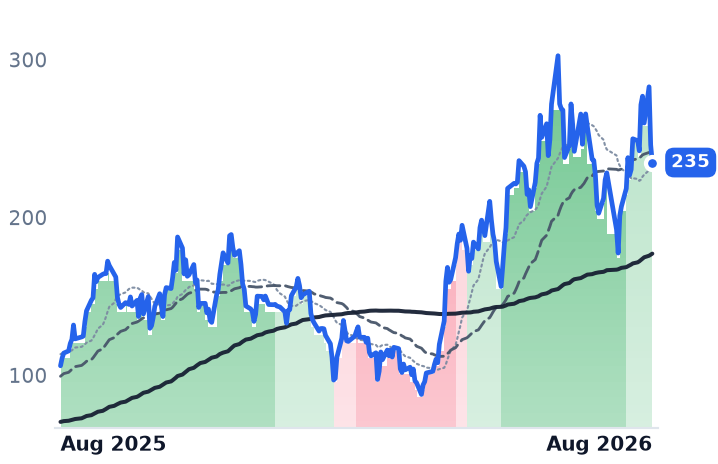
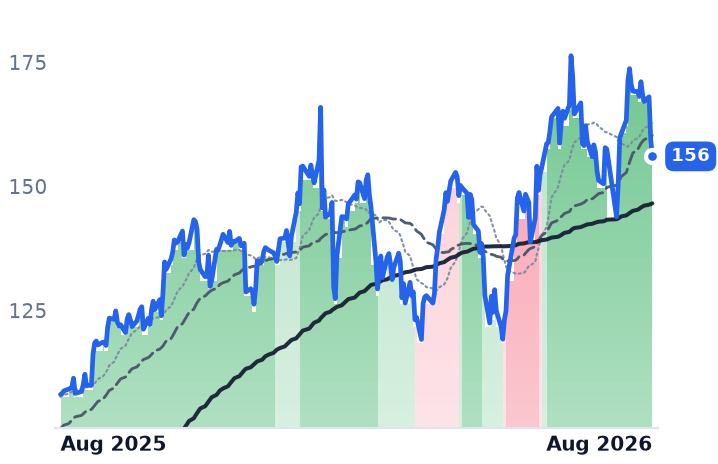
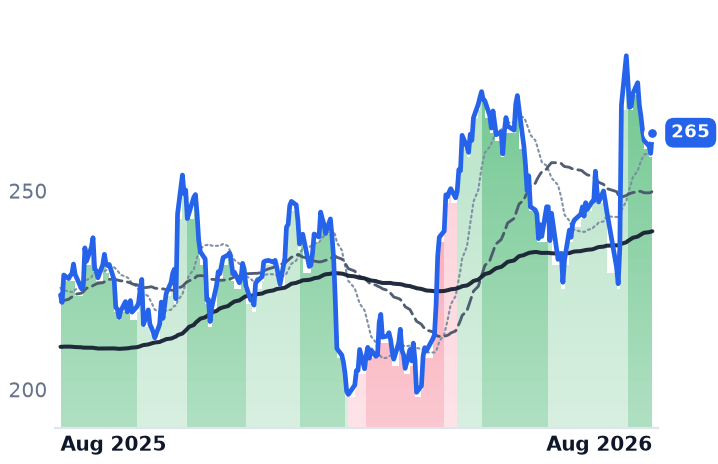
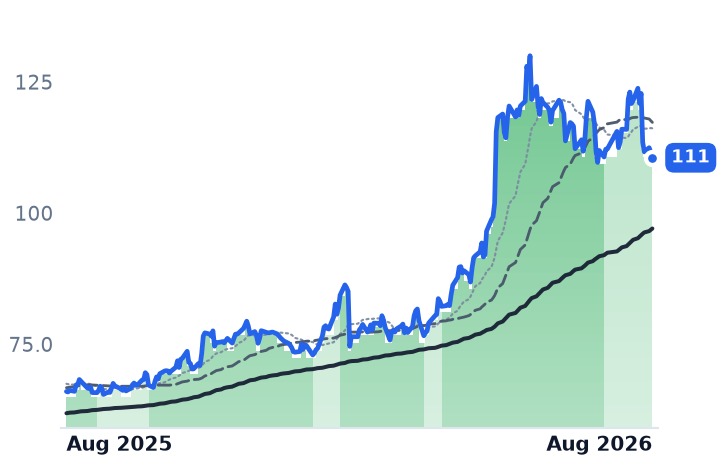
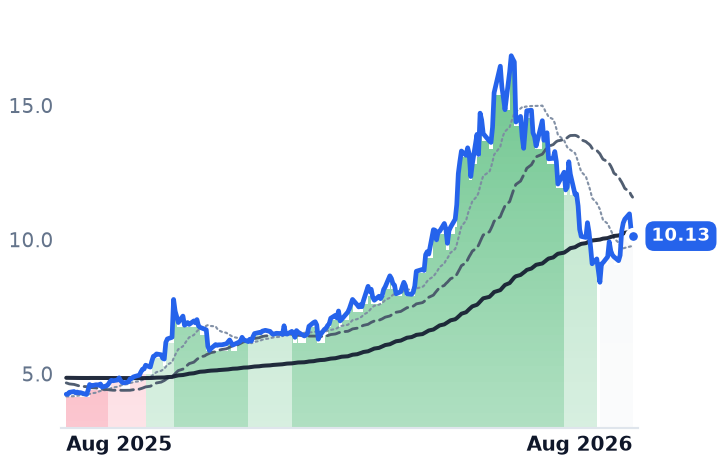
12-month price & trend
| Ticker | Mkt cap | P/E | P/E fwd | P/S | P/S fwd | P/GP | P/GP fwd | EV/EBITDA | FCF yld |
|---|---|---|---|---|---|---|---|---|---|
FN | $16.3B | 34.4x | 26.4x | 3.5x | 2.9x | 29.3x | 23.9x | 28.7x | 0.0% |
CIEN | $56.5B | 129.3x | 61.1x | 10.2x | 8.9x | 23.6x | 20.8x | 78.1x | 1.5% |
GLW | $131.4B | 69.0x | 46.7x | 7.7x | 6.8x | 21.3x | 18.8x | 35.4x | 1.8% |
| Ticker | Mkt cap | P/E | P/E fwd | P/S | P/S fwd | P/GP | P/GP fwd | EV/EBITDA | FCF yld |
|---|---|---|---|---|---|---|---|---|---|
COHR | $68.7B | 80.7x | 42.0x | 9.7x | 7.1x | 25.7x | 18.9x | 53.7x | -85.8% |
LITE | $75.4B | n/m | 52.1x | 25.0x | 13.3x | 60.0x | 31.9x | n/m | 0.7% |
AAOI | $12.4B | n/m | 149.9x | 20.9x | 11.9x | 72.1x | 41.3x | n/m | -3.3% |
| Ticker | Mkt cap | P/E | P/E fwd | P/S | P/S fwd | P/GP | P/GP fwd | EV/EBITDA | FCF yld |
|---|---|---|---|---|---|---|---|---|---|
CRDO | $52.7B | 107.9x | 46.2x | 39.5x | 21.6x | 58.1x | 31.8x | 101.1x | 0.8% |
APH | $206.0B | 39.8x | 31.7x | 7.1x | 5.8x | 18.4x | 15.2x | 23.5x | 2.3% |
POET | $1.2B | n/m | — | 724.4x | 137.5x | — | — | n/m | -3.3% |
| Ticker | Mkt cap | P/E | P/E fwd | P/S | P/S fwd | P/GP | P/GP fwd | EV/EBITDA | FCF yld |
|---|---|---|---|---|---|---|---|---|---|
MRVL | $230.5B | 92.0x | 65.3x | 26.4x | 20.1x | 52.2x | 39.7x | 50.5x | 0.7% |
AXTI | $4.5B | — | 103.5x | 35.8x | 20.6x | 111.3x | 64.1x | 342.4x | -0.6% |
MTSI | $20.6B | 84.4x | 53.7x | 17.7x | 16.3x | 31.3x | 28.9x | 60.0x | 0.6% |
| Ticker | Mkt cap | P/E | P/E fwd | P/S | P/S fwd | P/GP | P/GP fwd | EV/EBITDA | FCF yld |
|---|---|---|---|---|---|---|---|---|---|
AMKR | $12.6B | 22.7x | 20.5x | 1.7x | 1.7x | 10.9x | 10.6x | 9.8x | 4.1% |
NVDA | $5.5T | 34.3x | 25.0x | 21.5x | 13.9x | 29.0x | 18.7x | 28.3x | 2.2% |
META | $1.5T | 21.9x | 18.4x | 6.6x | 5.9x | 8.1x | 7.2x | 14.9x | 2.7% |
| Ticker | Mkt cap | P/E | P/E fwd | P/S | P/S fwd | P/GP | P/GP fwd | EV/EBITDA | FCF yld |
|---|---|---|---|---|---|---|---|---|---|
AMZN | $2.8T | 20.8x | 22.4x | 3.6x | 3.4x | 7.2x | 6.7x | 11.7x | -0.4% |
CSCO | $439.9B | 33.2x | 23.3x | 6.9x | 6.4x | 10.8x | 9.9x | 23.1x | 3.1% |
NOK | $75.3B | 64.5x | 40.9x | 3.3x | 3.5x | 7.5x | 8.0x | 31.3x | 2.1% |
Consensus projections
| Ticker | FY2026E | FY2027E | FY2028E | |
|---|---|---|---|---|
FN | Revenue | +35.6% | +23.6% | +21.3% |
| EPS | +36.0% | +24.7% | +24.0% | |
CIEN | Revenue | +34.5% | +27.0% | +27.2% |
| EPS | +160.2% | +47.6% | +48.1% | |
GLW | Revenue | +17.5% | +18.7% | +21.0% |
| EPS | +29.6% | +31.7% | +36.5% | |
COHR | Revenue | +21.9% | +37.7% | +38.2% |
| EPS | +55.9% | +53.4% | +58.4% | |
LITE | Revenue | +83.9% | +89.0% | +54.6% |
| EPS | +314.0% | +125.9% | +58.9% | |
AAOI | Revenue | +129.8% | +169.3% | +48.7% |
| EPS | −417.3% | +454.2% | +102.6% | |
CRDO | Revenue | +211.9% | +83.3% | +49.4% |
| EPS | +423.2% | +85.0% | +47.8% | |
APH | Revenue | +54.2% | +17.7% | +12.2% |
| EPS | +59.4% | +22.0% | +13.0% | |
POET | Revenue | +684.9% | +609.0% | +1.6% |
| EPS | −8.9% | −41.2% | −113.3% | |
MRVL | Revenue | +42.4% | +40.1% | +44.0% |
| EPS | +82.6% | +41.9% | +51.9% | |
AXTI | Revenue | +140.9% | +111.3% | +47.0% |
| EPS | −306.1% | +158.9% | +48.5% | |
MTSI | Revenue | +30.6% | +26.8% | +16.3% |
| EPS | +44.9% | +37.9% | +21.7% | |
AMKR | Revenue | +14.7% | +12.0% | +10.8% |
| EPS | +96.6% | +7.9% | +24.7% | |
NVDA | Revenue | +65.1% | +84.2% | +43.2% |
| EPS | +59.0% | +91.7% | +42.0% | |
META | Revenue | +27.3% | +19.9% | +17.9% |
| EPS | +39.6% | +7.2% | +15.8% | |
AMZN | Revenue | +15.7% | +14.0% | +15.9% |
| EPS | +63.6% | −10.9% | +30.2% | |
CSCO | Revenue | +11.1% | +9.3% | +6.8% |
| EPS | +12.9% | +11.9% | +10.2% | |
NOK | Revenue | +7.6% | +5.8% | +6.1% |
| EPS | +32.8% | +17.9% | +14.3% |
Forward fiscal years only. Blank means no analyst coverage for that year.
Fabrinet, a Thailand-based contract manufacturer that assembles optical transceivers, tunable lasers and switching modules to other companies' designs, closed its fiscal year with revenue of $4.64bn. That was growth of 35.7%. Its gross margin for the year was 11.99%, against 12.09% the year before — scale, in this business, buys volume but not price.
That single line explains more about the past week in optical networking than any demand datapoint. Fabrinet's fiscal fourth quarter, reported on 17 August, set a revenue record at $1.32bn, up 45% and above its own guidance, with non-GAAP earnings of $4.10 a share against $2.65 a year earlier. Management then guided the current quarter to $1.375-1.425bn, above the $1.321bn consensus. The shares fell 20.25% the next day, the largest single-session decline across a 110-name list of AI hardware suppliers, and pulled the rest of the optics complex down with them.
Build-to-print has no operating leverage
Fabrinet does not own the designs it builds. It qualifies processes, then manufactures at the margin its customers permit, and its fiscal 2026 annual report discloses four customers at 10% or more of revenue — Cisco at 20%, NVIDIA 16%, Nokia 11% and Amazon 11%, or 57.4% between them. Revenue growth accelerated through the year, from 21.6% to 44.6%, while gross profit stayed pinned near a twelfth of it. Chief executive Seamus Grady told the call he sees "no end in sight" to data-center demand. Consensus nonetheless models fiscal 2027 revenue growth of 23.6%, a marked step down.
The systems and the glass tell a different story
Ciena, which sells coherent optical transport platforms and network software to carriers and, increasingly, to cloud operators, is the counterweight. April-quarter revenue rose 39.5% to $1.57bn, operating margin reached 15.1% against 3.1% a year earlier, and backlog climbed more than $600m sequentially to $7.7bn as the company raised its full-year outlook to about $6.3bn. Roughly 46% of revenue now comes from cloud and hyperscale customers.
Corning is not an optics pure-play but a materials group spanning display glass, ceramics, solar and labware. Its Optical Communications sales rose 32% to $2.07bn in the June quarter, with segment net income up 77% to $438m and enterprise optical — the data-center line — up 65% to $1.27bn. It has signed long-term agreements with Meta, worth up to $6bn, plus NVIDIA and Amazon, and will expand US optical connectivity capacity tenfold under the NVIDIA deal. Management says the margin gains come from connectivity design, not fiber pricing, and that demand still exceeds supply. Its weak spots are elsewhere: solar lost $7m on a plant shutdown, and glass for handsets grew 1%.
What actually moved
On 4 August, reports that the Federal Communications Commission was drafting a ban on imports of new Chinese optical transceiver models added 8-16% to these names in a session; Counterpoint Research put the loser at China's Innolight, near 27% share. Between 17 and 19 August that rally reversed entirely — Fabrinet down 22.3%, Corning 12.0%, Ciena 10.3% — helped by Anthropic's reported $65bn revenue run rate against an $80bn expectation and a 30-year Treasury yield at 5.323%, a 19-year high.
On price to trailing gross profit — the honest lens for a thin-margin assembler and a mixed conglomerate alike — Fabrinet has fallen from about 48x in mid-May to 29.3x, Ciena from 35.5x to 23.6x, Corning from 25.6x to 21.3x. In all three cases trailing gross profit was still growing. The caveat is the anchor: over twelve months Ciena remains up 350%, Corning 136% and Fabrinet 59%. This is a de-rating from an extreme. Co-packaged optics, the structural bear case, is not the cause — LightCounting and Cignal AI both expect no material displacement of pluggable modules for three years, and Corning frames inside-the-box photonics as a $10bn platform where it currently has no content at all.
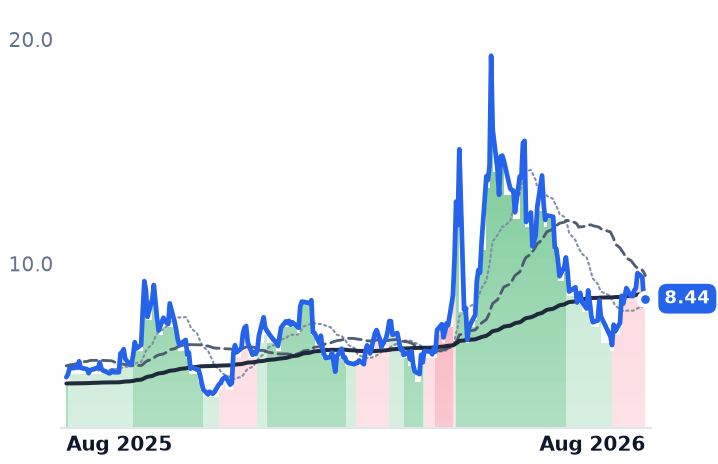
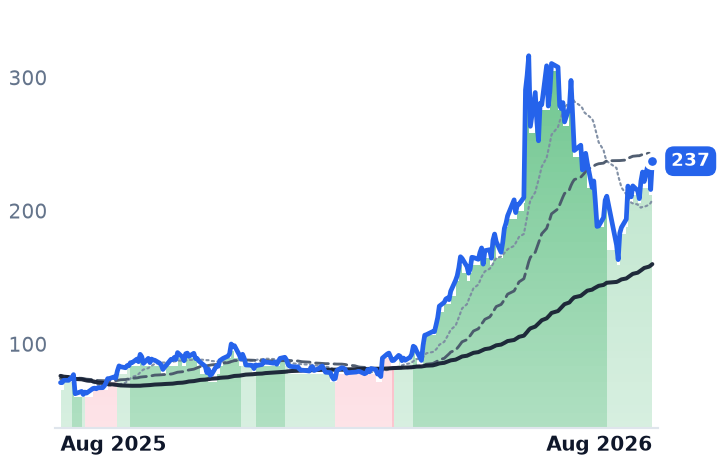
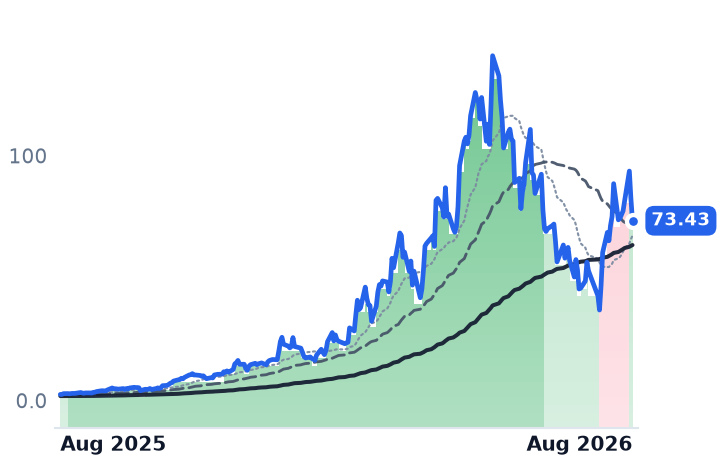
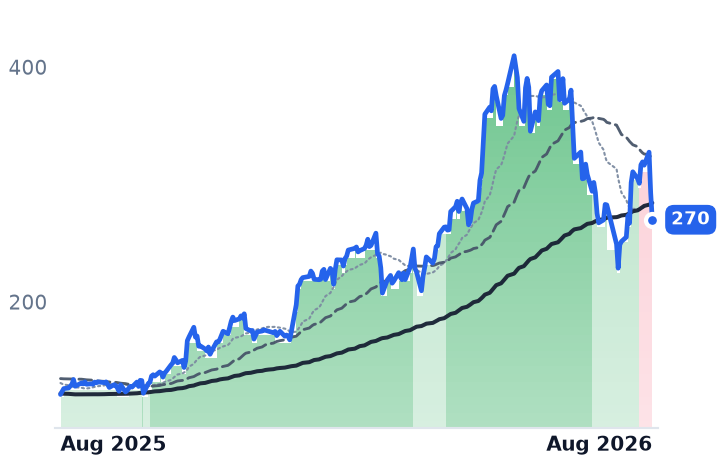
Fabrinet's downtrend predates the print: its 50-day average crossed below its 200-day in early July. Corning and Ciena only turned in mid-August, after the businesses reported.
The setup
Where it stands — Three interconnect suppliers with accelerating revenue have de-rated by a third or more since May on multiples, not results. Would confirm — Fabrinet's October quarter landing inside its $1.375-1.425bn guide with gross margin at or above 12%. Would invalidate — Ciena reporting backlog below $7.7bn, or Corning trimming its Optical Communications growth outlook. Watch next — Ciena's fiscal third quarter, before the US open on 3 September 2026. Valuation — Fabrinet at 29.3x trailing gross profit and 23.9x forward, against roughly 48x in mid-May.