

Figma's Revenue Accelerated to 48% While AI Costs Took Five Points of Gross Margin
Hypothesis Opus 5 · Research Opus 5 · Writing Opus 5 · Prompt v1.5
The fear that generative artificial intelligence would delete design software has not shown up where investors expected it. Figma, the browser-based design tool that listed a year ago, grew revenue 48% last quarter — a third straight acceleration — and Adobe's annual recurring revenue reached $27.1bn, up 12.5%. Neither is losing its customers.
Both are losing margin instead. Figma's gross margin fell to 83.7% from 88.8% as the cost of running AI models more than doubled its cost of revenue; Adobe's operating margin gave up 2.1 points. The two bottomed on the same June session and have since risen 59% and 41%.
What is unresolved is price. Figma trades at 8.9 times forward sales, more than twice Adobe's 4.1 times, while Adobe sits near 11 times forward earnings against a five-year median close to 42. Same customers, same threat, opposite valuations.
| Ticker | Company | Segment | Trend · 13mo | 30D | 1Y |
|---|---|---|---|---|---|
| The subject · what this brief is about | |||||
FIG | Figma | Design & Content Creation | 🔴 Cont. Bear | +11.5% | −61.4% |
ADBE | Adobe | Design & Content Creation | 🔴 Cont. Bear | +16.1% | −24.5% |
| Compared against · context, not the story | |||||
SEMR | Semrush | Marketing & Advertising Technology | 🟢 Cont. Bull | — | +55.2% |
TEAM | Atlassian | Developer Tools & DevOps | 🔴 Cont. Bear | +80.7% | +4.8% |
GETY | Getty Images | Internet Content & Information | 🔴 Cont. Bear | −49.9% | −85.6% |
SSTK | Shutterstock | Media & Content Distribution | 🔴 Cont. Bear | −28.1% | −72.5% |
CDNS | Cadence Design Systems | Developer Tools & DevOps | 🌱 Emerging Bull | −4.5% | −9.2% |
SNPS | Synopsys | EDA & Design Tools | 🔴 Cont. Bear | +6.0% | −34.5% |
ADSK | Autodesk | Design & Content Creation | 🔴 Cont. Bear | +15.4% | −13.1% |
PTC | PTC | Specialized Enterprise Solutions | 🔴 Cont. Bear | +22.1% | −27.4% |
GTLB | GitLab | Developer Tools & DevOps | 🌱 Emerging Bull | +25.0% | −3.8% |
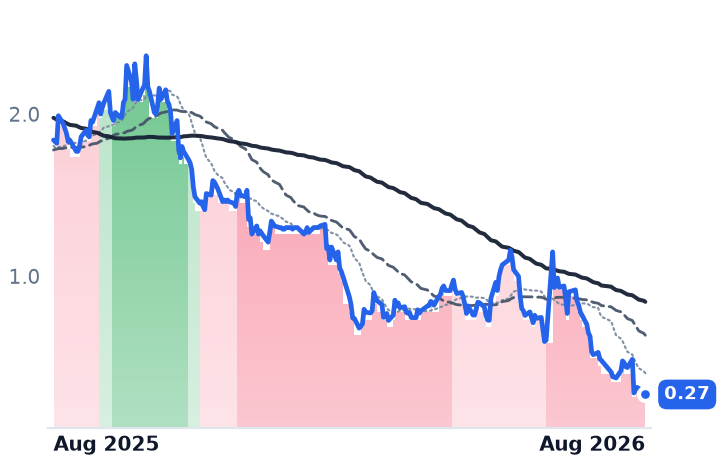
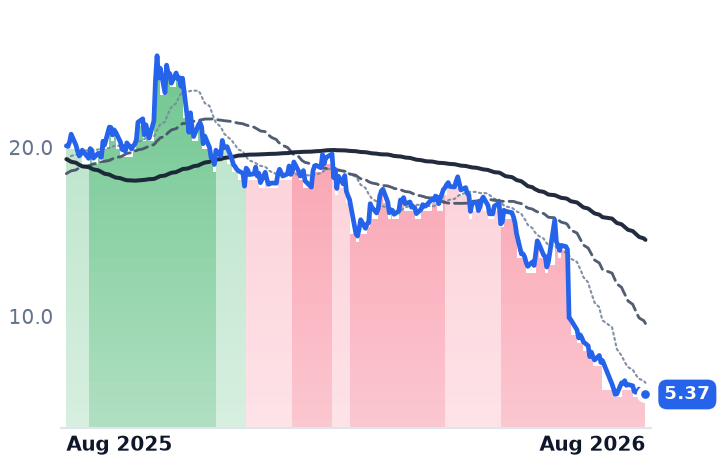
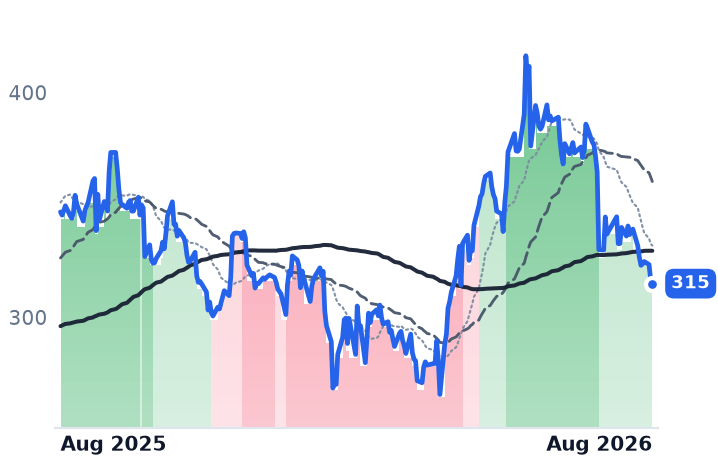
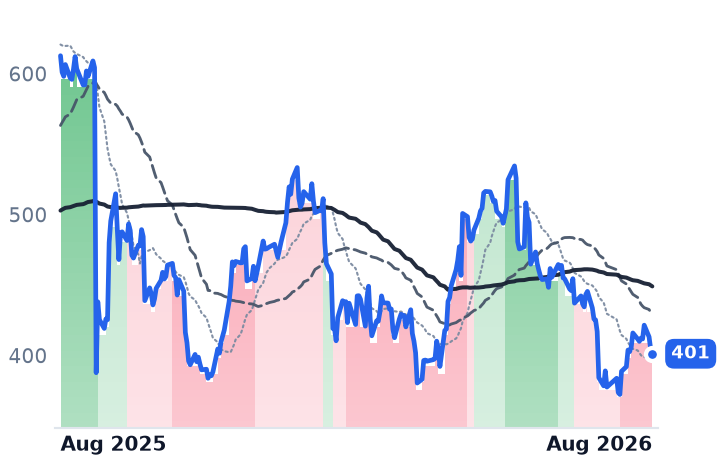
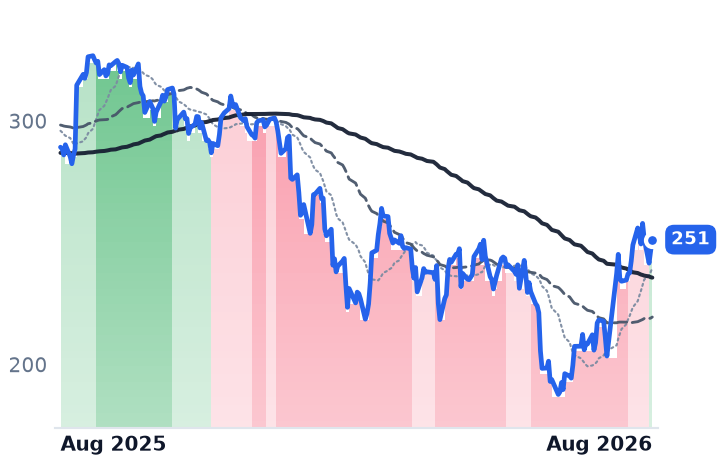
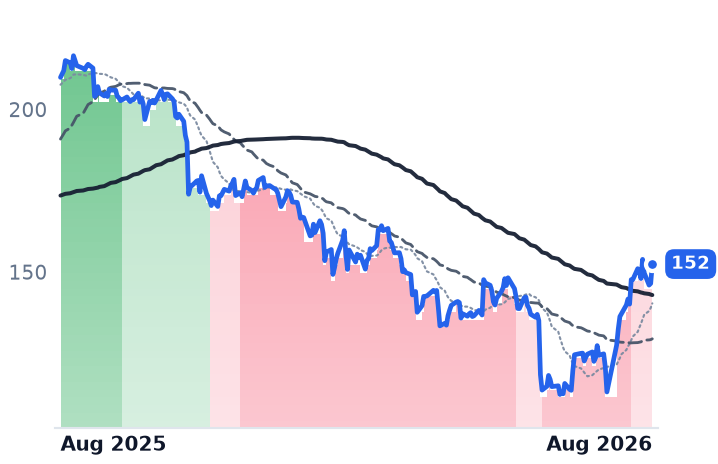
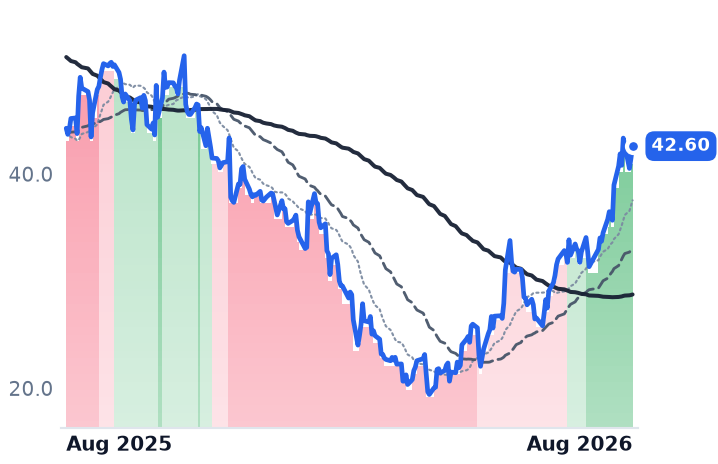
12-month price & trend
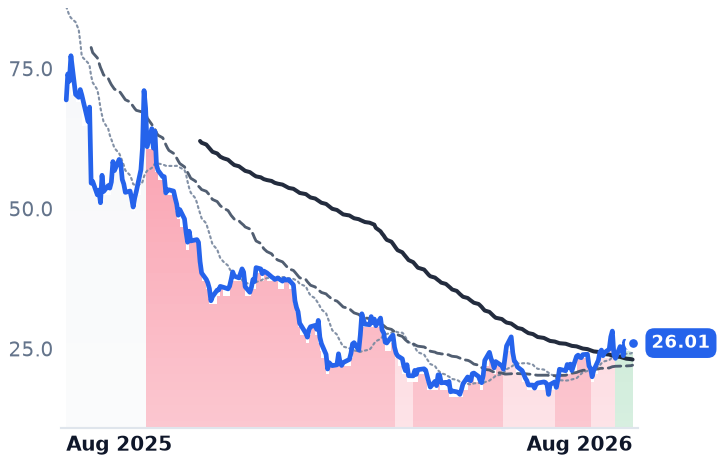
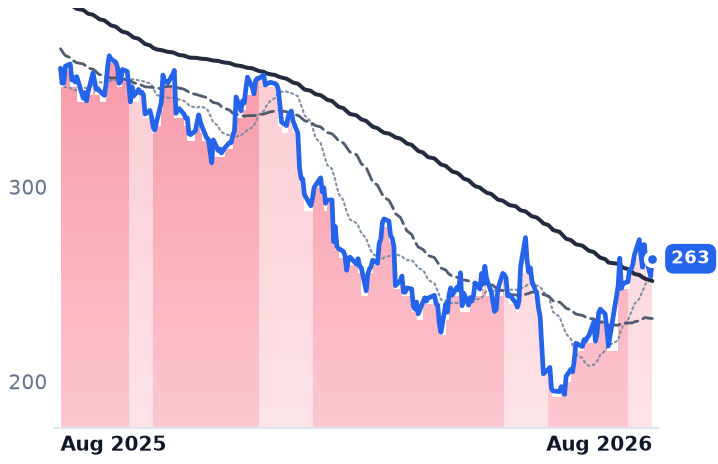
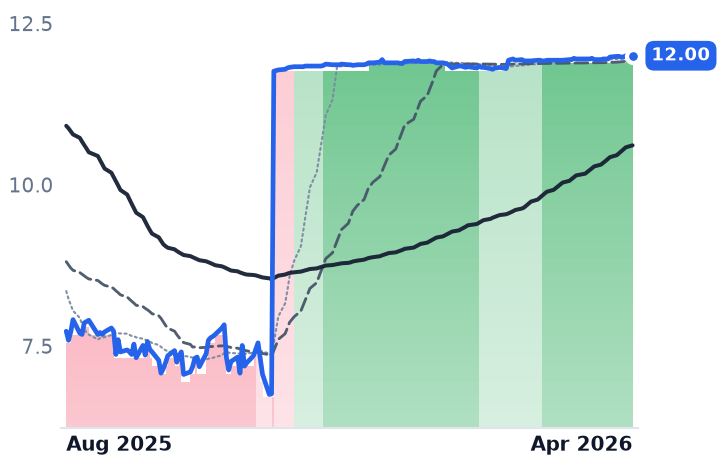
| Ticker | Mkt cap | P/E | P/E fwd | P/S | P/S fwd | P/GP | P/GP fwd | EV/EBITDA | FCF yld |
|---|---|---|---|---|---|---|---|---|---|
FIG | $13.1B | n/m | 93.6x | 10.2x | 8.9x | 12.9x | 11.2x | n/m | 1.8% |
ADBE | $108.3B | 15.6x | 11.2x | 4.3x | 4.1x | 4.8x | 4.6x | 11.1x | 9.8% |
SEMR | $1.8B | n/m | 30.4x | 4.1x | 3.6x | 5.1x | 4.4x | 254.3x | 2.9% |
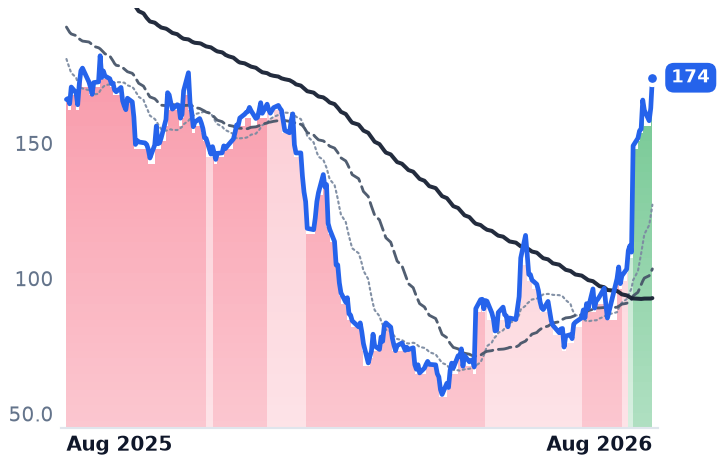
| Ticker | Mkt cap | P/E | P/E fwd | P/S | P/S fwd | P/GP | P/GP fwd | EV/EBITDA | FCF yld |
|---|---|---|---|---|---|---|---|---|---|
TEAM | $44.8B | n/m | 28.0x | 6.8x | 6.1x | 8.0x | 7.2x | 296.5x | 2.9% |
GETY | $113.3M | n/m | 11.8x | 0.1x | 0.1x | 0.2x | 0.2x | 11.6x | -74.0% |
SSTK | $197.3M | n/m | — | 0.2x | 0.3x | 0.4x | 0.4x | n/m | 45.0% |
| Ticker | Mkt cap | P/E | P/E fwd | P/S | P/S fwd | P/GP | P/GP fwd | EV/EBITDA | FCF yld |
|---|---|---|---|---|---|---|---|---|---|
CDNS | $89.1B | 63.9x | 39.7x | 15.3x | 14.1x | 17.2x | 15.9x | 41.3x | 1.9% |
SNPS | $79.1B | 93.5x | 27.9x | 9.1x | 8.2x | 12.4x | 11.1x | 32.3x | 3.4% |
ADSK | $51.0B | 35.0x | 19.2x | 6.8x | 6.2x | 7.5x | 6.8x | 23.6x | 5.3% |
| Ticker | Mkt cap | P/E | P/E fwd | P/S | P/S fwd | P/GP | P/GP fwd | EV/EBITDA | FCF yld |
|---|---|---|---|---|---|---|---|---|---|
PTC | $16.9B | 14.1x | 17.9x | 5.7x | 6.2x | 6.8x | 7.4x | 10.8x | 5.5% |
GTLB | $6.8B | n/m | 49.9x | 6.8x | 6.1x | 7.9x | 7.1x | n/m | 3.8% |
Consensus projections
| Ticker | FY2026E | FY2027E | FY2028E | |
|---|---|---|---|---|
FIG | Revenue | +40.5% | +23.8% | +24.2% |
| EPS | −24.5% | +26.7% | +34.4% | |
ADBE | Revenue | +12.0% | +9.1% | +8.8% |
| EPS | +17.2% | +12.7% | +14.2% | |
SEMR | Revenue | +14.2% | +14.3% | +14.4% |
| EPS | +15.5% | +24.1% | +21.4% | |
TEAM | Revenue | +24.7% | +13.4% | +15.9% |
| EPS | +55.5% | +10.5% | +18.0% | |
GETY | Revenue | +1.8% | +0.9% | +3.8% |
| EPS | −112.1% | +126.0% | +185.7% | |
SSTK | Revenue | −23.3% | −8.0% | −4.9% |
| EPS | −145.9% | −148.0% | +10.2% | |
CDNS | Revenue | +19.7% | +13.6% | +11.7% |
| EPS | +15.3% | +17.0% | +14.3% | |
SNPS | Revenue | +37.4% | +10.9% | +11.9% |
| EPS | +15.3% | +17.2% | +18.6% | |
ADSK | Revenue | +17.0% | +14.4% | +10.2% |
| EPS | +23.0% | +23.1% | +12.7% | |
PTC | Revenue | +4.9% | +6.2% | +7.5% |
| EPS | +20.1% | +8.5% | +10.5% | |
GTLB | Revenue | +25.6% | +17.8% | +15.3% |
| EPS | +40.9% | −8.9% | +25.2% |
Forward fiscal years only. Blank means no analyst coverage for that year.
Figma reported second-quarter results on 5 August that beat its own guidance and lifted the full-year outlook. The shares fell 14.85% the following session. The reason was not demand — it was what the company now pays to serve it.
A beat that cost five points of gross margin
Figma sells a browser-based canvas where design and product teams draw interfaces, prototype them and hand them to engineers, billed per editor and per developer seat. Revenue in the quarter ended 30 June was $370.1m, up 48.2% — the fourth straight quarterly acceleration, from 38% a year earlier. Paid customers spending more than $10,000 a year rose 34% to 15,964, and those above $100,000 rose 46% to 1,635, the company disclosed. Net dollar retention — what existing customers spend this year against last — was 136%.
Against that, cost of revenue more than doubled to $60.5m, and reported gross margin fell to 83.66% from 88.83%. Gross profit grew 40% while revenue grew 48%. That gap is the whole story of the quarter. Figma's newer products — Make, which turns a prompt into a working prototype, and an in-product agent — are metered in credits, and every credit call runs a model on rented accelerators. A seat carried no variable cost; a credit does. More than 80% of Figma's $10,000-plus customers now use AI credits weekly. Management says it routes across model providers and is shifting work to its own models, and warns margin will stay volatile while new products scale ahead of monetization.
Two other numbers frame the quarter. Figma guided the current quarter to roughly $373m, or 36% growth — a visible step down from 48%. And its reported operating loss of $117.3m sits against a non-GAAP operating margin of 10%, a gap of about $154m, or 42% of revenue, driven principally by stock compensation. A lock-up releasing 77.7m shares, some $1.86bn or roughly 15% of the float, opened on 8 August; the stock is up about 15% since, so the supply cleared into strength rather than crushing the price.
Adobe has the same disease and a tenth the multiple
Adobe sells the same creative professionals a bundle — Photoshop, Illustrator, Acrobat — on annual subscriptions, plus marketing software to enterprises. Fiscal second-quarter revenue was $6.618bn, up 12.7%, itself an acceleration from 10.5% two quarters earlier. Ending annual recurring revenue reached $27.1bn, and AI-first recurring revenue crossed $500m, roughly tripling. Diluted shares fell 7.2% year over year against a fresh $25bn buyback authorization.
And the margin told the same story as Figma's. Operating margin fell to 33.8% from 35.9%, and net income grew 1.2% on 12.7% revenue growth. Generative features are bundled into subscriptions whose price did not rise, so cost per subscriber climbs while revenue per subscriber does not. Adobe is also mid-transition at the top: Shantanu Narayen said in March he will step down once a successor is installed, with fiscal third-quarter results due around 10 September.
The competitive threat is real and dated. Anthropic launched Claude Design in April, a conversational prompt-to-prototype tool aimed squarely at Figma's estimated 80–90% share of interface design. Figma's answer is that professional work needs a fast canvas and direct manipulation, and that its file becomes the context agents read from — calls writing into Figma through its model-context protocol grew 75% in a quarter. Adobe's is file-format dominance in the professional tier.
What the two prices assume
Figma is at 8.88 times forward sales and 11.2 times forward gross profit, with a forward price/earnings of 93.6 on losses and a trailing free-cash-flow yield of 1.77%. Consensus models it growing 24% next year with no path to reported operating profit through 2029. Adobe is at 11.2 times forward earnings and 4.08 times forward sales, the lowest multiple in over a decade against a five-year median near 41.6, with a 9.8% free-cash-flow yield — about five and a half times Figma's.
The advance that produced both is narrower than it looks. The two bottomed in the same session, 25 June, and Figma's trend turned positive on 7 August, Adobe's on 18 August — the day money rotated out of semiconductors into beaten-down software. Remove each stock's two best sessions and Figma's 11.5% month becomes minus 7.8% and Adobe's 16.1% month becomes minus 3.8%. Over six months Figma is up 2.7%. The businesses mended steadily; the prices moved in a handful of days.
The setup
Where it stands — Both companies are growing faster than a year ago and earning less per dollar of revenue, and only Adobe's multiple reflects the doubt.
Would confirm — Figma's gross margin recovering above 85% on a reported basis while third-quarter revenue growth holds at or above the 36% guided.
Would invalidate — Net dollar retention falling below 130%, or Adobe's annual recurring revenue growth slipping under 10%.
Watch next — Adobe's fiscal third quarter, due around 10 September, with a chief executive successor expected to follow.
Valuation — Figma: 10.2x trailing, 8.9x forward sales. Adobe: 15.6x trailing, 11.2x forward earnings, against a five-year median near 41.6x.