

Talen Raised 2026 Guidance, Then Fell 11% on a Day Regulated Utilities Didn't Move
Hypothesis Opus 5 · Research Opus 5 · Writing Opus 5 · Prompt v1.5
Utility investors have spent August blaming a 19-year high in long-term Treasury yields for a selloff in power stocks. The cross-section says otherwise, and that matters for what gets repriced next.
On 18 August, the session the 30-year yield touched 5.323%, the rate-sensitive regulated names were flat — NextEra up 0.36%, Dominion down 0.14%. The stocks that broke were the merchant generators selling contracted power to artificial-intelligence data centers: Talen fell 11.4%, Vistra 4.2%, Constellation 4.1%. That is a counterparty-credit story about hyperscaler balance sheets, not a discount-rate story.
None of the three businesses deteriorated. Talen raised 2026 adjusted EBITDA guidance to $2.03-2.23bn on 5 August; Vistra's second-quarter adjusted EBITDA rose 30% with 2026 and 2027 targets reaffirmed. Talen now trades at 15.2 times forward earnings against 20.5 times at its June high, on the same estimate.
| Ticker | Company | Segment | Trend · 13mo | 30D | 1Y |
|---|---|---|---|---|---|
| The subject · what this brief is about | |||||
VST | Vistra | Integrated Retail & Generation | 🔴 Cont. Bear | −9.7% | −26.0% |
NEE | NextEra Energy | Vertically Integrated Utilities | ⚠️ Emerging Bear | −2.3% | +14.8% |
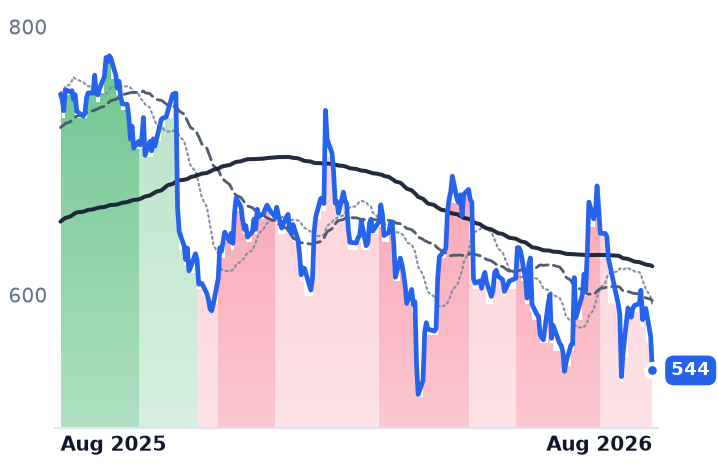
TLN | Talen Energy | Wholesale Power Producers | 🟢 Cont. Bull | −10.5% | −12.4% |
| Compared against · context, not the story | |||||
CEG | Constellation Energy | Diversified Renewable Generators | ⚠️ Emerging Bear | +8.2% | −13.4% |
D | Dominion Energy | Vertically Integrated Utilities | 🟢 Cont. Bull | −2.7% | +15.5% |
AEP | American Electric Power | Vertically Integrated Utilities | 🟢 Cont. Bull | −3.7% | +13.8% |
ORA | Ormat Technologies | Geothermal & Specialized | ⚠️ Emerging Bear | +6.4% | +19.3% |
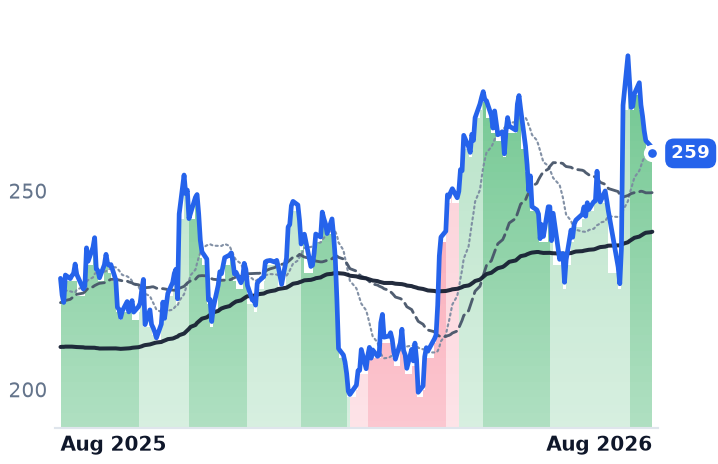
MSFT | Microsoft | Cloud Infrastructure & Platforms | 🔴 Cont. Bear | +21.4% | −3.7% |
META | Meta Platforms | Social Media & Messaging | 🔴 Cont. Bear | −14.3% | −26.2% |
AMZN | Amazon.com | Online Marketplaces | 🟢 Cont. Bull | +5.9% | +16.1% |
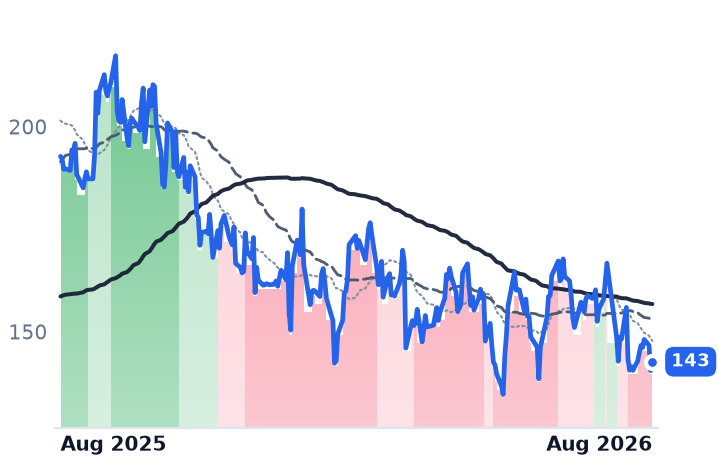
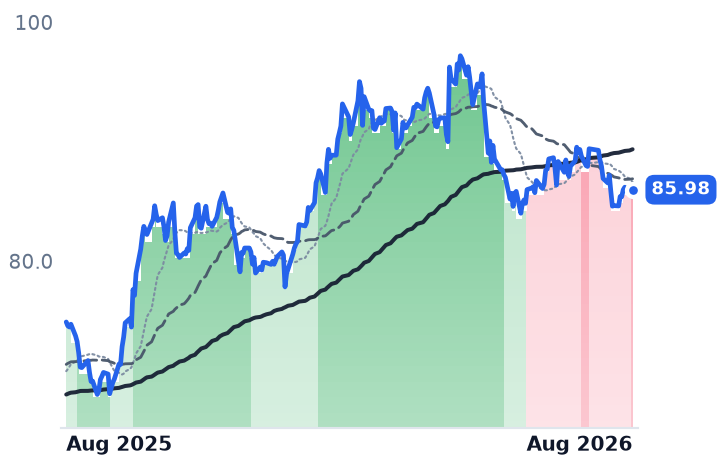
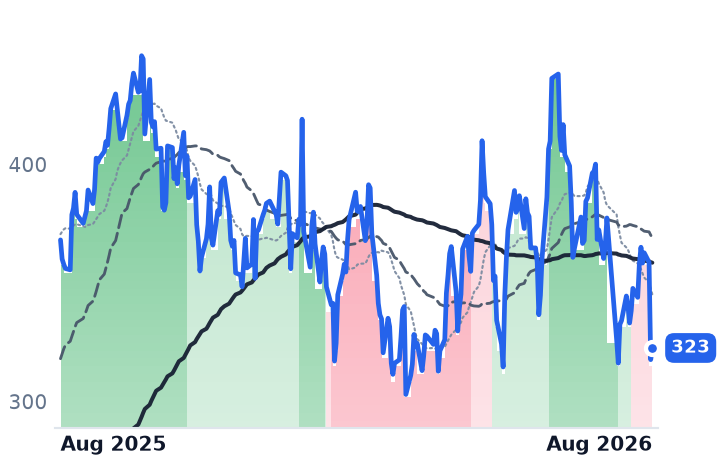
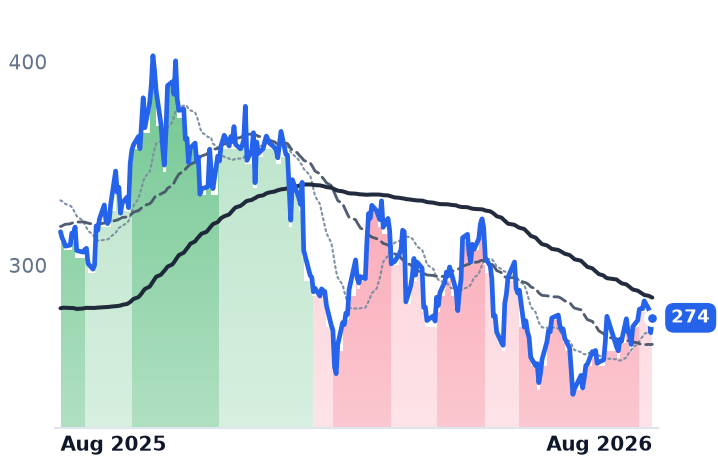
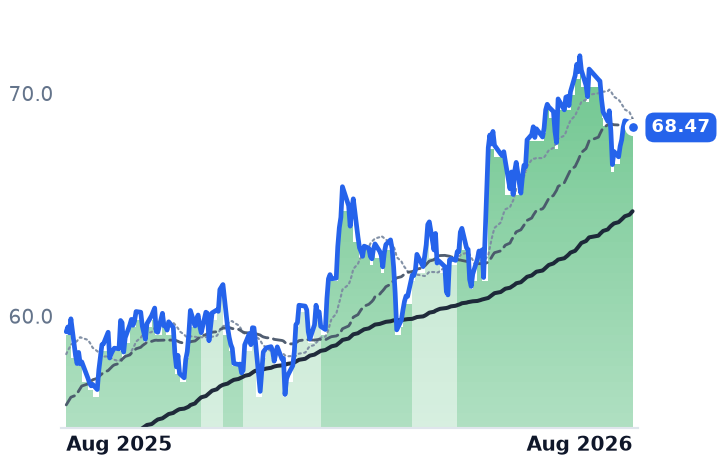
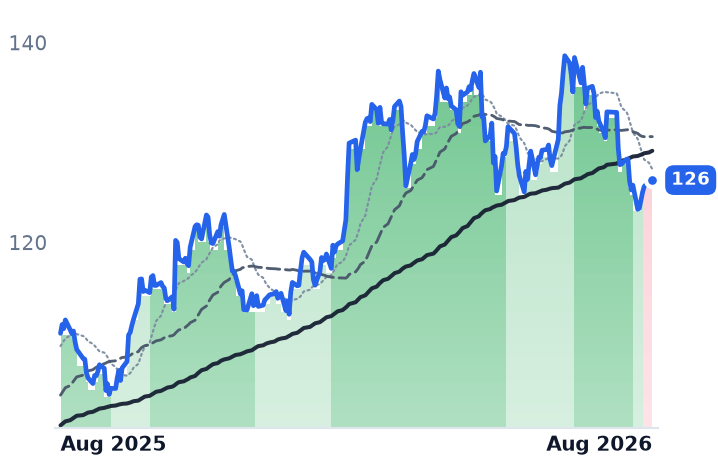
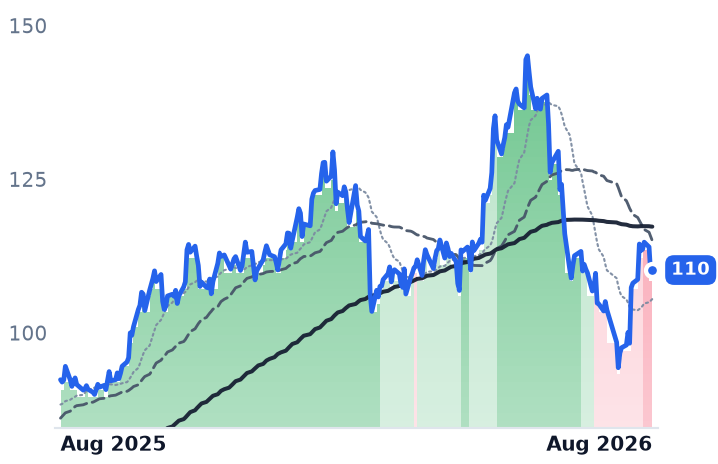
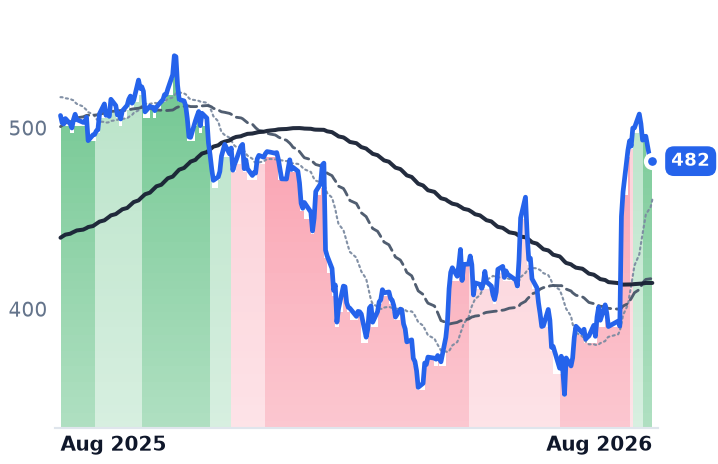
12-month price & trend
| Ticker | Mkt cap | P/E | P/E fwd | P/S | P/S fwd | P/GP | P/GP fwd | EV/EBITDA | FCF yld |
|---|---|---|---|---|---|---|---|---|---|
VST | $48.1B | 23.8x | 15.7x | 3.0x | 2.1x | 23.2x | 16.0x | 10.4x | 2.9% |
NEE | $179.2B | 19.2x | 21.2x | 6.2x | 5.8x | 8.6x | 8.1x | 16.2x | -5.7% |
TLN | $14.6B | n/m | 15.2x | 4.1x | 3.3x | 9.3x | 7.3x | 30.2x | 3.5% |
| Ticker | Mkt cap | P/E | P/E fwd | P/S | P/S fwd | P/GP | P/GP fwd | EV/EBITDA | FCF yld |
|---|---|---|---|---|---|---|---|---|---|
CEG | $101.4B | 27.5x | 24.1x | 3.2x | 3.1x | 3.4x | 3.2x | 14.7x | 0.3% |
D | $59.3B | 23.3x | 18.8x | 3.2x | 3.2x | 6.6x | 6.6x | 15.3x | -11.5% |
AEP | $68.1B | 18.6x | 19.7x | 3.1x | 2.9x | 7.6x | 7.2x | 13.7x | 9.1% |
| Ticker | Mkt cap | P/E | P/E fwd | P/S | P/S fwd | P/GP | P/GP fwd | EV/EBITDA | FCF yld |
|---|---|---|---|---|---|---|---|---|---|
ORA | $8.1B | 62.8x | 57.4x | 6.9x | 7.0x | 25.2x | 25.4x | 18.8x | -2.7% |
MSFT | $3.7T | 27.5x | 25.2x | 11.1x | 9.4x | 16.3x | 13.9x | 18.2x | 1.8% |
META | $1.5T | 21.9x | 18.4x | 6.6x | 5.9x | 8.1x | 7.2x | 14.9x | 2.7% |
| Ticker | Mkt cap | P/E | P/E fwd | P/S | P/S fwd | P/GP | P/GP fwd | EV/EBITDA | FCF yld |
|---|---|---|---|---|---|---|---|---|---|
AMZN | $2.8T | 20.8x | 22.4x | 3.6x | 3.4x | 7.2x | 6.7x | 11.7x | -0.4% |
Consensus projections
| Ticker | FY2026E | FY2027E | FY2028E | |
|---|---|---|---|---|
VST | Revenue | +20.8% | +8.9% | +4.9% |
| EPS | +89.5% | +20.6% | +16.1% | |
NEE | Revenue | +9.4% | +9.8% | +8.6% |
| EPS | +9.5% | +8.9% | +8.1% | |
TLN | Revenue | +85.4% | +16.2% | +4.4% |
| EPS | +258.6% | +48.7% | +19.6% | |
CEG | Revenue | +35.3% | +4.1% | +5.2% |
| EPS | +25.2% | +13.1% | +28.6% | |
D | Revenue | +13.4% | +6.1% | +5.7% |
| EPS | +4.9% | +6.4% | +6.9% | |
AEP | Revenue | +9.1% | +5.8% | +7.5% |
| EPS | +7.4% | +7.9% | +10.5% | |
ORA | Revenue | +19.2% | +1.7% | +10.7% |
| EPS | +4.8% | +8.5% | +29.3% | |
MSFT | Revenue | +18.0% | +18.2% | +19.6% |
| EPS | +26.7% | +15.4% | +18.5% | |
META | Revenue | +27.3% | +19.9% | +17.9% |
| EPS | +39.6% | +7.2% | +15.8% | |
AMZN | Revenue | +15.7% | +14.0% | +15.9% |
| EPS | +63.6% | −10.9% | +30.2% |
Forward fiscal years only. Blank means no analyst coverage for that year.
Talen Energy, an independent power producer that sells electricity, capacity and grid services into US wholesale markets from roughly 10.7 gigawatts (GW) of nuclear, gas, coal and solar plants, told investors on 5 August that 2026 would be better than it had previously said. Management raised full-year adjusted EBITDA guidance to $2.03-2.23bn and adjusted free cash flow to $1.20-1.35bn. Second-quarter revenue grew 64.5% to $747m, and gross margin widened to 49.3% from 20.7% a year earlier. The shares have fallen about a tenth since.
The standard explanation for August weakness across power stocks is the long end of the bond market. Utilities are bought for their yield and fund their construction in the debt markets, so a rising discount rate should hurt them. It is a clean story. It is also the wrong one.
The session that separated the two explanations
On 18 August the 30-year Treasury yield touched 5.323%, its highest since 2007, on deficits, heavy corporate issuance funding AI construction and uncertainty about policy under new Federal Reserve chair Kevin Warsh. If duration were the mechanism, the regulated utilities would have led the decline. They did not move: NextEra Energy rose 0.36%, American Electric Power 0.19%, Dominion Energy slipped 0.14%. What broke were the merchants whose equity value rests on long-dated fixed-price contracts with cloud computing companies — Talen down 11.44%, Vistra down 4.19%, Constellation Energy down 4.09%.
The day before, Microsoft fell around 3% after Morgan Stanley warned on hyperscaler creditworthiness and the widening gap between what AI infrastructure costs and what it earns. A megawatt contracted for twenty years is worth what the buyer is good for. Talen carried its own catalyst too: Raymond James cut its price target to $449 and Oppenheimer to $400, both citing execution risk, with a $984m shelf registration adding dilution overhang. Both targets still sit far above the $322.58 close.
Nor is this the slow bleed it looks like in aggregate. Remove each name's two worst sessions from the past 30 days and Vistra's 9.7% decline turns into a 10.3% gain, Talen's 10.5% into 17.0%. Only NextEra's small 2.3% slide is genuinely spread out — worst single day, 1.57% — and NextEra runs an interest-rate hedging program of more than $46bn against precisely that risk.
The businesses went the other way
Vistra, which runs about 38,700 megawatts of gas, nuclear, coal, solar and battery capacity and sells retail electricity to some 4.3m customers, posted second-quarter adjusted EBITDA of $1.767bn, up 30%, with the generation arm up roughly 68%. It reaffirmed 2026 guidance of $6.8-7.6bn and held 2027 at $7.4-7.8bn even against softer Texas forward power curves. Neither its pending Cogentrix gas acquisition nor its 20-year Meta nuclear contracts covering more than 2,600 MW sits inside those numbers.
NextEra pairs Florida Power & Light, serving about 5.7m accounts, with the largest US clean-energy development business. Adjusted earnings per share rose 9.5%, the development backlog reached 35.1 GW, and the utility raised its expectation for large industrial load in Florida to 8 GW by 2032 from 6 GW — roughly $2bn of rate base per gigawatt, earning an allowed return. Guidance for 2026 through 2035 was left untouched.
The capacity market is not signaling weakness either. PJM Interconnection's auction for 2028/29 cleared at the $325 per megawatt-day price cap for the third straight year, and came in 6.8 GW short of its own reliability requirement, with the uncapped price estimated at $554.72. Revenue is limited by regulation, not by demand.
Where the prices now sit
Vistra trades at 15.7 times forward earnings against 18.8 times at its February price on the same $9.06 consensus estimate, and at 10.4 times trailing EV/EBITDA — the fitting anchor for a leveraged generator. Talen's trailing multiple is meaningless on a GAAP net loss of $92m; on forward earnings it is 15.2 times, against 20.5 times at its 18 June high on the identical estimate. NextEra has de-rated to 8.60 times gross profit from 11.73 times in mid-May, while gross profit per share rose; on management's own adjusted guidance the shares are near 21.5 times.
One control matters. Dominion, which votes on its all-stock combination with NextEra on 3 September, has held an uptrend for 75 unbroken sessions since late April, its 50-day average above its 200-day. This is not a utilities selloff. It is a repricing of who is on the other side of the contract.
The setup
Where it stands — Merchant generators with AI offtake have de-rated on counterparty credit while guidance rose; regulated peers are untouched.
Would confirm — Regulated utilities keep holding as long yields rise, while further hyperscaler capital-spending warnings knock Talen, Vistra and Constellation.
Would invalidate — A data-center counterparty renegotiating or walking from a signed power purchase agreement, or 2027 EBITDA guidance being cut.
Watch next — Dominion and NextEra shareholder votes on the merger, 3 September 2026; Texas's Batch Zero data-center audit resolves in roughly two months.
Valuation — Vistra 15.7x forward versus 18.8x in February; Talen 15.2x versus 20.5x in June; NextEra 8.6x gross profit versus 11.7x in May.