

Rockwell's Warehouse-Automation Orders Grew 30% and Its Shares Fell Anyway
Hypothesis Opus 5 · Research Opus 5 · Writing Opus 5 · Prompt v1.4
Four suppliers of the machinery that runs factories and warehouses without people all beat estimates between 29 July and 6 August, and three of the four raised full-year guidance. Three of the four fell on the day they reported.
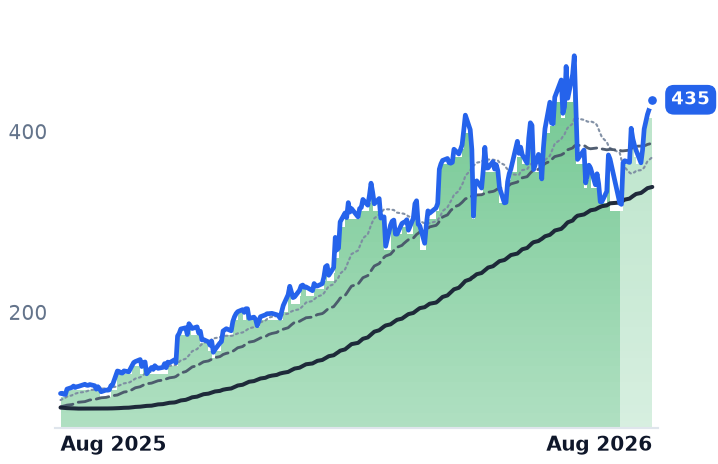
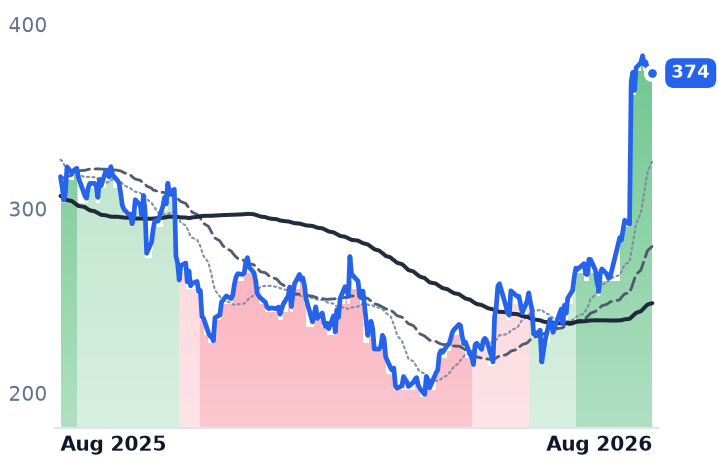
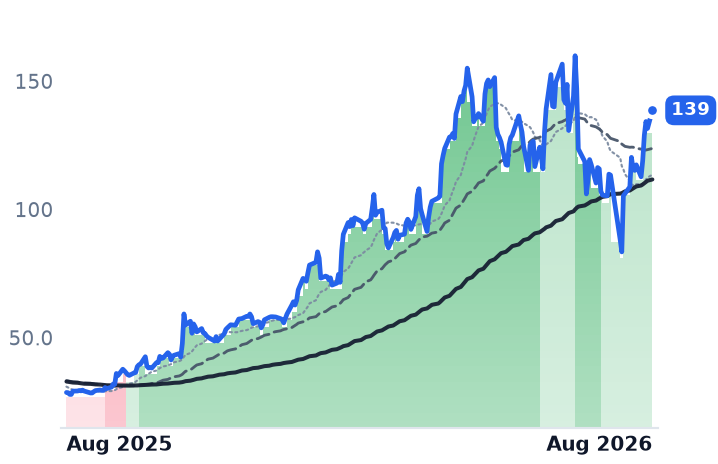
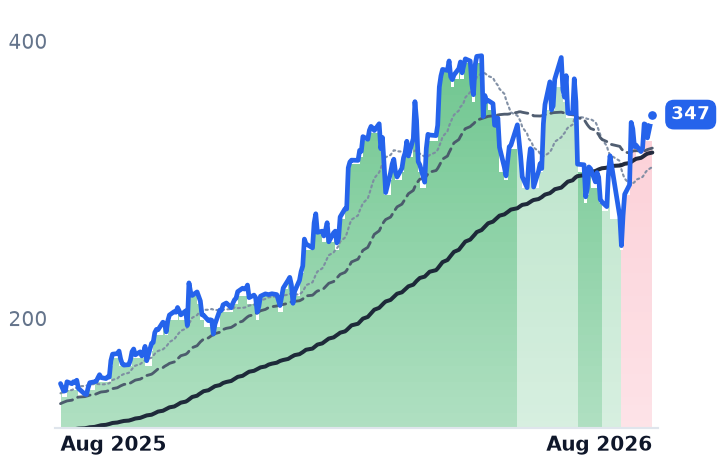
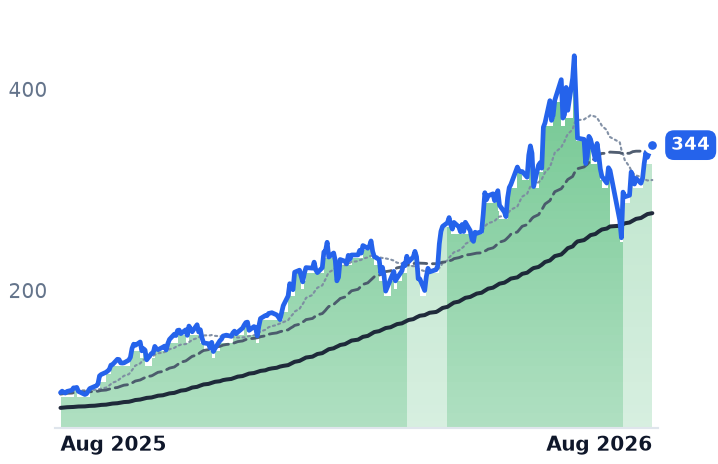
The one that rose sells almost no robots. Teradyne's robotics arm did $100m last quarter, roughly 7.5% of sales; the rest is automated chip test, where revenue doubled to $1.33bn and operating margin reached 32.9%. It is up 298% in twelve months and accounts for essentially the whole group's month.
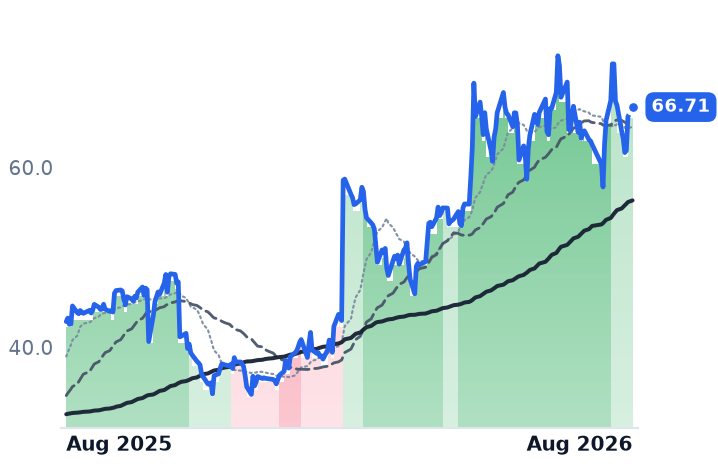
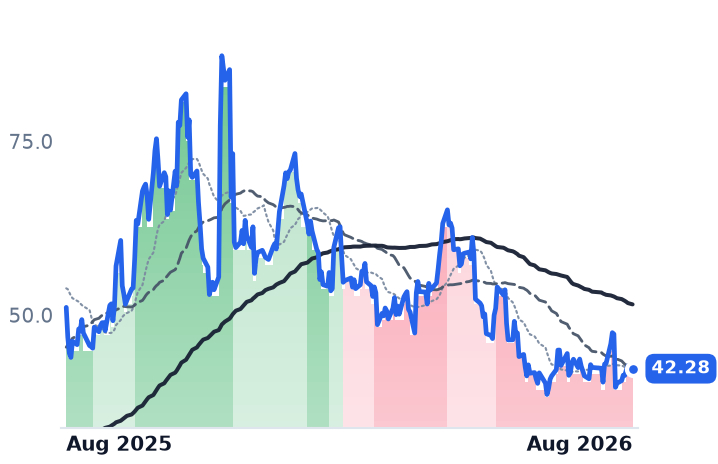
The three names actually paid per robot deployed diverged. Rockwell Automation grew 10% organically with e-commerce and warehouse orders up 30%, raised its guide, and now trades at 33.7x forward earnings, down from a 45x trailing multiple in May. Symbotic's margins widened while its $22.5bn backlog sat flat and a Walmart rollout slipped to 2028.
| Ticker | Company | Segment | Trend · 13mo | 30D | 1Y |
|---|---|---|---|---|---|
| The subject · what this brief is about | |||||
TER | Teradyne | Semiconduct Equipment | 🟢 Cont. Bull | +30.4% | +295.0% |
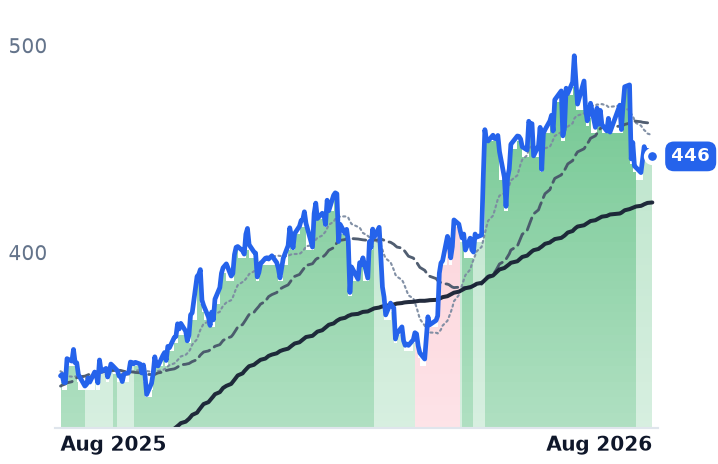
CGNX | Cognex | Precision Motion & Sensors | 🟢 Cont. Bull | +5.8% | +55.7% |
ROK | Rockwell Automation | Industrial Automation & Controls | 🟢 Cont. Bull | −2.7% | +31.2% |
SYM | Symbotic | Industrial Automation & Controls | ⚠️ Emerging Bear | +3.6% | −17.3% |
| Compared against · context, not the story | |||||
ZBRA | Zebra Technologies | IoT & Edge Connectivity | 🌱 Emerging Bull | +41.2% | +17.7% |
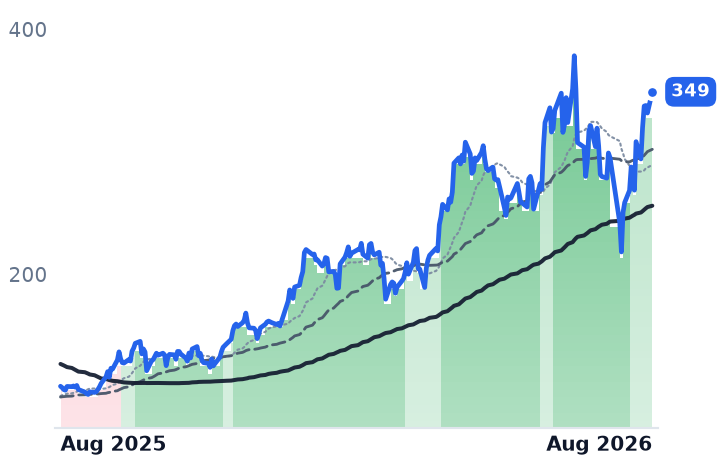
FORM | FormFactor | Process Control & Metrology | 🟢 Cont. Bull | +31.6% | +384.2% |
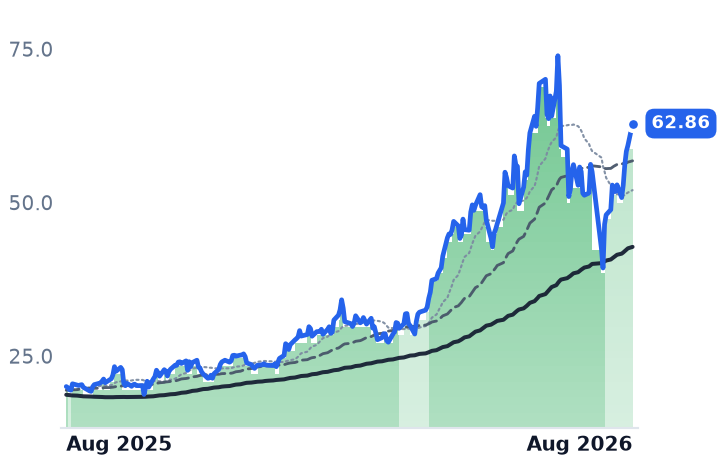
ONTO | Onto Innovation | Semiconduct Equipment | 🟢 Cont. Bull | +25.3% | +221.2% |
COHU | Cohu | Semiconduct Equipment | 🟢 Cont. Bull | +21.9% | +213.8% |
AEIS | Advanced Energy Industries | Data Center Power & Thermal | 🟢 Cont. Bull | +23.6% | +126.8% |
HON | Honeywell International | Aerospace & Defense | 🟢 Cont. Bull | +1.2% | +13.5% |
EMR | Emerson Electric | Industrial Automation & Controls | 🟢 Cont. Bull | +18.4% | +23.7% |
AMAT | Applied Materials | Semiconduct Equipment | 🟢 Cont. Bull | +2.2% | +230.5% |
LRCX | Lam Research | Semiconduct Equipment | 🟢 Cont. Bull | +12.3% | +250.0% |
KLAC | KLA | Semiconduct Equipment | ⚠️ Emerging Bear | +0.0% | −76.4% |
ISRG | Intuitive Surgical | Surgical Robotics & Minimally Invasive Surgery | 🔴 Cont. Bear | +10.7% | −18.8% |
PTC | PTC | Specialized Enterprise Solutions | 🔴 Cont. Bear | +17.7% | −29.5% |
ACLS | Axcelis Technologies | Semiconduct Equipment | 🟢 Cont. Bull | +10.4% | +80.2% |
KLIC | Kulicke and Soffa Industries | Semiconduct Equipment | 🟢 Cont. Bull | +2.3% | +183.3% |
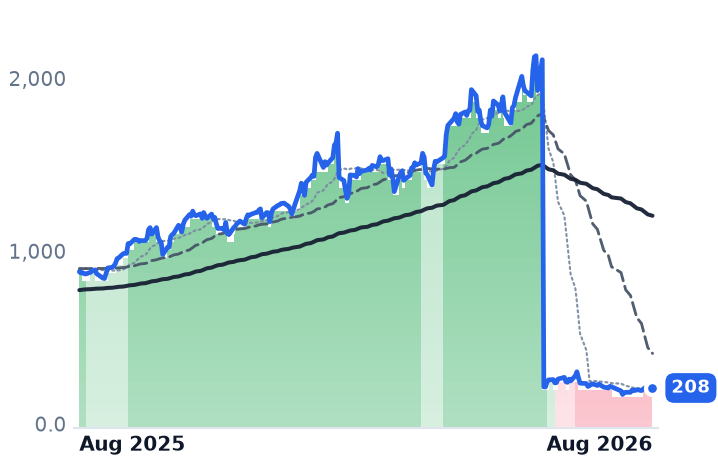
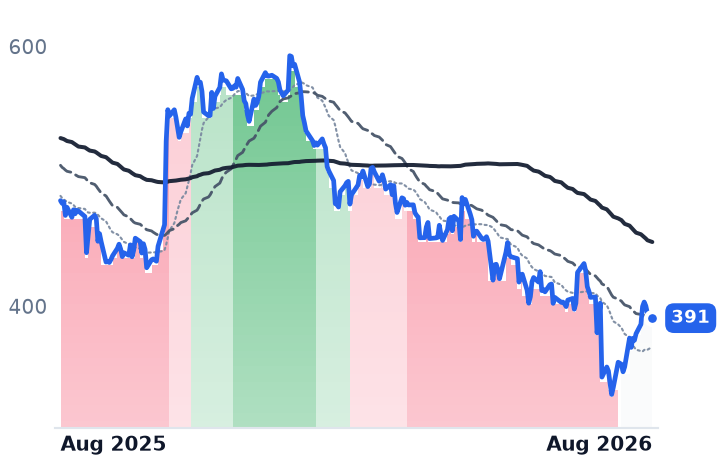
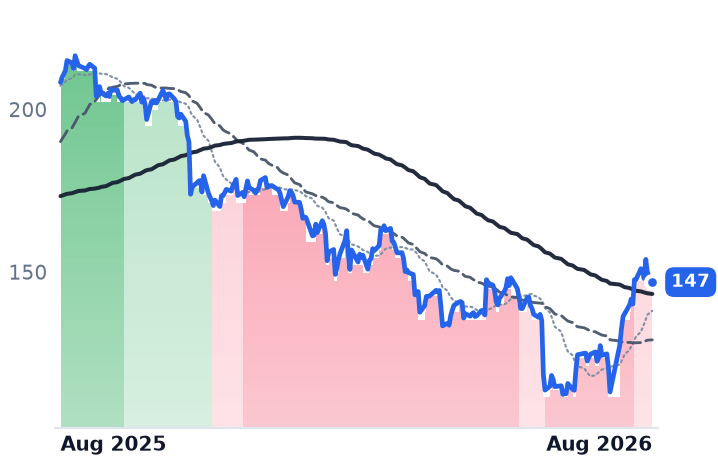
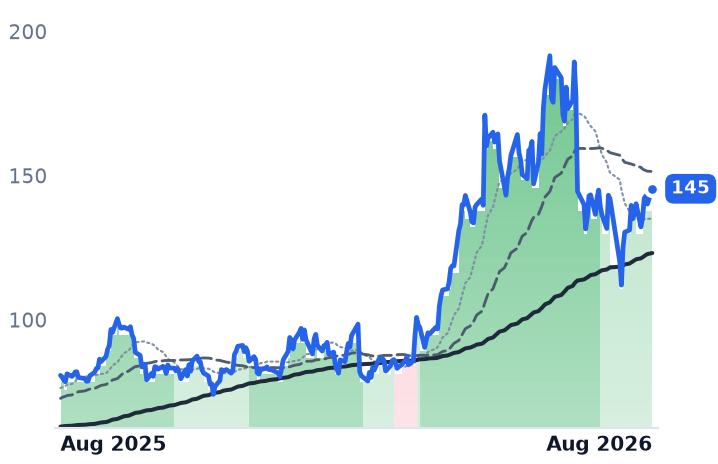
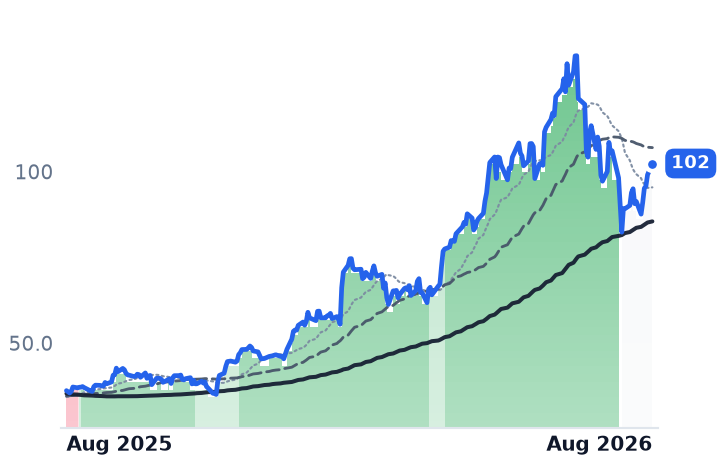
12-month price & trend
| Ticker | Mkt cap | P/E | P/E fwd | P/S | P/S fwd | P/GP | P/GP fwd | EV/EBITDA | FCF yld |
|---|---|---|---|---|---|---|---|---|---|
TER | $69.3B | 60.5x | 48.1x | 15.5x | 13.5x | 26.2x | 22.7x | 47.5x | 1.2% |
CGNX | $11.1B | 63.4x | 44.5x | 10.2x | 10.0x | 14.8x | 14.5x | 38.9x | 2.4% |
ROK | $49.5B | 41.6x | 33.7x | 5.5x | 5.5x | 10.1x | 10.0x | 29.6x | 3.0% |
| Ticker | Mkt cap | P/E | P/E fwd | P/S | P/S fwd | P/GP | P/GP fwd | EV/EBITDA | FCF yld |
|---|---|---|---|---|---|---|---|---|---|
SYM | $27.2B | 442.1x | 77.9x | 10.3x | 9.7x | 47.6x | 44.9x | 420.0x | 2.7% |
ZBRA | $17.7B | 34.7x | 17.9x | 3.0x | 2.9x | 6.2x | 5.8x | 17.8x | 5.1% |
FORM | $9.8B | 143.8x | 51.5x | 11.7x | 10.2x | 27.8x | 24.3x | 64.2x | 0.4% |
| Ticker | Mkt cap | P/E | P/E fwd | P/S | P/S fwd | P/GP | P/GP fwd | EV/EBITDA | FCF yld |
|---|---|---|---|---|---|---|---|---|---|
ONTO | $15.9B | 118.9x | 44.4x | 14.2x | 11.9x | 28.2x | 23.5x | 60.9x | 1.6% |
COHU | $2.5B | n/m | 55.6x | 4.8x | 4.1x | 12.2x | 10.4x | 114.4x | 1.4% |
AEIS | $12.3B | 64.0x | 34.7x | 6.5x | 5.5x | 16.7x | 14.2x | 45.6x | 0.6% |
| Ticker | Mkt cap | P/E | P/E fwd | P/S | P/S fwd | P/GP | P/GP fwd | EV/EBITDA | FCF yld |
|---|---|---|---|---|---|---|---|---|---|
HON | $135.1B | 33.0x | 20.3x | 3.7x | 3.4x | 9.9x | 9.3x | 23.9x | 3.1% |
EMR | $74.5B | 30.5x | 20.5x | 4.1x | 4.0x | 7.7x | 7.5x | 16.7x | 4.2% |
AMAT | $417.3B | 49.2x | 42.8x | 14.4x | 12.5x | 29.4x | 25.5x | 37.5x | 1.4% |
| Ticker | Mkt cap | P/E | P/E fwd | P/S | P/S fwd | P/GP | P/GP fwd | EV/EBITDA | FCF yld |
|---|---|---|---|---|---|---|---|---|---|
LRCX | $389.4B | 53.8x | 33.2x | 16.8x | 11.3x | 33.2x | 22.3x | 44.6x | 1.3% |
KLAC | $261.9B | 54.4x | 36.6x | 19.3x | 14.5x | 31.5x | 23.6x | 46.2x | 1.4% |
ISRG | $149.1B | 50.2x | 40.6x | 14.1x | 12.8x | 21.3x | 19.2x | 39.1x | 1.9% |
| Ticker | Mkt cap | P/E | P/E fwd | P/S | P/S fwd | P/GP | P/GP fwd | EV/EBITDA | FCF yld |
|---|---|---|---|---|---|---|---|---|---|
PTC | $17.1B | 14.3x | 18.1x | 5.8x | 6.3x | 6.9x | 7.5x | 11.0x | 5.5% |
ACLS | $4.2B | 45.1x | 35.3x | 4.8x | 4.9x | 11.2x | 11.5x | 31.7x | 1.6% |
KLIC | $4.8B | 41.2x | 26.7x | 5.0x | 4.4x | 10.4x | 9.2x | 29.1x | 0.8% |
Consensus projections
| Ticker | FY2026E | FY2027E | FY2028E | |
|---|---|---|---|---|
TER | Revenue | +67.0% | +21.3% | +24.5% |
| EPS | +158.9% | +27.6% | +31.5% | |
CGNX | Revenue | +13.2% | +8.9% | +10.4% |
| EPS | +55.4% | +20.7% | +22.8% | |
ROK | Revenue | +9.9% | +5.5% | +6.3% |
| EPS | +31.2% | +12.2% | +11.9% | |
SYM | Revenue | +25.7% | +29.1% | +23.6% |
| EPS | +123.9% | +54.0% | −2.4% | |
ZBRA | Revenue | +15.1% | +5.7% | +3.8% |
| EPS | +31.3% | +6.2% | +7.0% | |
FORM | Revenue | +23.5% | +15.3% | −0.4% |
| EPS | +117.3% | +24.7% | −5.6% | |
ONTO | Revenue | +2.2% | +33.5% | +23.2% |
| EPS | −5.1% | +44.8% | +35.6% | |
COHU | Revenue | +35.3% | +25.7% | +15.3% |
| EPS | +131844.4% | +94.3% | +38.4% | |
AEIS | Revenue | +25.2% | +16.8% | +9.9% |
| EPS | +49.1% | +26.1% | +11.4% | |
HON | Revenue | +1.3% | +6.2% | +5.6% |
| EPS | +4.5% | +9.3% | +9.9% | |
EMR | Revenue | +4.3% | +5.4% | +5.1% |
| EPS | +8.4% | +10.3% | +10.5% | |
AMAT | Revenue | +18.3% | +28.9% | +20.8% |
| EPS | +31.2% | +38.7% | +28.8% | |
LRCX | Revenue | +27.0% | +49.0% | +18.6% |
| EPS | +41.9% | +64.7% | +25.5% | |
KLAC | Revenue | +12.2% | +33.9% | +19.0% |
| EPS | +14.5% | +47.8% | +21.0% | |
ISRG | Revenue | +17.5% | +13.5% | +13.7% |
| EPS | +19.6% | +13.4% | +13.0% | |
PTC | Revenue | +4.9% | +6.2% | +7.5% |
| EPS | +20.1% | +8.5% | +10.5% | |
ACLS | Revenue | +3.5% | +9.6% | +20.0% |
| EPS | −14.8% | +26.4% | +41.7% | |
KLIC | Revenue | +66.9% | +19.5% | +6.4% |
| EPS | +2317.8% | +29.8% | +1.7% |
Forward fiscal years only. Blank means no analyst coverage for that year.
Between 29 July and 6 August, four American companies that supply the equipment behind automated factories and warehouses reported quarterly results. All four beat consensus. Three of the four raised full-year guidance. And three of the four fell on the day they reported.
The one that rose sells almost no robots.
The year belongs to chip test
Teradyne builds the automated test systems chipmakers use to check microchips at the wafer and packaged-device stage; it also owns Universal Robots and Mobile Industrial Robots, which make collaborative arms and warehouse carts. Second-quarter revenue was $1.329bn, up 103.9% from a year earlier. Operating margin reached 32.9%, against 13.9% a year ago.
Almost none of that is robotics. Semiconductor test alone cleared $1.0bn for a second straight quarter, up 128%, with compute — chips for artificial-intelligence accelerators, central processors and networking — at 70% of system-on-chip revenue and growing nearly 600%. Teradyne shipped its first merchant graphics-processor order and completed correlation at a second hyperscale customer. Memory test hit a record $212m on high-bandwidth memory demand, with book-to-bill above 2x. The Robotics segment grew 33%, to $100m — about 7.5% of the quarter.
The stock's 35% month was not a robotics move either. Over the same thirty days FormFactor rose 31%, Onto Innovation 25% and Cohu 23%. Teradyne's mid-August leg followed the beat plus a new $1bn revolving credit line. At 60.5x trailing and 48.1x forward earnings, the multiple is actually lower than the 66x this desk recorded in May, even as market value rose 24% to $69.3bn. Consensus has earnings per share up 159% this year and then growth halving to 28% next year — that is the deceleration the forward multiple is being paid against.
The names that actually deploy robots
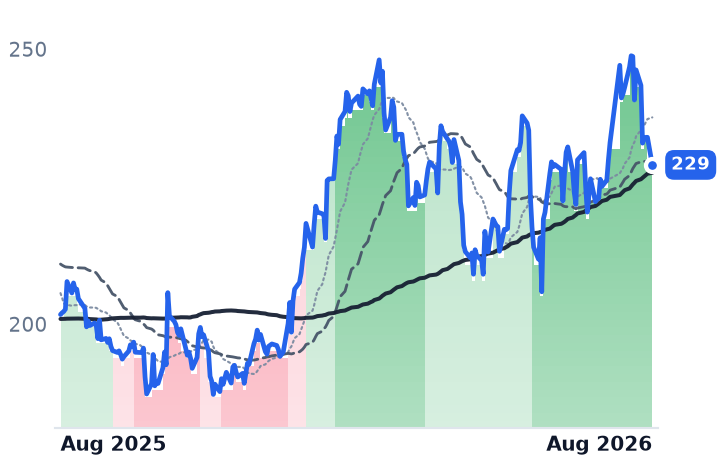
Rockwell Automation, the largest pure-play industrial-automation vendor, sells drives, sensing hardware and the Logix control software that factories standardize on. Fiscal third-quarter revenue was $2.313bn, up 10% organically. Gross margin was 49.5%, against 40.9% a year earlier. E-commerce and warehouse-automation orders grew 30%, automotive returned to double digits, and Software & Control grew 18% organically. Management raised full-year organic growth guidance by 150 basis points and lifted the earnings midpoint to $13.15.
The shares fell about 7% on the day. The reaction was read as profit-taking after a 24% run into the print, with a 12% reported decline in the Lifecycle Services consulting arm and questions about margin durability. Yet organic growth was still 8% excluding anything data-center-related, and management was explicit that there is no broad capital-spending recovery underneath. Rockwell now trades at 41.6x trailing and 33.7x forward earnings, and 10.0x forward gross profit — cheaper on both than in May, and the cheapest in this group.
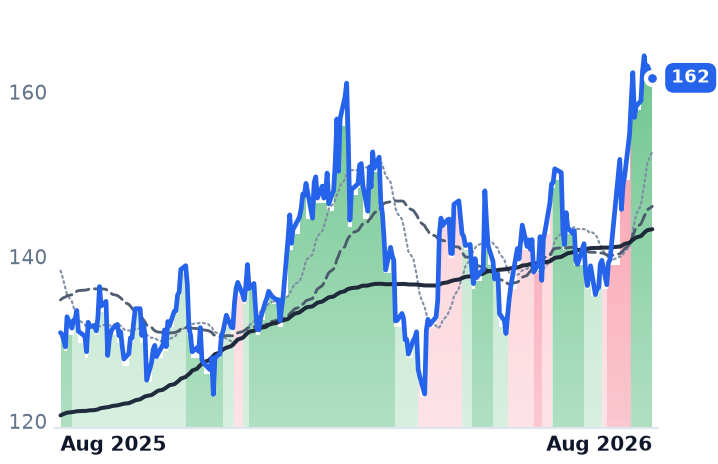
Cognex sells image-based sensors, barcode readers and vision software into electronics, automotive, packaging and logistics lines. Revenue of $291.3m grew 17%, an eighth consecutive quarter of growth, with operating margin of 29.4% against 17.4%. It raised full-year revenue to $1.13–1.15bn and lifted its semiconductor, electronics and packaging outlooks to double digits; automotive stayed flat on European weakness. It also made its OneVision artificial-intelligence platform generally available. The stock fell about 5%. Its earnings multiple has de-rated from 79x to 63.4x trailing, 44.5x forward, though price-to-gross-profit crept higher. Notably, Zebra Technologies — its closest competitor in machine vision — rose 40% over the past month against Cognex's 4%.
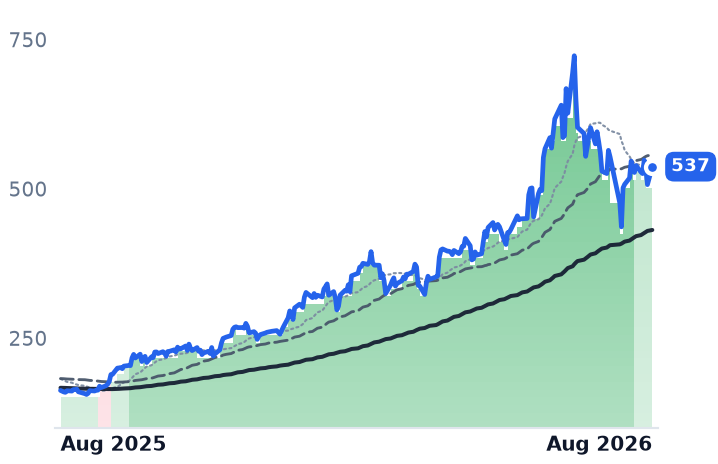
Symbotic installs complete robotic warehouse systems, overwhelmingly for Walmart. Revenue grew 22% to $720.8m, gross margin widened to 22.3% from 18.2%, and adjusted earnings before interest, taxes, depreciation and amortization roughly doubled to $95m. The stock lost 16%. Contracted backlog was flat at $22.5bn, with only about 15% converting within twelve months, and the 400-store back-of-store conversion slipped to early 2028 — and is not in backlog. Price-to-gross-profit collapsed from 72.8x in May to 47.6x. Consensus for fiscal 2028 sits below fiscal 2027.
What the shares did
The group's 9.6% month is not a trend; it is a handful of sessions. Thirteen of roughly eighty-four trading days moved more than 5%. Strip each name's two best days and the month turns negative, at −5.5%, with every member failing. Three of the four had their 50-day average cross back below the trend that had supported them since spring; Symbotic's has been below its 200-day since 21 May. The macro backdrop, meanwhile, improved: the July manufacturing index from the Institute for Supply Management read 55.6%, its highest since May 2022, with new orders expanding a seventh straight month.
The setup
Where it stands — All four businesses accelerated last quarter; the three that sell robots de-rated while the chip-test name absorbed the group's gains.
Would confirm — Rockwell's fiscal fourth-quarter organic growth printing inside its raised 7.5–9.5% guide with warehouse orders still up double digits.
Would invalidate — Symbotic's backlog falling below $22.5bn, or Rockwell's Lifecycle Services decline spreading to Intelligent Devices.
Watch next — Rockwell's fiscal fourth quarter, due early November; Symbotic's fiscal year-end report and any dated SymMicro schedule.
Valuation — Rockwell 41.6x trailing / 33.7x forward earnings, against 45.3x in May; Teradyne 60.5x / 48.1x, against 66x.