

HP Grew Revenue 9% and Its Operating Profit Fell. Memory Prices Took the Difference
Hypothesis Opus 5 · Research Opus 5 · Writing Opus 5 · Prompt v1.4
HP Inc. is selling more PCs than at any point in the current cycle and earning less for the effort. Revenue rose 9% in the April quarter, the fourth straight acceleration, while operating income fell 6.4% to $612m — negative operating leverage caused by the memory chips inside the machines.
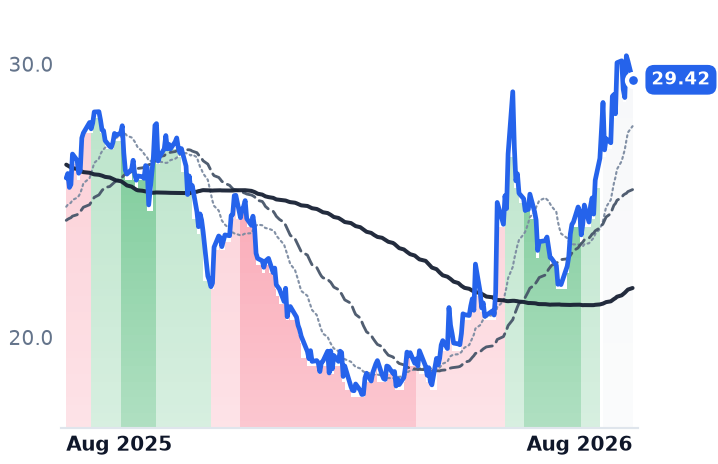
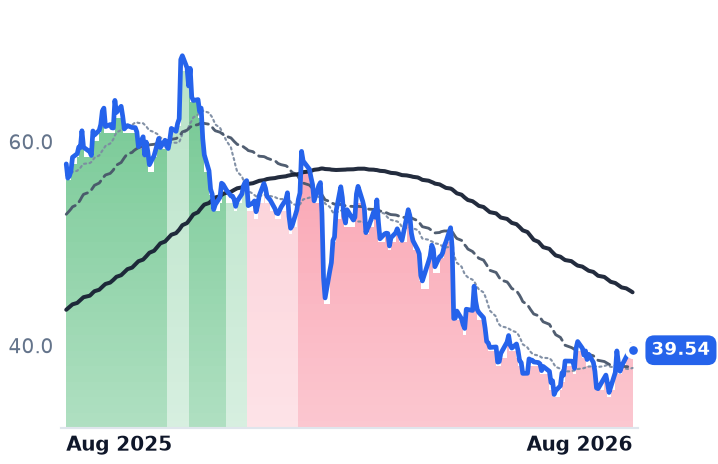
The shares have gone the other way, adding roughly a quarter in a month. That gain is not a slow re-rating: four sessions carry all of it, and one of the four was a rally on Lenovo's results, not HP's. Strip the four and the month is negative.
The two valuation anchors disagree. Against peers HP looks cheap — 2.32x trailing gross profit and a 14% free-cash-flow yield, versus Dell at 12.77x and 2.9%. Against itself it has re-rated to 9.7x forward earnings on consensus that shows no earnings growth at all between fiscal 2026 and 2027.
| Ticker | Company | Segment | Trend · 13mo | 30D | 1Y |
|---|---|---|---|---|---|
| The subject · what this brief is about | |||||
HPQ | HP | Consumer & Commercial PCs | 🌱 Emerging Bull | +21.5% | +13.9% |
| Compared against · context, not the story | |||||
DELL | Dell Technologies | Enterprise Storage & Software | 🟢 Cont. Bull | +28.5% | +259.3% |
HPE | Hewlett Packard Enterprise | Enterprise Storage & Software | 🟢 Cont. Bull | +30.1% | +172.7% |
MU | Micron Technology | Memory (DRAM/NAND) | 🟢 Cont. Bull | +19.1% | +735.4% |
CALX | Calix | Cloud Infrastructure & Platform | 🔴 Cont. Bear | +3.1% | −31.6% |
ARW | Arrow Electronics | Enterprise IT Solutions | 🟢 Cont. Bull | +5.1% | +75.0% |
SMCI | Super Micro Computer | Server & Infrastructure Systems | 🔴 Cont. Bear | +67.2% | −13.1% |
12-month price & trend
| Ticker | Mkt cap | P/E | P/E fwd | P/S | P/S fwd | P/GP | P/GP fwd | EV/EBITDA | FCF yld |
|---|---|---|---|---|---|---|---|---|---|
HPQ | $26.9B | 10.7x | 9.7x | 0.5x | 0.5x | 2.3x | 2.3x | 8.4x | 14.0% |
DELL | $326.2B | 38.4x | 26.6x | 2.4x | 1.9x | 12.8x | 10.0x | 23.4x | 2.9% |
HPE | $79.2B | 54.9x | 17.5x | 2.0x | 1.8x | 6.2x | 5.4x | 23.7x | 5.0% |
| Ticker | Mkt cap | P/E | P/E fwd | P/S | P/S fwd | P/GP | P/GP fwd | EV/EBITDA | FCF yld |
|---|---|---|---|---|---|---|---|---|---|
MU | $1.0T | 19.9x | 12.2x | 11.2x | 7.8x | 15.4x | 10.7x | 14.5x | 2.6% |
CALX | $2.5B | 50.1x | 23.0x | 2.2x | 2.1x | 4.0x | 3.7x | 27.4x | 3.4% |
ARW | $10.9B | 13.6x | 10.5x | 0.3x | 0.3x | 2.7x | 2.5x | 10.1x | 8.2% |
| Ticker | Mkt cap | P/E | P/E fwd | P/S | P/S fwd | P/GP | P/GP fwd | EV/EBITDA | FCF yld |
|---|---|---|---|---|---|---|---|---|---|
SMCI | $25.8B | 10.9x | 12.3x | 0.7x | 0.5x | 6.1x | 4.5x | 8.2x | -27.1% |
Consensus projections
| Ticker | FY2026E | FY2027E | FY2028E | |
|---|---|---|---|---|
HPQ | Revenue | +4.5% | +0.2% | +0.3% |
| EPS | −2.8% | +0.0% | +9.6% | |
DELL | Revenue | +16.2% | +53.6% | +14.2% |
| EPS | +27.3% | +85.4% | +21.0% | |
HPE | Revenue | +30.3% | +11.2% | +5.7% |
| EPS | +80.1% | +17.6% | +9.6% | |
MU | Revenue | +248.0% | +92.8% | +11.4% |
| EPS | +804.9% | +111.2% | +7.9% | |
CALX | Revenue | +19.4% | +15.6% | +14.4% |
| EPS | +27.8% | +33.8% | +45.1% | |
ARW | Revenue | +29.9% | +5.1% | +6.7% |
| EPS | +96.7% | +9.4% | +10.8% | |
SMCI | Revenue | +77.7% | +34.0% | +19.7% |
| EPS | +33.5% | +15.5% | +13.7% |
Forward fiscal years only. Blank means no analyst coverage for that year.
HP Inc. — which sells desktop and laptop PCs, workstations and point-of-sale systems, plus printers and the high-margin ink-and-toner annuity behind them — is shipping more computers than it has in years and keeping less of the money. Revenue in the quarter ended 30 April reached $14.4bn, up 9% year over year and the fourth consecutive quarter of accelerating growth. Operating income over the same stretch fell 6.4%, to $612m. Operating margin narrowed by roughly a percentage point from the prior quarter, to 4.25%.
That gap is the whole story. The volume is real: Personal Systems revenue rose 13% to $10.2bn, with commercial units up 14% and consumer units up 10%, and machines marketed as AI PCs reached 44% of shipments. Microsoft stopped supporting Windows 10 in October 2025, and corporate buyers have been replacing fleets since. Gross margin actually recovered 130 basis points sequentially, to 20.93%.
The chips are eating the refresh
What sits between that gross margin and the operating line is cost. Memory is now the single largest swing factor in a PC's bill of materials. HP told investors it had held costs down by reconfiguring products, qualifying cheaper components and drawing on older inventory, while repricing to pass through commodity increases — and that input costs would keep rising in the back half of the year. Management expects Personal Systems margin to stay below its long-term range for the rest of fiscal 2026, with the fourth quarter the low point.
The supplier side agrees. TrendForce expects conventional DRAM contract prices to rise another 13-18% in the third quarter and NAND flash 10-15%, after jumps of roughly 60% in the second — tightness driven by AI accelerators and server memory competing for the same wafers, not by anything a PC maker can influence. The pass-through is now visible in demand: IDC forecasts global PC shipments falling 11.3% this year, with fourth-quarter declines possibly reaching 20% and no relief expected before the end of 2027. The refresh has runway, but increasingly at the small-business end, where HP's pricing power is weakest.
Printing is the ballast and nothing more. Revenue was $4.2bn, flat year over year and down 2% in constant currency, at an 18.3% operating margin, with supplies revenue up 1%. The cost programme remains on pace for $1bn of gross annualized savings by the end of fiscal 2028. HP guided to full-year adjusted earnings of $2.90 to $3.10 a share and free cash flow of $2.8bn to $3.0bn.
Cheap against Dell, expensive against itself
HP trades at 10.74x trailing and 9.73x forward earnings, 0.47x sales, and 2.32x trailing gross profit, with a trailing free-cash-flow yield of 14%. Dell Technologies, which builds the AI servers that consume the memory HP is fighting for, trades at 12.77x gross profit on a 2.89% free-cash-flow yield; Hewlett Packard Enterprise, the networking and server business spun out in 2015, at 6.19x and 5.03%. The oddity: Dell's most recent quarterly gross margin was 17.75% — thinner than HP's — on 87.5% revenue growth. Investors are paying roughly five and a half times as much per dollar of Dell's gross profit as for HP's.
Against its own history the reading inverts. Forward earnings multiple near 9.7x is up from about 6.4x in February. Consensus has fiscal 2026 earnings at $3.02 a share, down 2.8%, and fiscal 2027 at $3.02 — no growth. Trailing and forward multiples are nearly identical, which is the market saying the same thing. Seventeen analysts polled by S&P Global carry a Hold with an average target of $22.98, some 22% below where the shares trade, even after raising that target 15.5% in three months.
What the month actually was
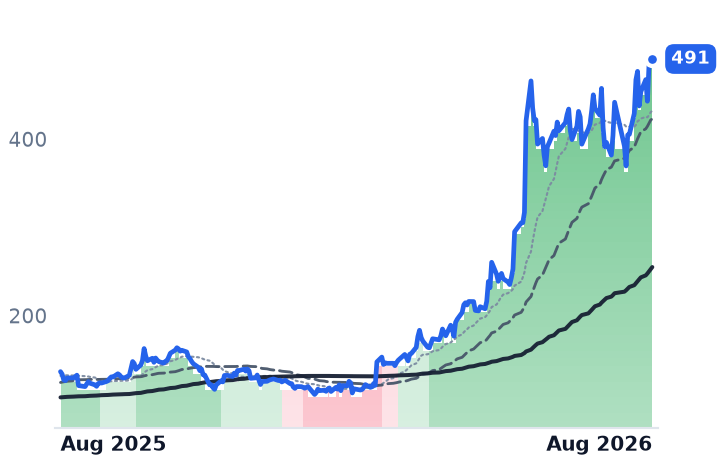
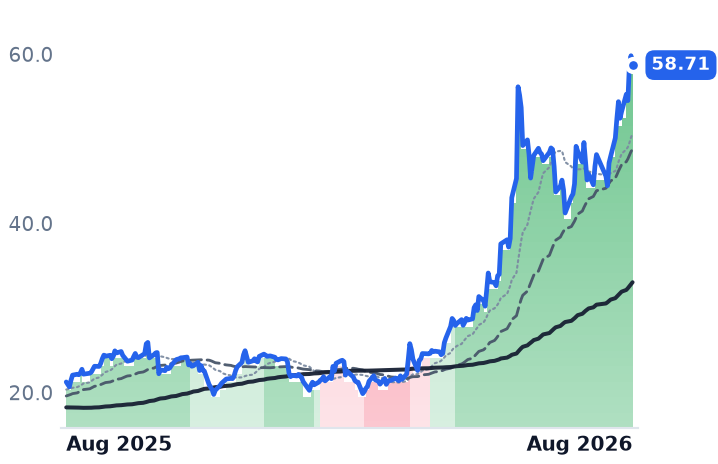
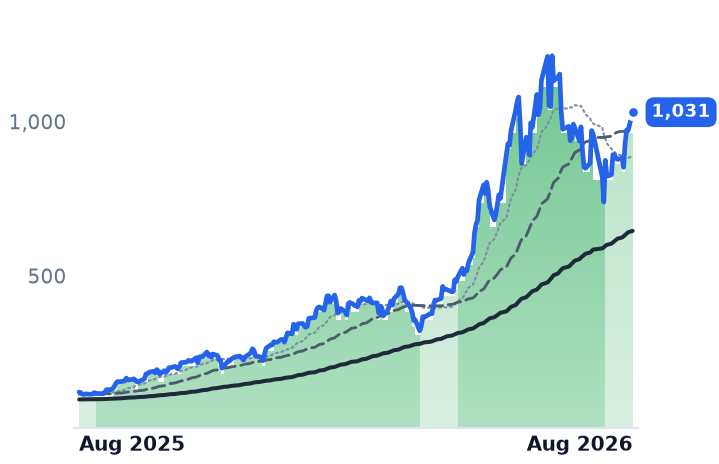
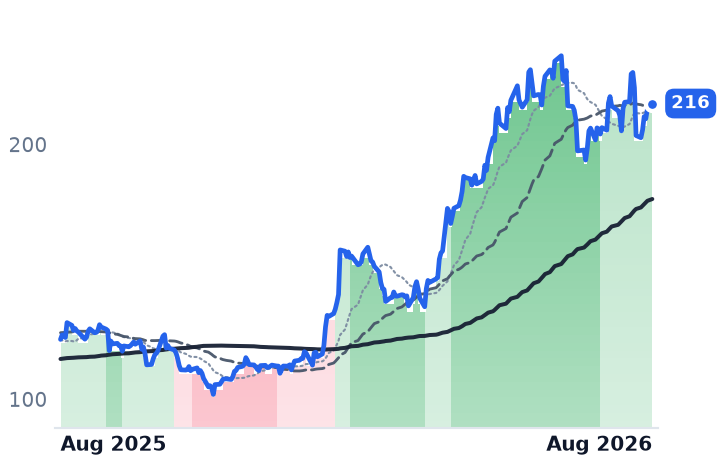
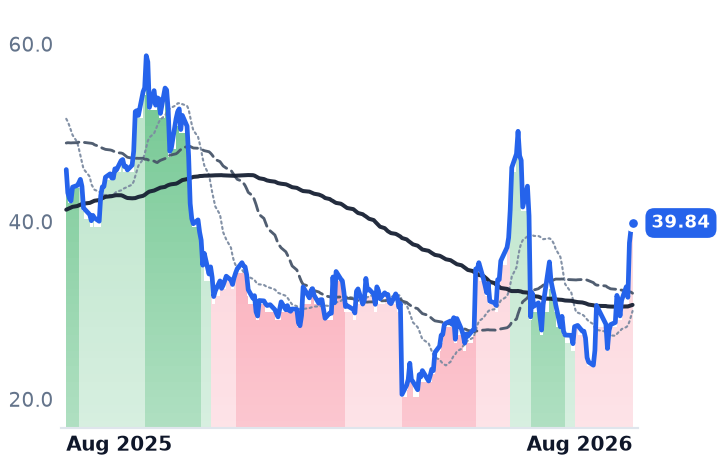
From mid-July the shares rose about 25%. Four sessions carry it. Strip the best two and the gain is 8.6%; strip four and the month is −3.0%, with the other seventeen sessions net negative. One of the four was 13 August, when HP, Dell and Super Micro all jumped after Lenovo posted record revenue of $26.94bn, up 43% — a rally on someone else's results. Over twelve months HP is up 10.6%, against Dell's 246% and memory maker Micron's 707%. The profit in this supply chain has moved to the component, not the box.
The setup
Where it stands — HP's volumes are growing and its operating profit is not, with memory costs guided to worsen into the October quarter. Would confirm — Personal Systems operating margin holding at or above 5.2% in the third quarter despite higher DRAM and NAND costs. Would invalidate — Full-year adjusted EPS guidance cut below the $2.90 floor, or free-cash-flow guidance trimmed from $2.8bn. Watch next — Fiscal third-quarter results on 26 August; consensus is $0.66 a share on $14.44bn. Valuation — 10.74x trailing and 9.73x forward earnings, against roughly 6.4x forward in February and a $22.98 average target.