

Okeanis Earned $181,000 a Day per Tanker; Consensus Has Its Profit Halving in 2027
Hypothesis Opus 5 · Research Opus 5 · Writing Opus 5 · Prompt v1.4
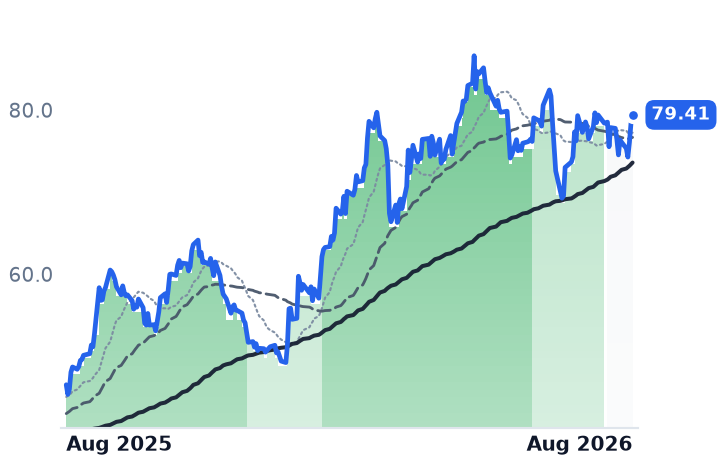
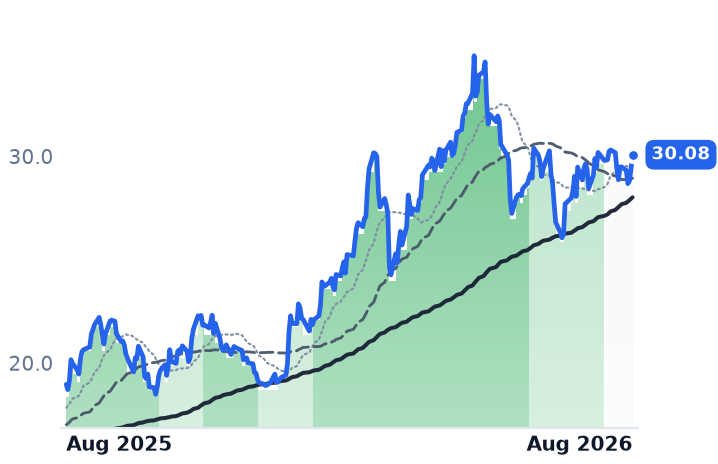
Five owners of oil and chemical tankers have roughly doubled over twelve months, and the quarter just reported explains why: with the Strait of Hormuz shut since March, ships now sail around the Cape of Good Hope, and Okeanis Eco Tankers earned $181,000 a day per vessel against costs that barely move. What is unresolved is how long the analysts who set the group's cheap-looking multiples think it lasts. The same consensus that puts Teekay Tankers at 5.25x forward earnings models its 2027 profit down 45%.
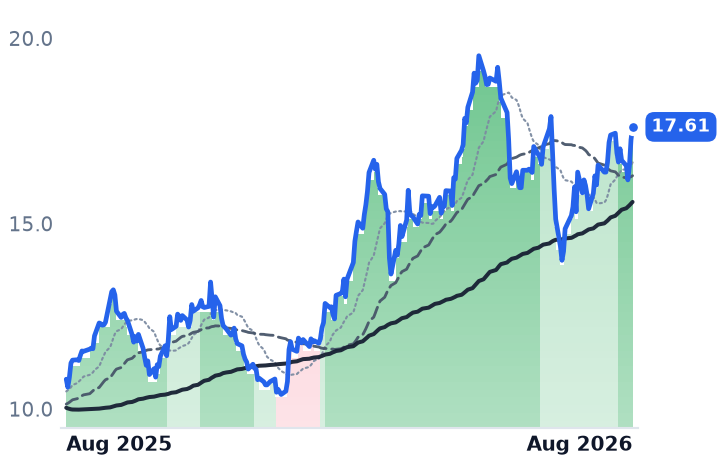
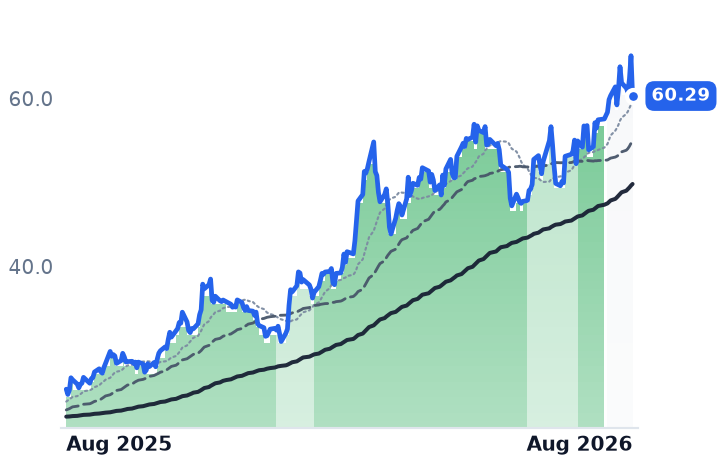
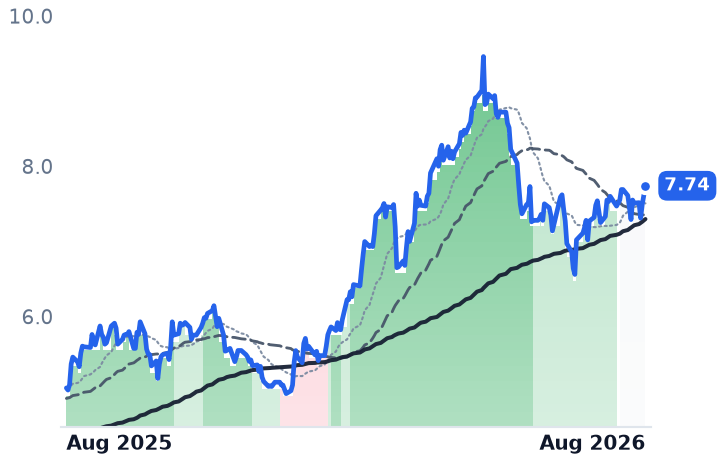
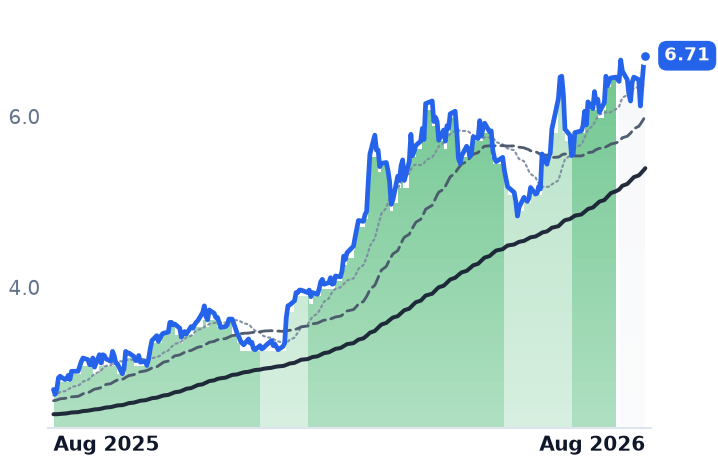
The numbers back the advance at Teekay and at Ardmore Shipping, which trades at 1.03x book value after a 68% year. Hafnia has fallen 10.5% over three months while its margins widened. Nordic American Tankers is the outlier: up 138%, 26x trailing earnings, 3.12x book and negative free cash flow.
Shipyards took 183 supertanker orders in six months.
| Ticker | Company | Segment | Trend · 13mo | 30D | 1Y |
|---|---|---|---|---|---|
| The subject · what this brief is about | |||||
ASC | Ardmore Shipping | Oil & Chemical Tankers | 🟢 Cont. Bull | +14.4% | +63.0% |
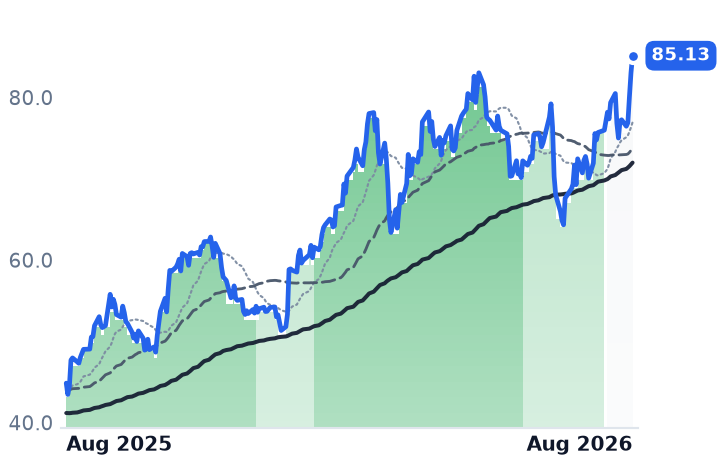
ECO | Okeanis Eco Tankers | Oil & Chemical Tankers | 🟢 Cont. Bull | +11.9% | +137.6% |
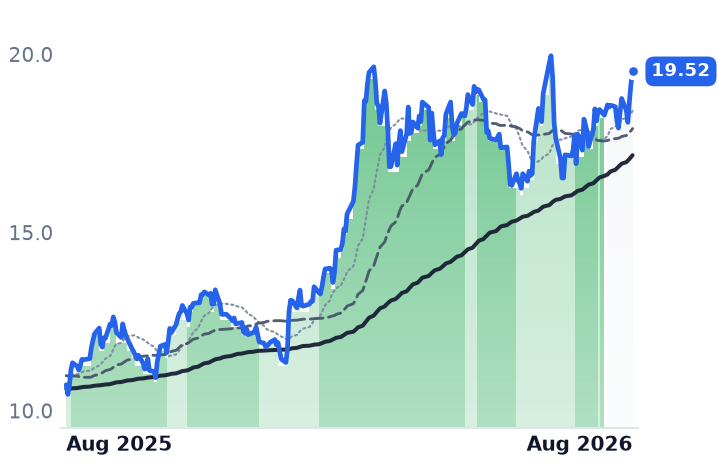
HAFN | Hafnia | Oil & Chemical Tankers | 🟢 Cont. Bull | +6.8% | +53.3% |
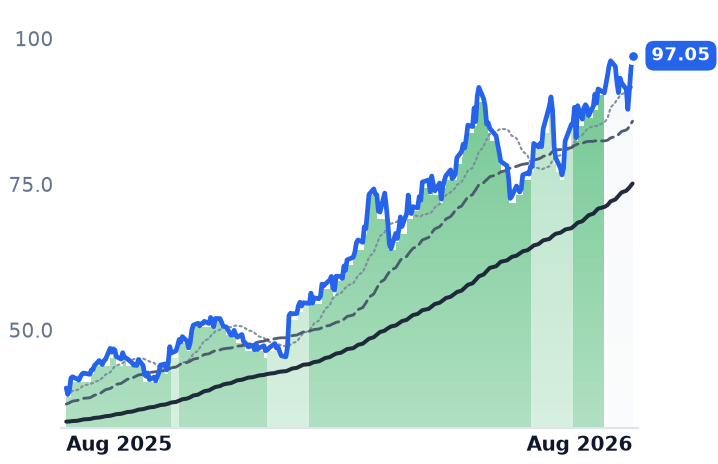
NAT | Nordic American Tankers | Oil & Chemical Tankers | 🟢 Cont. Bull | +10.9% | +139.4% |
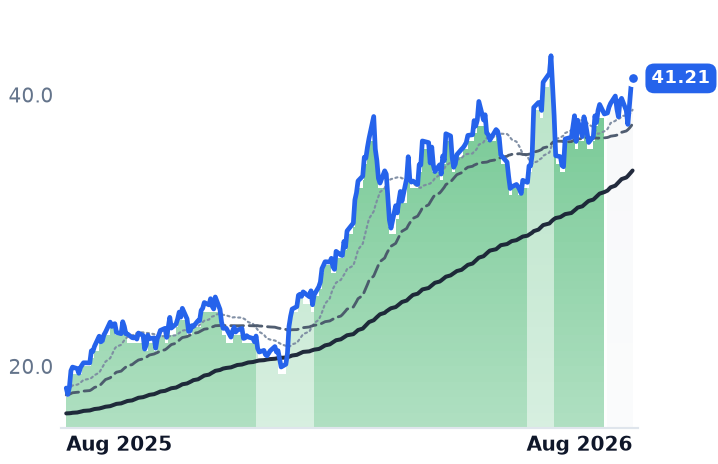
TNK | Teekay Tankers | Oil & Chemical Tankers | 🟢 Cont. Bull | +21.5% | +89.8% |
| Compared against · context, not the story | |||||
FRO | Frontline | Marine Crude & Product Tankers | 🟢 Cont. Bull | +12.9% | +124.0% |
DHT | DHT | Marine Crude & Product Tankers | 🟢 Cont. Bull | +12.1% | +81.9% |
INSW | International Seaways | Marine Crude & Product Tankers | 🟢 Cont. Bull | +11.9% | +142.4% |
STNG | Scorpio Tankers | Marine Crude & Product Tankers | 🟢 Cont. Bull | +3.8% | +70.7% |
TRMD | TORM | Marine Crude & Product Tankers | 🟢 Cont. Bull | +5.7% | +58.6% |
12-month price & trend
| Ticker | Mkt cap | P/E | P/E fwd | P/S | P/S fwd | P/GP | P/GP fwd | EV/EBITDA | FCF yld |
|---|---|---|---|---|---|---|---|---|---|
ASC | $718.5M | 6.8x | 6.1x | 2.0x | 2.7x | 5.2x | 7.1x | 4.8x | 1.9% |
ECO | $2.0B | 5.6x | 4.3x | 3.2x | 2.8x | 4.9x | 4.2x | 5.7x | 1.9% |
HAFN | $3.9B | 8.4x | 5.7x | 1.6x | 3.1x | 7.8x | 15.1x | 6.7x | 11.4% |
| Ticker | Mkt cap | P/E | P/E fwd | P/S | P/S fwd | P/GP | P/GP fwd | EV/EBITDA | FCF yld |
|---|---|---|---|---|---|---|---|---|---|
NAT | $1.4B | 26.0x | 9.8x | 4.3x | 4.6x | 14.6x | 15.7x | 11.7x | -6.0% |
TNK | $2.9B | 5.0x | 5.3x | 2.6x | 2.9x | 6.0x | 6.8x | 3.3x | 12.4% |
FRO | $8.2B | 21.5x | 5.6x | 4.2x | 3.9x | 12.7x | 12.0x | 11.6x | 8.2% |
| Ticker | Mkt cap | P/E | P/E fwd | P/S | P/S fwd | P/GP | P/GP fwd | EV/EBITDA | FCF yld |
|---|---|---|---|---|---|---|---|---|---|
DHT | $2.8B | 8.6x | 6.0x | 5.0x | 4.2x | 10.6x | 8.8x | 7.2x | -4.6% |
INSW | $4.2B | 7.7x | 6.9x | 4.2x | 3.5x | 7.7x | 6.4x | 6.5x | 2.9% |
STNG | $4.3B | 7.7x | 6.5x | 4.1x | 3.6x | 7.9x | 6.9x | 6.5x | 11.2% |
| Ticker | Mkt cap | P/E | P/E fwd | P/S | P/S fwd | P/GP | P/GP fwd | EV/EBITDA | FCF yld |
|---|---|---|---|---|---|---|---|---|---|
TRMD | $3.3B | 9.7x | 4.5x | 2.4x | 2.3x | 5.9x | 5.7x | 6.7x | 2.4% |
Consensus projections
| Ticker | FY2026E | FY2027E | FY2028E | |
|---|---|---|---|---|
ASC | Revenue | +34.2% | −30.1% | +0.4% |
| EPS | +184.0% | −42.5% | −32.1% | |
ECO | Revenue | +167.2% | −43.9% | −7.3% |
| EPS | +285.0% | −58.8% | −10.2% | |
HAFN | Revenue | +27.0% | −21.7% | −13.5% |
| EPS | +100.9% | −36.0% | −31.7% | |
NAT | Revenue | +57.6% | −23.3% | −20.8% |
| EPS | +510.4% | −55.8% | −63.7% | |
TNK | Revenue | +61.5% | −32.4% | −13.4% |
| EPS | +137.7% | −45.5% | −13.7% | |
FRO | Revenue | +66.6% | −25.9% | −8.0% |
| EPS | +263.1% | −48.1% | −16.9% | |
DHT | Revenue | +85.5% | −24.2% | −6.3% |
| EPS | +187.1% | −37.8% | −9.5% | |
INSW | Revenue | +46.7% | −24.4% | −7.8% |
| EPS | +136.4% | −46.3% | −5.7% | |
STNG | Revenue | +31.6% | −24.9% | −2.2% |
| EPS | +133.7% | −47.7% | −5.7% | |
TRMD | Revenue | +55.7% | −29.8% | −14.8% |
| EPS | +165.5% | −48.5% | −38.2% |
Forward fiscal years only. Blank means no analyst coverage for that year.
The detour that pays
The Strait of Hormuz, the channel through which about a fifth of the world's oil normally passes, has been closed to shipping aligned with the United States and Israel since early March. The International Energy Agency has called it the largest disruption in the history of the global oil market. A renewed naval blockade took effect on 14 July. Cargoes that once crossed the Gulf now go around the Cape of Good Hope, a detour of roughly 3,800 nautical miles that ties up each ship for an extra 10 to 14 days.
Tanker owners are paid a rate per day, not a price per barrel. Take ships out of circulation and the daily rate goes vertical. Very large crude carriers loading in the Middle East for Asia fixed at close to $500,000 a day in July, against a normal range of $20,000 to $60,000. Lloyd's List described the year as the second-best tanker boom in history.
The accounts caught up fast
Okeanis Eco Tankers, a Piraeus-based owner of modern supertankers and Suezmaxes that runs its whole fleet on the spot market with 14 employees, reported second-quarter revenue of $318.9m, up 239% from a year earlier. Gross margin was 76.7%. Its fleet averaged $181,000 a day at 99% utilization, and it paid a record $5.25 per share dividend, its seventeenth consecutive. First-half distributions came to 90% of net income.
Teekay Tankers, a Bermuda-based operator of roughly 48 crude and product carriers, grew revenue 63% to $379.5m and lifted operating margin to 50.0% from 23.6%. It generated about $200m of free cash flow in the quarter against a cash breakeven near $9,700 a day, and holds more than $1.2bn in cash with no debt. It nonetheless held its quarterly dividend at $0.25 a share, telling investors it was intensifying capital-allocation discussions with its board.
Ardmore Shipping, which moves refined products and chemicals on mid-size vessels for oil majors and traders, grew revenue 61% to $116.2m and widened gross margin to 47.8% from 23.0%. Its medium-range tankers earned $51,900 a day against an operating breakeven of $10,800. Management put its leverage plainly: every $10,000 a day of extra rate is worth about $2 a share of annual earnings.
What the cheap multiple is struck on
Teekay trades at 5.00x trailing and 5.25x forward earnings, 1.25x book and a 12.4% trailing free-cash-flow yield. The forward multiple sitting above the trailing one is the tell: the market is pricing no further growth. Consensus agrees emphatically, modeling Teekay's earnings per share falling from $16.20 this year to $8.84 next, a 45% drop that puts the shares nearer 9.6x. The same fade is embedded everywhere — down 59% at Okeanis, 43% at Ardmore, 36% at Hafnia. On 2027 numbers the group is a 10x business, not a 5x one.
Ardmore is the one name where the asset test is clean: 1.03x book value, essentially the steel, after a 68% twelve-month gain. Okeanis is the inverse — the cheapest earnings multiple at 4.35x forward, on the second-richest asset multiple at 2.67x book and a 1.9% free-cash-flow yield, because it pays nearly everything out.
Nordic American Tankers, which owns 24 Suezmax crude carriers, is the clear outlier and the one name whose price has run past its accounts. It is up 138% over twelve months, the biggest gain of the five, and trades at 26.0x trailing earnings, 3.12x book and a negative 6.0% trailing free-cash-flow yield. On 2027 consensus of $0.30 a share, that is 22x.
Hafnia diverges the other way. The largest of the five by market value, running about 200 product tankers plus pools and technical management, it has fallen 10.5% over three months while its first-quarter operating margin widened to 22.4% from 13.8% and net income rose 184%. It trades at 5.68x forward against 8.41x trailing, the widest compression in the group, on an 11.4% free-cash-flow yield. Its second-quarter figures are not yet in the data.
The supply answer is not the same for both trades
The orderbook argument that supported crude tankers a year ago has inverted. Vessels on order have climbed to about 27% of the operational crude fleet, from an average near 15% in May 2025. Shipyards took 183 supertanker contracts in the first half of 2026 against 18 a year earlier, and roughly 83% of those deliver in 2028 and 2029. Okeanis' own management calls a 32% orderbook a genuine medium-term supply consideration. And the below-asset-value defence is weaker than it looks, because asset values are themselves peaked: a five-year-old supertanker now costs about $9m more than ordering a new one.
Product tankers, where Ardmore and Hafnia sit, are tighter. Ardmore puts the medium-range orderbook at 16% of a fleet averaging 14 years old, and the smaller Handysize book at 6% against an 18-year average age.
The month was four days
Strip the calendar and the recent advance thins out. Across the 22 sessions to 14 August, the five names' equal-weighted daily returns sum to +9.5%, of which two Hormuz headline sessions — 21 July and 13 August — supplied 7.8 points. Four sessions carry the whole month. One apparent drop is not one at all: Okeanis fell 5.7% on 14 August because that was the ex-dividend date for its $5.25 payout. And the rate premium hangs on diplomacy: Iran and Oman failed to agree on reopening the strait in mid-August after a week of optimism.
The setup
Where it stands — Record daily rates from a closed strait have produced the best quarter these owners have ever reported, on multiples struck against peak-year earnings.
Would confirm — Third-quarter realized rates landing at or above the days already booked: $105,000 for Teekay's Suezmaxes, $207,000 for Okeanis' supertankers.
Would invalidate — A negotiated reopening of Hormuz returning Gulf-to-Asia voyages to direct routing, which removes the extra 3,800 nautical miles of demand.
Watch next — Hafnia's delayed second-quarter results, the only member whose exposure to the rate spike is still unreported.
Valuation — Group at 4.35x-6.08x forward earnings on 2026 consensus, near 10x on 2027; Nordic American at 26x trailing and 3.12x book.