

Salesforce's Growth Accelerated for Three Quarters as Its Shares Lost 16% in a Year
Hypothesis Opus 5 · Research Opus 5 · Writing Opus 5 · Prompt v1.4
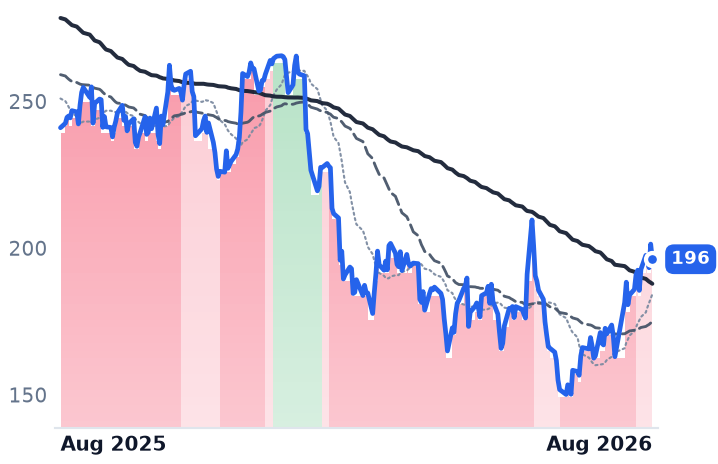
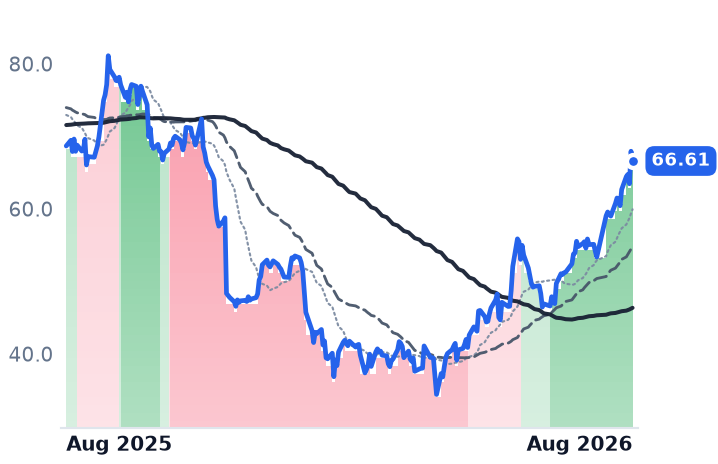
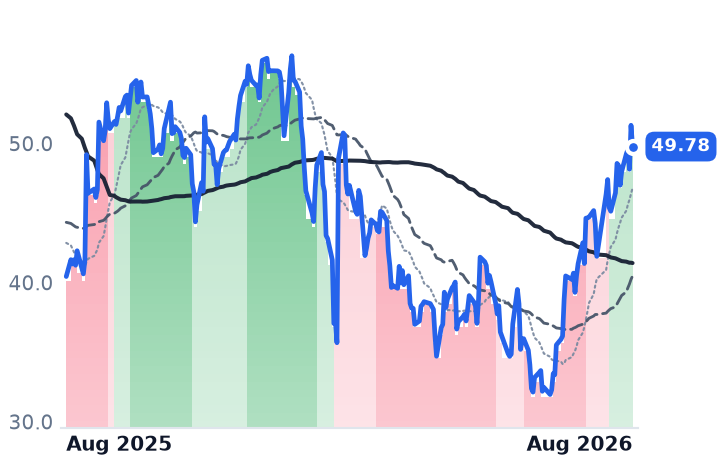
Salesforce is the company the market has spent a year pricing as the first casualty of AI agents that could replace software seats. The business has been moving the other way: revenue growth accelerated three quarters running, from 8.6% to 13.3%, operating margin widened to 21.8%, and the company retired a tenth of its shares. Its 50-day average has still sat below its 200-day since 23 January.
It trades at 13.86x forward earnings against 22.63x trailing, and carries the highest free-cash-flow yield of the nine enterprise-software names looked at here. JFrog, whose software-artifact repository posted the group's best quarter, is the mirror image: 28.7% growth and 121% net retention, but a multiple that expanded 85% in fifteen weeks to 23.64x forward gross profit, more than five times Salesforce's. Salesforce reports on 26 August.
| Ticker | Company | Segment | Trend · 13mo | 30D | 1Y |
|---|---|---|---|---|---|
| The subject · what this brief is about | |||||
CRM | Salesforce | Customer Experience & CRM | 🔴 Cont. Bear | +13.6% | −18.6% |
FROG | JFrog | Developer Tools & DevOps | 🟢 Cont. Bull | +11.1% | +113.2% |
TEAM | Atlassian | Developer Tools & DevOps | 🔴 Cont. Bear | +75.6% | −2.9% |
VEEV | Veeva Systems | Life Sciences Software & Data | 🌱 Emerging Bull | +23.5% | −13.1% |
NTNX | Nutanix | Cloud Infrastructure & Platforms | 🌱 Emerging Bull | +19.3% | −3.0% |
DT | Dynatrace | Other | 🌱 Emerging Bull | +9.6% | +1.9% |
IOT | Samsara | IoT & Connected Operations | 🌱 Emerging Bull | +6.2% | +18.7% |
TWLO | Twilio | Communications & Messaging Platforms | 🟢 Cont. Bull | +15.2% | +125.4% |
BILL | Bill.com | Fintech & Digital Finance | ⚠️ Emerging Bear | +11.5% | +23.1% |
| Compared against · context, not the story | |||||
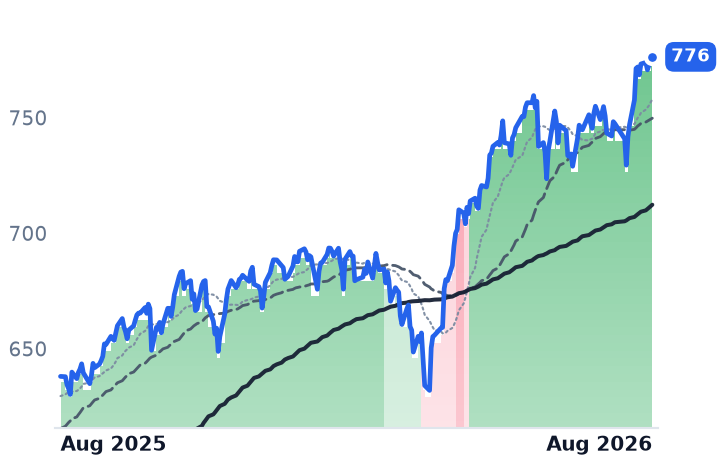
SPY | State Street SPDR S&P 500 ETF Trust | Asset Management | 🟢 Cont. Bull | +3.4% | +21.7% |
12-month price & trend
| Ticker | Mkt cap | P/E | P/E fwd | P/S | P/S fwd | P/GP | P/GP fwd | EV/EBITDA | FCF yld |
|---|---|---|---|---|---|---|---|---|---|
CRM | $160.7B | 22.6x | 13.9x | 3.8x | 3.5x | 4.8x | 4.5x | 13.8x | 9.1% |
FROG | $11.6B | n/m | 100.8x | 19.4x | 18.4x | 24.9x | 23.6x | n/m | 1.5% |
TEAM | $42.6B | n/m | 26.7x | 6.5x | 5.8x | 7.6x | 6.8x | 282.1x | 3.1% |
| Ticker | Mkt cap | P/E | P/E fwd | P/S | P/S fwd | P/GP | P/GP fwd | EV/EBITDA | FCF yld |
|---|---|---|---|---|---|---|---|---|---|
VEEV | $39.6B | 42.3x | 26.9x | 11.9x | 10.9x | 15.9x | 14.5x | 29.1x | 4.2% |
NTNX | $18.0B | 65.3x | 30.4x | 6.5x | 5.6x | 7.5x | 6.5x | 53.3x | 4.3% |
DT | $14.3B | 96.6x | 24.8x | 6.8x | 6.2x | 8.4x | 7.6x | 43.9x | 4.0% |
| Ticker | Mkt cap | P/E | P/E fwd | P/S | P/S fwd | P/GP | P/GP fwd | EV/EBITDA | FCF yld |
|---|---|---|---|---|---|---|---|---|---|
IOT | $23.0B | 389.3x | 55.9x | 13.3x | 11.4x | 17.4x | 15.0x | 234.7x | 1.0% |
TWLO | $36.2B | 31.7x | 41.7x | 6.5x | 6.2x | 13.4x | 12.8x | 99.3x | 3.1% |
BILL | $5.0B | n/m | 14.8x | 3.1x | 2.7x | 3.8x | 3.3x | 42.8x | 7.7% |
| Ticker | Mkt cap | P/E | P/E fwd | P/S | P/S fwd | P/GP | P/GP fwd | EV/EBITDA | FCF yld |
|---|---|---|---|---|---|---|---|---|---|
SPY | $773.0B | — | — | — | — | — | — | — | — |
Consensus projections
| Ticker | FY2026E | FY2027E | FY2028E | |
|---|---|---|---|---|
CRM | Revenue | +9.3% | +11.1% | +9.4% |
| EPS | +17.4% | +20.2% | +10.4% | |
FROG | Revenue | +20.6% | +17.5% | +19.4% |
| EPS | +20.4% | +17.6% | +27.4% | |
TEAM | Revenue | +24.7% | +13.4% | +15.9% |
| EPS | +55.5% | +10.5% | +18.0% | |
VEEV | Revenue | +16.3% | +15.1% | +12.0% |
| EPS | +22.7% | +14.1% | +10.7% | |
NTNX | Revenue | +12.1% | +12.8% | +12.5% |
| EPS | +10.9% | +13.6% | +16.3% | |
DT | Revenue | +18.9% | +15.5% | +14.8% |
| EPS | +22.8% | +17.7% | +15.3% | |
IOT | Revenue | +28.9% | +25.9% | +19.7% |
| EPS | +129.2% | +40.4% | +27.9% | |
TWLO | Revenue | +16.0% | +10.1% | +10.4% |
| EPS | +19.1% | +16.3% | +15.7% | |
BILL | Revenue | +13.2% | +12.2% | +12.0% |
| EPS | +26.0% | +27.2% | +20.5% |
Forward fiscal years only. Blank means no analyst coverage for that year.
Salesforce, whose cloud software runs the sales pipelines, service desks and marketing campaigns of much of corporate America, is growing faster than it was a year ago. Revenue in the April quarter rose 13.3% to $11.13bn — the third consecutive quarter of acceleration, from 8.6% in the October quarter and 12.1% in January. Operating margin widened to 21.8% from 19.8%, which turned that revenue growth into a 25% gain in operating income. The company also retired roughly a tenth of itself: diluted shares fell from 970m to 871m over twelve months.
The share price has said something else entirely. Salesforce's 50-day average has been below its 200-day every session since 23 January — 145 trading days, including an unbroken stretch from late January to June — and the stock is down 15.9% over twelve months, sitting about 27% below its high near $269.
What the market is arguing
The bear case is structural rather than financial. Salesforce bills largely by the seat, and the fear that AI agents will do the work those seats pay for has taken roughly $2 trillion out of software-sector value since early 2026. Salesforce is a system of engagement, not infrastructure — the layer where humans type, which is precisely the layer an agent can bypass. Klarna's public abandonment of Salesforce for an AI-assembled stack gave the argument a name to point at.
The company's answer is that it sells the agents too. Agentforce and its Data 360 platform reached about $1.4bn of combined annual recurring revenue, up 114%, across more than 9,500 paid deals, against current remaining performance obligations of $29.4bn, up 11%. Salesforce is now pushing a flat-rate "Agentic Enterprise License Agreement" that removes per-consumption friction — read by bulls as land-then-expand and by bears as capping the monetisation.
On price, the stock is the second-cheapest of the nine on forward price per dollar of gross profit at 4.49x, behind only BILL, the accounts-payable automation vendor, at 3.32x. It trades at 13.86x forward earnings against 22.63x trailing, and its 9.12% trailing free-cash-flow yield is the highest of the group. Notably, that multiple has barely moved: 4.60x price-to-gross-profit in early May, 4.83x now, while gross profit grew 13.2%. The year's price damage was done before this spring; the recovery since has been earned by the numbers rather than paid for by a re-rating. JPMorgan initiated coverage on 13 August with an Overweight rating and a $250 target, calling the disruption fear overblown.
The honest caveat is that consensus already discounts the acceleration: analysts model FY2028 revenue growth of 9.4% and earnings growth of 10.4%, slower than what the company is doing now. The 26 August second-quarter report is the test, and UBS has warned the bar is high after the recent bounce.
JFrog: the best quarter, the worst price
JFrog runs Artifactory, the repository where enterprises store and version every binary, container and package that passes through a software build pipeline — plumbing an AI coding assistant needs rather than replaces. Its June quarter was the strongest in the group: revenue up 28.7% to $163.8m and accelerating, cloud revenue up 53% to a majority of the mix, net dollar retention of 121%, remaining performance obligations up 38% to $659m, and full-year guidance raised to $648–652m. Customers spending over $1m a year grew to 97 from 61.
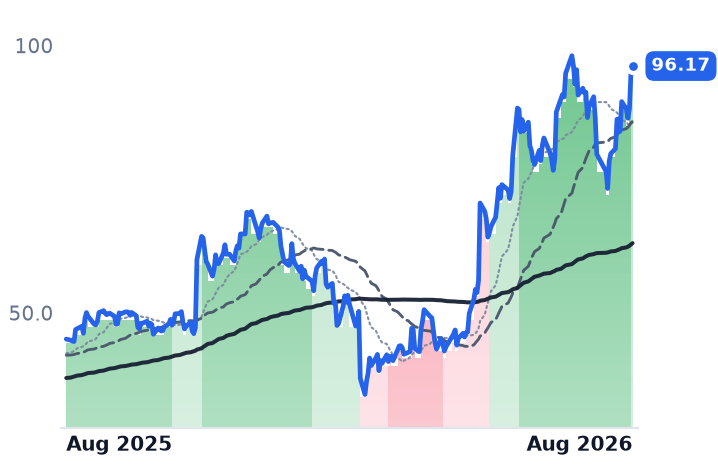
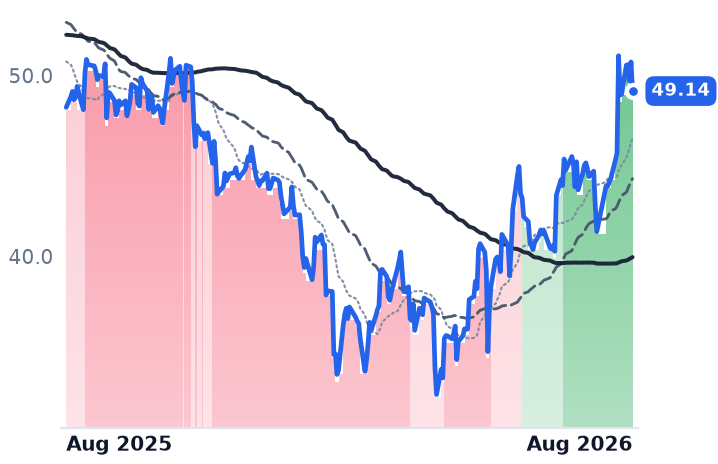
And the shares have run past all of it. Price per dollar of trailing gross profit has gone from 13.50x in early May to 21.21x in late July to 24.93x now — an 85% expansion in fifteen weeks that took market value from $5.51bn to $11.65bn. At 23.64x forward gross profit, JFrog is dearer than the next-most-expensive name, fleet-tracking vendor Samsara at 14.98x, by more than half again, and more than five times Salesforce. It is still loss-making on a reported basis, carries a 1.46% free-cash-flow yield, and issued 5.7% more shares over the year — the exact opposite of Salesforce's buyback. Management also notes that 47% of revenue is still on-premises and grew only 9%.
One mechanical point worth clearing: JFrog's trend signal stepped down on 13 August, a session in which the stock rose 7.9%. That is a lagging average catching up, not weakness; the shares sit 3.1% below their 52-week high.
The month was three days and two names
The nine names returned 21.1% on average over thirty days. Strip out Atlassian and Veeva and that falls to 12.4%; Atlassian alone accounts for two-fifths of it. Three sessions — 28 July, 7 August and 13 August — compound to more than the entire month, meaning the other eighteen were net negative. The 28 July move was a rotation out of chipmakers into oversold enterprise software, not news.
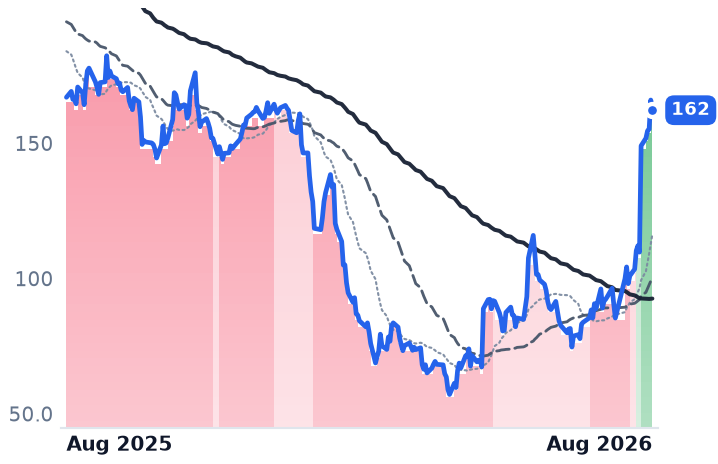
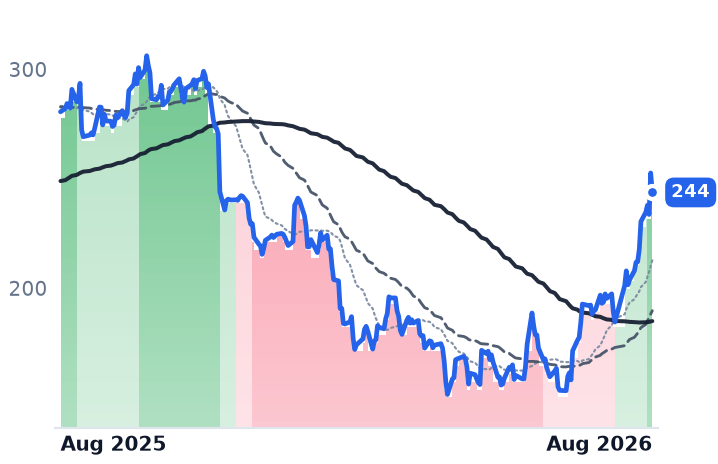
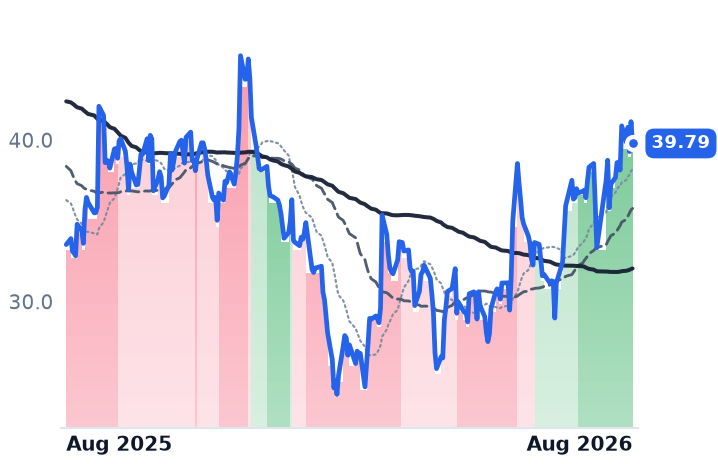
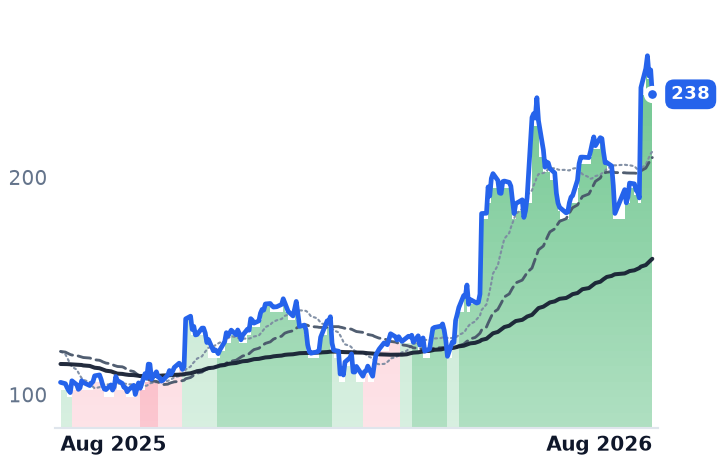
The leaders are uneven. Atlassian, which sells the Jira and Confluence project-tracking tools, grew 28% in its June quarter and beat consensus — then guided to 13% growth for the coming year, half what it just delivered, and rose 35% anyway. Veeva, which sells clinical-trial and commercial software to drugmakers, gained 25.9% without reporting at all. Nutanix, in private-cloud infrastructure, gained 22% while revenue growth decelerated to 10.0% and it announced a cut of about 5% of staff on 4 August. Twilio, the messaging-API provider, raised organic growth guidance to 13–13.5%, but its 48.4% gross margin means it is the group's third-dearest name once you price gross profit rather than sales. Dynatrace, in application monitoring, is the steady one: recurring revenue up 17%, a 29% adjusted operating margin, $275m of buybacks in a quarter. Samsara grew fastest of all at 30.5% and earns almost nothing on it, at a 1.5% reported operating margin.
Ranked by cash generated per dollar of price, the order inverts the ranking by share-price performance: Salesforce first at 9.12%, BILL second, Samsara and JFrog last.
The setup
Where it stands — Salesforce's growth and margins have improved for three quarters while its shares have traded below trend since January. Would confirm — Second-quarter revenue growth on 26 August holding at or above 13%, with current remaining performance obligations still growing double digits. Would invalidate — Growth falling back below 11%, or full-year guidance trimmed, which would make the year-long derating earned. Watch next — Salesforce fiscal second-quarter results, 26 August 2026. Valuation — 13.86x forward earnings against 22.63x trailing; 4.49x forward gross profit, versus JFrog's 23.64x and BILL's 3.32x.