

Dell Absorbed the Memory Price Spike That Celestica and Flex Passed Along
Hypothesis Opus 5 · Research Opus 5 · Writing Opus 5 · Prompt v1.4
The standard story about the AI server supply chain says the branded seller — the one holding the customer, the financing and the service contract — has the pricing power, and the contract assemblers behind it absorb whatever component costs do. Last quarter it ran backwards.
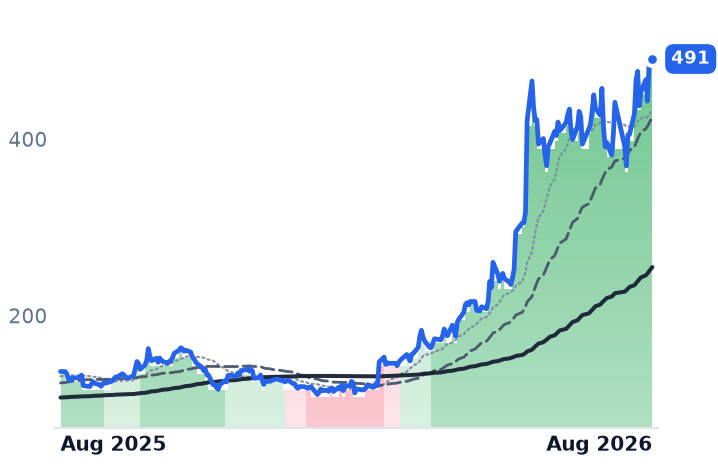
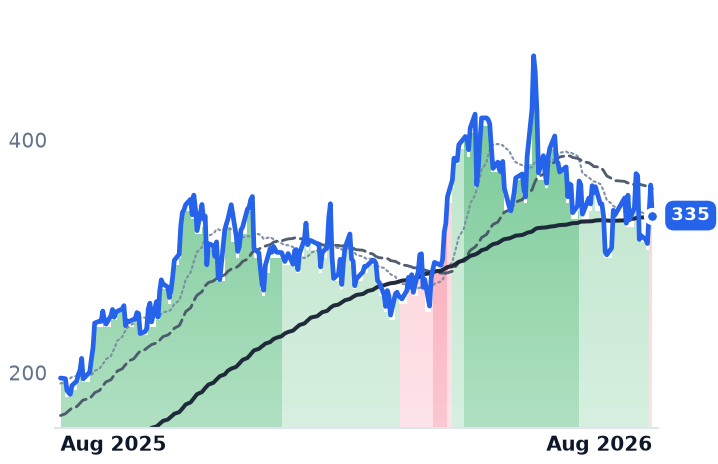
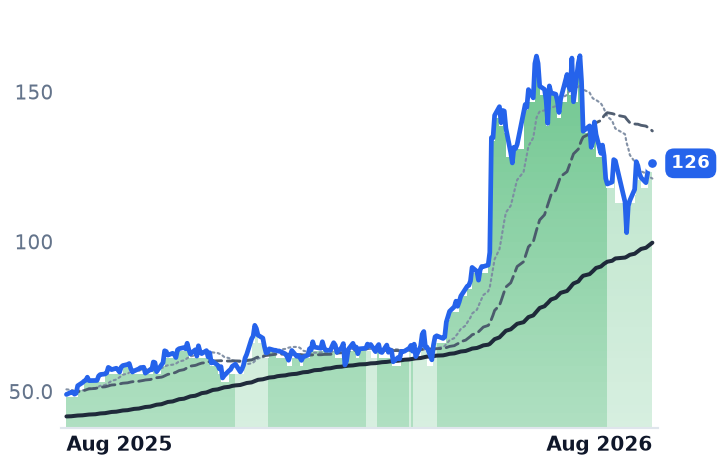
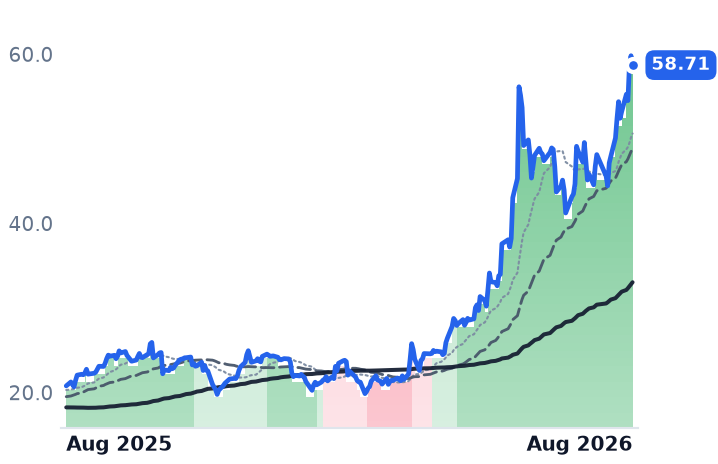
Dell's gross margin fell 337 basis points to 17.75% as memory prices roughly doubled; its profits grew anyway, on volume. Celestica's gross margin slipped 53 basis points and Flex's rose 72. Yet since mid-May Dell has doubled while both contract manufacturers have fallen, each after beating estimates and raising full-year guidance.
The reason is cash, not orders. Celestica sold $3bn of stock to fund capacity and fell 14.8% the next session; Flex turned $534m of adjusted operating profit into $41m of free cash flow. Dell now trades at 12.77x trailing gross profit, up from 6.99x in May.
| Ticker | Company | Segment | Trend · 13mo | 30D | 1Y |
|---|---|---|---|---|---|
| The subject · what this brief is about | |||||
DELL | Dell Technologies | Enterprise Storage & Software | 🟢 Cont. Bull | +25.4% | +258.9% |
CLS | Celestica | Electronic Manufacturing Services | 🟢 Cont. Bull | +10.3% | +71.4% |
FLEX | Flex | Electronic Manufacturing Services | 🟢 Cont. Bull | +4.2% | +157.5% |
| Compared against · context, not the story | |||||
SMCI | Super Micro Computer | Server & Infrastructure Systems | 🔴 Cont. Bear | +61.4% | −12.2% |
HPE | Hewlett Packard Enterprise | Enterprise Storage & Software | 🟢 Cont. Bull | +30.1% | +182.4% |
GOOGL | Alphabet | Search & Advertising | 🟢 Cont. Bull | −2.4% | +69.6% |
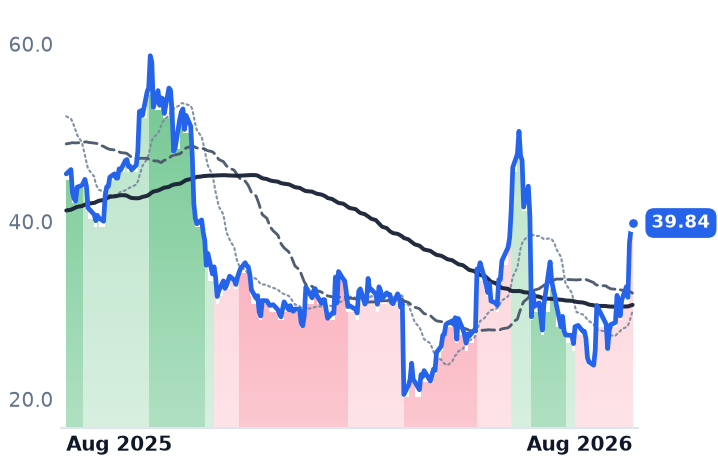
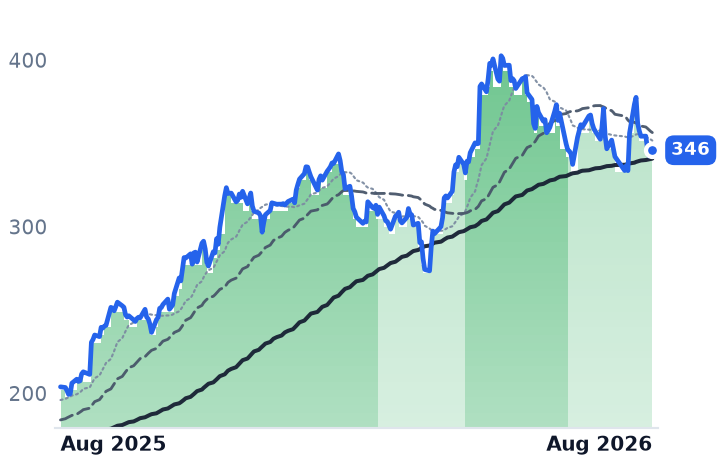
12-month price & trend
| Ticker | Mkt cap | P/E | P/E fwd | P/S | P/S fwd | P/GP | P/GP fwd | EV/EBITDA | FCF yld |
|---|---|---|---|---|---|---|---|---|---|
DELL | $326.2B | 38.4x | 26.6x | 2.4x | 1.9x | 12.8x | 10.0x | 23.4x | 2.9% |
CLS | $38.5B | 34.5x | 29.5x | 2.5x | 1.9x | 21.3x | 16.2x | 25.7x | 1.3% |
FLEX | $46.6B | 48.7x | 26.9x | 1.6x | 1.3x | 16.8x | 14.2x | 26.1x | 2.3% |
| Ticker | Mkt cap | P/E | P/E fwd | P/S | P/S fwd | P/GP | P/GP fwd | EV/EBITDA | FCF yld |
|---|---|---|---|---|---|---|---|---|---|
SMCI | $25.8B | 10.9x | 12.3x | 0.7x | 0.5x | 6.1x | 4.5x | 8.2x | -27.1% |
HPE | $79.2B | 54.9x | 17.5x | 2.0x | 1.8x | 6.2x | 5.4x | 23.7x | 5.0% |
GOOGL | $4.2T | 17.2x | 17.1x | 9.4x | 8.5x | 15.4x | 13.9x | 13.0x | 1.3% |
Consensus projections
| Ticker | FY2026E | FY2027E | FY2028E | |
|---|---|---|---|---|
DELL | Revenue | +16.2% | +53.6% | +14.2% |
| EPS | +27.3% | +85.4% | +21.0% | |
CLS | Revenue | +67.0% | +69.3% | +32.3% |
| EPS | +90.2% | +74.7% | +34.3% | |
FLEX | Revenue | +6.8% | +26.3% | +30.0% |
| EPS | +24.2% | +44.7% | +51.5% | |
SMCI | Revenue | +77.7% | +34.0% | +19.7% |
| EPS | +33.5% | +15.5% | +13.7% | |
HPE | Revenue | +30.3% | +11.2% | +5.7% |
| EPS | +80.1% | +17.6% | +9.6% | |
GOOGL | Revenue | +23.7% | +22.5% | +19.0% |
| EPS | +90.3% | −25.8% | +18.1% |
Forward fiscal years only. Blank means no analyst coverage for that year.
The contract price of conventional computer memory rose 90% to 95% in the first quarter of this year, with another 58% to 63% expected in the second, as memory makers steered capacity toward high-bandwidth memory for artificial-intelligence accelerators, which carries margins three to five times higher. Someone in the server supply chain has to absorb that. The conventional answer is that the branded manufacturer passes it to the customer, and the contract assemblers paid a few points of margin per rack eat it.
Last quarter it ran the other way.
Dell Technologies, which builds servers, storage and PCs and sells them directly to enterprises, governments and cloud operators, reported fiscal first-quarter revenue of $43.8bn, up 87.5% from a year earlier. Gross margin fell to 17.75% from 21.12% — a 337 basis-point compression. Operating income nearly tripled anyway, up 196.8%, because the volume covered fixed costs and operating margin widened from 5.27% to 8.34%. That is operating leverage doing the work, not pricing.
Celestica, a Toronto-based builder of switches, interconnects and custom server racks for hyperscale data-center operators, grew June-quarter revenue 62.4% to $4.70bn with gross margin down just 53 basis points, to 12.29%. Flex, a contract manufacturer whose fastest-growing line is data-center power distribution gear, grew fiscal first-quarter revenue 20.6% to $7.93bn — and its gross margin rose 72 basis points, to 9.42%.
Both beat, both raised, both fell
Celestica lifted full-year revenue guidance to $20.5bn from $19bn and adjusted earnings to $11.30 a share from $10.15. On its July call it disclosed two programs with multi-billion-dollar 2027 potential — custom racks for OpenAI using a Broadcom accelerator, and a design and manufacturing role on AMD's Helios interconnect — plus ten 1.6-terabit programs ramping in the second half.
Flex raised fiscal 2027 revenue guidance to $33.7-35.2bn and adjusted earnings to $4.42-4.74 a share, reported record adjusted earnings of $1.00 against a $0.90 consensus, and said roughly 90% of the next three quarters is already booked.
What broke was cash. Celestica priced a $3bn share sale on 5 August at $310, below the prior close, to fund working capital and capacity; the stock fell 14.8% the following session. Its capital spending hit 5.6% of revenue last quarter against 1.1% a year earlier, is guided to $1bn this year with a $1.5bn placeholder for next, and its trailing free-cash-flow yield is 1.35%. Flex converted $534m of adjusted operating profit into $41m of free cash flow and cut conversion guidance to roughly 40% from 60%; it fell 9.1% on its earnings day. Both were also caught in the broad hardware selloff after Alphabet guided 2026 capital spending to $195-205bn and posted a negative free-cash-flow quarter, which chip investors read as a warning rather than a commitment.
What each is now priced at
Dell's price per dollar of trailing gross profit was 6.99x on 18 May and is 12.77x today, an 83% re-rating in three months; its forward earnings multiple went from about 19x to 26.58x, against a trailing 38.37x. Its own news supports part of that — an AI server backlog of $51.3bn and a fiscal 2027 AI server target lifted to about $60bn — but the largest single day of the advance was not its own: shares rose about 10% on 12 August after Super Micro Computer guided fiscal 2027 revenue far above consensus.
Celestica's price per dollar of gross profit fell to 21.29x from 26.26x over the same stretch, and its trailing earnings multiple to 34.47x from about 46x, while guidance went up. On consensus 2028 earnings of $26.68, it sits near 12.6x. Flex's fell to 16.79x from 21.42x; its forward multiple of 26.85x against a trailing 48.71x is the widest gap of the three, and on 2028 consensus earnings of $7.12 it sits near 17.7x. Flex also plans to spin off its cloud and power infrastructure business, tax-free, in the first quarter of calendar 2027 — a separation consolidated multiples do not yet price.
The charts agree with none of this. Dell's 50-day average has sat above its 200-day for 92 straight sessions since 31 March, after a bearish crossing as recently as early March, and it closed 14 August within 1% of its highest price since June. Celestica's crossed the other way on 12 August, leaving it 29.1% below its June peak; Flex's trend weakened on 17 July and it is 22.2% off its own.
The demand backdrop has not deteriorated: Bank of America expects hyperscaler capital spending above $1.2trn over the next twelve months. The question the two contract manufacturers now pose is whether growth they must pre-fund with equity and factories is worth less than growth Dell books against a balance sheet it already owns.
The setup
Where it stands — Dell has doubled since mid-May while Celestica and Flex, both of which beat and raised, have fallen. Would confirm — Celestica delivering its guided $600m of 2026 free cash flow, and Flex conversion recovering above 40%. Would invalidate — Dell's fiscal Q2 gross margin stabilizing near 17.75% with backlog above $51.3bn while the pair miss again. Watch next — Dell reports fiscal second-quarter results on 3 September. Valuation — Dell 38.37x trailing and 26.58x forward earnings; Celestica 34.47x and 29.46x; Flex 48.71x and 26.85x.