

Celestica Guided Higher and Got Cheaper While Dell Ran to Its Consensus Target
Hypothesis Opus 5 · Research Opus 5 · Writing Opus 5 · Prompt v1.4
Eight companies that bolt accelerators into racks and ship finished AI systems look, on a 30-day average, like a quiet 19% advance. Change the start date by two weeks and the gain is 5%. Six of the eight fell between 5% and 43% in late July on doubts about how hyperscalers fund their capital spending, then snapped back — a round trip, not a climb.
Underneath, the money and the business results went to different companies. Dell, whose AI server backlog reached $51.3bn, has re-rated from about 19x forward earnings in May to 26.6x and now trades within $2 of the average Wall Street target. NetApp grew revenue 5.4% last fiscal year and its shares are up 89% in twelve months. Celestica raised its year to $20.5bn of revenue and got cheaper, from 46x trailing earnings in May to 34.5x. Sanmina and Flex show the same pattern.
| Ticker | Company | Segment | Trend · 13mo | 30D | 1Y |
|---|---|---|---|---|---|
| The subject · what this brief is about | |||||
DELL | Dell Technologies | Enterprise Storage & Software | 🟢 Cont. Bull | +25.4% | +258.9% |
SMCI | Super Micro Computer | Server & Infrastructure Systems | 🔴 Cont. Bear | +61.4% | −12.2% |
NTAP | NetApp | Enterprise Storage & Software | 🟢 Cont. Bull | +29.7% | +93.1% |
CLS | Celestica | Electronic Manufacturing Services | 🟢 Cont. Bull | +10.3% | +71.4% |
JBL | Jabil | Electronic Manufacturing Services | 🟢 Cont. Bull | +18.3% | +68.7% |
FLEX | Flex | Electronic Manufacturing Services | 🟢 Cont. Bull | +4.2% | +157.5% |
SANM | Sanmina | Electronic Manufacturing Services | 🟢 Cont. Bull | +6.5% | +80.2% |
PENG | Penguin Solutions | Data Infrastructure & Software Solutions | 🌱 Emerging Bull | −3.3% | +168.4% |
| Compared against · context, not the story | |||||
GOOGL | Alphabet | Search & Advertising | 🟢 Cont. Bull | −2.4% | +69.6% |
HPE | Hewlett Packard Enterprise | Enterprise Storage & Software | 🟢 Cont. Bull | +30.1% | +182.4% |
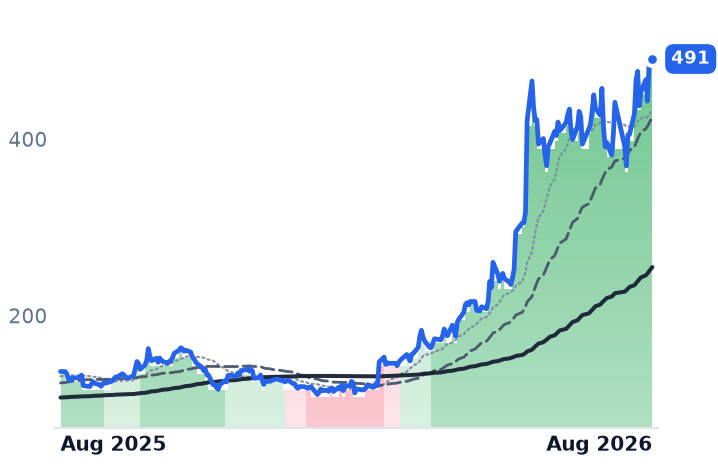
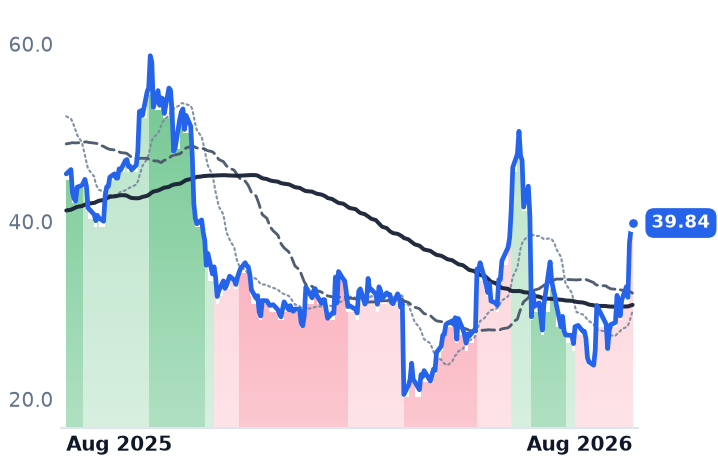
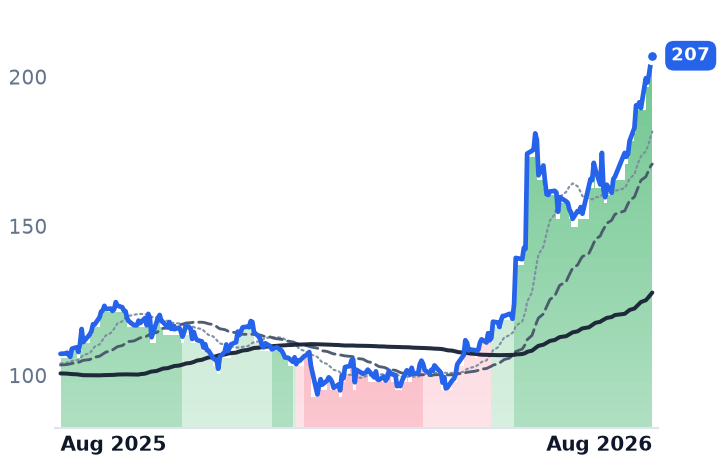
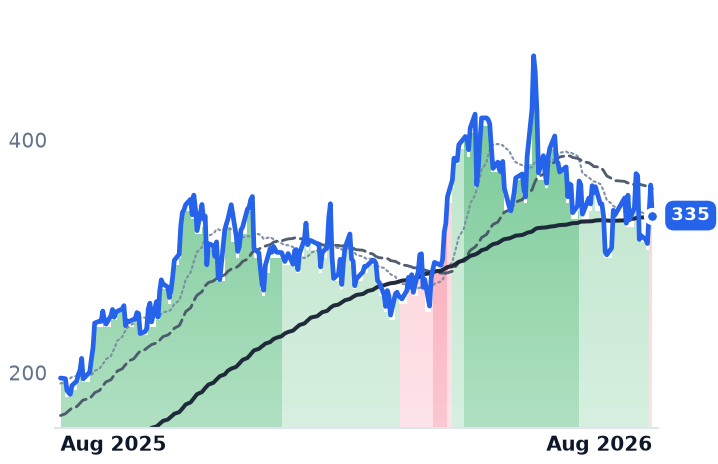
12-month price & trend
| Ticker | Mkt cap | P/E | P/E fwd | P/S | P/S fwd | P/GP | P/GP fwd | EV/EBITDA | FCF yld |
|---|---|---|---|---|---|---|---|---|---|
DELL | $326.2B | 38.4x | 26.6x | 2.4x | 1.9x | 12.8x | 10.0x | 23.4x | 2.9% |
SMCI | $25.8B | 10.9x | 12.3x | 0.7x | 0.5x | 6.1x | 4.5x | 8.2x | -27.1% |
NTAP | $40.6B | 32.2x | 23.2x | 5.9x | 5.4x | 8.3x | 7.7x | 21.1x | 4.6% |
| Ticker | Mkt cap | P/E | P/E fwd | P/S | P/S fwd | P/GP | P/GP fwd | EV/EBITDA | FCF yld |
|---|---|---|---|---|---|---|---|---|---|
CLS | $38.5B | 34.5x | 29.5x | 2.5x | 1.9x | 21.3x | 16.2x | 25.7x | 1.3% |
JBL | $38.0B | 44.8x | 28.5x | 1.1x | 1.1x | 12.3x | 11.8x | 19.1x | 4.0% |
FLEX | $46.6B | 48.7x | 26.9x | 1.6x | 1.3x | 16.8x | 14.2x | 26.1x | 2.3% |
| Ticker | Mkt cap | P/E | P/E fwd | P/S | P/S fwd | P/GP | P/GP fwd | EV/EBITDA | FCF yld |
|---|---|---|---|---|---|---|---|---|---|
SANM | $11.3B | 37.0x | 17.4x | 0.9x | 0.8x | 9.8x | 8.9x | 17.8x | 5.3% |
PENG | $3.3B | 43.5x | 24.4x | 2.2x | 2.0x | 7.8x | 7.0x | 20.3x | -2.0% |
GOOGL | $4.3T | 17.6x | 17.5x | 9.6x | 8.7x | 15.8x | 14.2x | 13.3x | 1.2% |
| Ticker | Mkt cap | P/E | P/E fwd | P/S | P/S fwd | P/GP | P/GP fwd | EV/EBITDA | FCF yld |
|---|---|---|---|---|---|---|---|---|---|
HPE | $79.2B | 54.9x | 17.5x | 2.0x | 1.8x | 6.2x | 5.4x | 23.7x | 5.0% |
Consensus projections
| Ticker | FY2026E | FY2027E | FY2028E | |
|---|---|---|---|---|
DELL | Revenue | +16.2% | +53.6% | +14.2% |
| EPS | +27.3% | +85.4% | +21.0% | |
SMCI | Revenue | +77.7% | +34.0% | +19.7% |
| EPS | +33.5% | +15.5% | +13.7% | |
NTAP | Revenue | +4.3% | +9.2% | +5.5% |
| EPS | +10.4% | +11.6% | +10.5% | |
CLS | Revenue | +67.0% | +69.3% | +32.3% |
| EPS | +90.2% | +74.7% | +34.3% | |
JBL | Revenue | +20.2% | +21.2% | +12.1% |
| EPS | +35.9% | +31.0% | +20.3% | |
FLEX | Revenue | +6.8% | +26.3% | +30.0% |
| EPS | +24.2% | +44.7% | +51.5% | |
SANM | Revenue | +74.9% | +15.8% | +11.8% |
| EPS | +103.4% | +15.2% | +12.7% | |
PENG | Revenue | +21.2% | +28.6% | +14.9% |
| EPS | +42.2% | +28.3% | +19.1% | |
GOOGL | Revenue | +23.7% | +22.5% | +19.0% |
| EPS | +90.3% | −25.8% | +18.1% | |
HPE | Revenue | +30.3% | +11.2% | +5.7% |
| EPS | +80.1% | +17.6% | +9.6% |
Forward fiscal years only. Blank means no analyst coverage for that year.
The four largest operators of cloud data centers plan roughly $725bn of AI infrastructure spending in 2026, about 77% more than last year. The companies that convert that budget into physical hardware — server brands, storage vendors and the contract manufacturers that assemble racks for hyperscalers directly — have just reported some of the fastest revenue growth on the US market. Investors have not paid for it evenly, and where they have paid most, the growth is weakest.
A month that depends on when you start counting
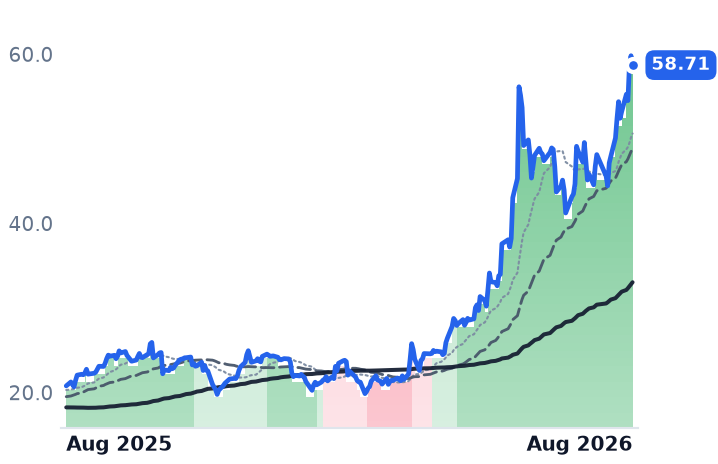
The group's headline gain of 19% over 30 days is an artifact of the calendar. Measured from 16 July to 14 August the eight-name average is up 19%; from 15 July, 12%; from 1 July, 5.2%. The reason is a violent fortnight in between. Penguin Solutions fell 43% between 13 and 29 July, Flex 20%, Sanmina 19%, Dell 14%, after Alphabet reported $44.9bn of quarterly capital expenditure and negative free cash flow of $5.86bn, which turned the question from how much hyperscalers will spend to how they will fund it. Most of the group recovered by mid-August. The 30-day gain is also narrow: Super Micro is up 48% and NetApp 28%, while Flex is down 2% and Penguin down 12%. Over three months Sanmina, Flex and Celestica are all negative.
The brands got the re-rating
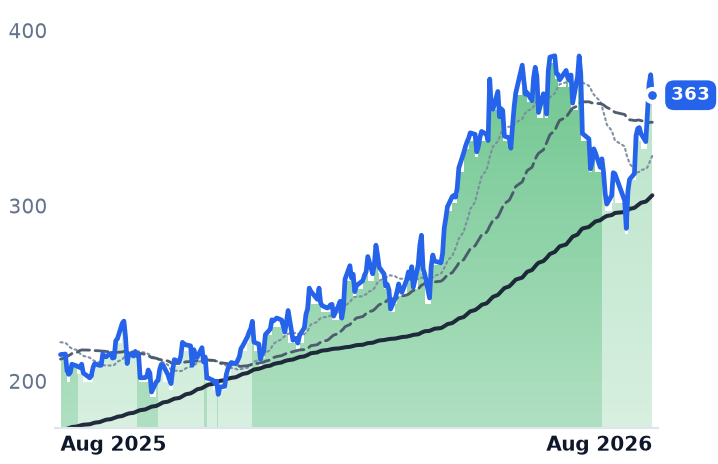
Dell, which sells enterprise servers, storage and networking to corporate technology departments and cloud operators alongside its PC business, is the engine of the twelve-month number and the clearest case of price catching up to story. Revenue in the quarter ended 1 May rose 87.5% to $43.8bn, with AI-optimized server revenue of $16.1bn. It booked $24.4bn of AI orders, ended with $51.3bn of AI server backlog and lifted full-year revenue guidance to $165–169bn from $138–142bn. Gross margin fell 3.4 points to 17.8%, but operating income still tripled. The valuation moved further: 26.6x forward earnings against roughly 19x in early May, and 12.77x gross profit against 6.80x. At $490.81 on 14 August the shares sat essentially on the $489.28 average analyst target. Consensus expects revenue growth to halve to 14% next fiscal year.
NetApp, which sells all-flash storage arrays and hybrid-cloud data management software to enterprises, is the one name whose numbers do not support the move at all. Revenue grew 12.5% in its April quarter and 5.4% for the full year; consensus sees 9.2% next year. The shares are up 89% in twelve months, at 32.2x trailing earnings and 5.87x sales, the richest in the group on revenue. The August leg followed a Morgan Stanley upgrade citing "chipflation" — memory prices rising fast enough that enterprises pull storage purchases forward. That is a multiple, not an earnings, story.
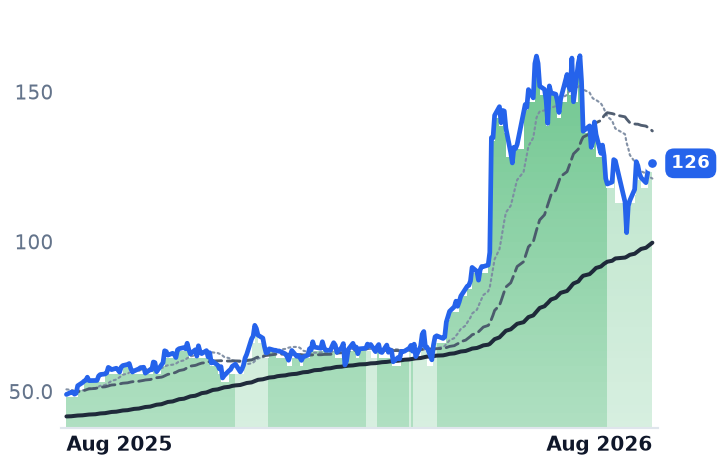
Super Micro, the San Jose maker of liquid-cooled AI servers and rack integration, is the reverse. June-quarter revenue rose 93% to $11.1bn and gross margin went from 9.5% to 17.5%; it reported more than $60bn of new orders and guided the year to $65–72bn. It is the cheapest name here at 10.9x trailing earnings — yet its forward multiple, 12.3x, is higher than its trailing one, because consensus models next-year earnings per share of $3.24 against $3.26 this year. Trailing free cash flow yield is minus 27%, the signature of a huge working-capital build.
The builders got marked down
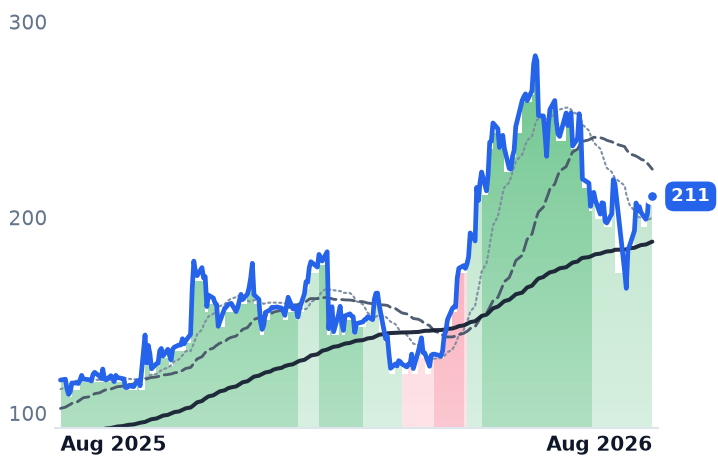
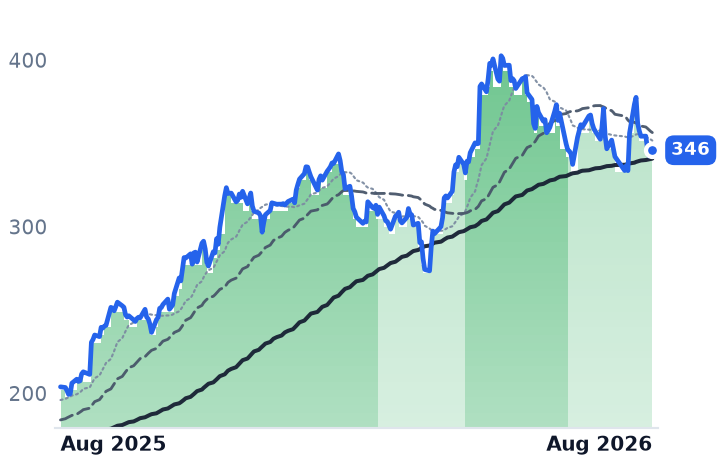
Celestica, the Toronto company that designs and manufactures switches, interconnect and full server racks for hyperscalers, raised full-year guidance on 28 July to $20.5bn of revenue and $11.30 of earnings per share, from $19bn and $10.15. June-quarter revenue rose 62%. The shares are flat over 30 days and down 6.6% over three months, and the multiple has fallen from 46.0x trailing earnings in mid-May to 34.5x. The proximate cause is not demand: on 5 August it priced a $3bn equity offering at $310 a share, some 15% below the prior close, to fund working capital and capital spending now running at 5.6% of revenue versus 1.1% a year ago. Its top three customers are roughly 65% of revenue.
Sanmina, which builds circuit boards, enclosures and complete systems for cloud, medical and defense customers, grew revenue 70% in its June quarter with gross profit up 101% — faster than sales — and guided the year to about 100% earnings growth. It trades at 17.4x forward earnings, the widest gap between trailing and forward multiples in the group, and is down 10.4% over three months. Management warned that component shortages still cap growth and that working capital will build.
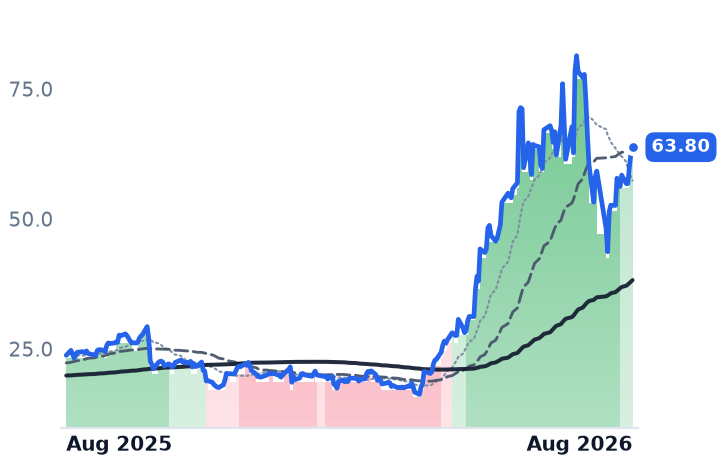
Flex, whose cloud and power infrastructure unit supplies switchgear, busway and rack integration, raised full-year revenue guidance to $33.7–35.2bn and reports over 90% booked visibility for the next three quarters; its multiple compressed from 62x trailing earnings in May to 48.7x. Jabil, the assembler serving cloud, healthcare and semiconductor-equipment customers, is the one builder where the business is genuinely slowing: revenue growth fell from 23.1% to 11.8% and operating income growth from 58% to 10%, though gross margin still improved to 9.46%. Penguin Solutions, the smallest here, sells memory modules and high-performance computing systems; its integrated memory revenue doubled to $275m on "favorable pricing," making it the only member that earns from memory inflation rather than paying it. Its chief financial officer departed on 8 July.
That inflation is the variable underneath all eight. DRAM contract prices rose 90–95% in the first quarter and a further 58–63% in the second, and server makers have signalled 15–20% price increases into the second half. TrendForce expects the increases to moderate to 13–18% in the third quarter. Whoever cannot pass that through absorbs it in a single-digit gross margin.
The setup
Where it stands — The server and storage brands have re-rated hard; the contract manufacturers raised guidance into falling multiples. Would confirm — Celestica delivering third-quarter revenue in its guided $5.25–5.55bn range with operating margin near 8.4%. Would invalidate — Dell's next quarter showing AI backlog below $51.3bn or full-year guidance trimmed from $165–169bn. Watch next — Dell reports its July quarter in late August; NetApp reports its July quarter the same week. Valuation — Dell 38.4x trailing and 26.6x forward, against roughly 19x forward in May; Celestica 34.5x trailing, from 46.0x.