

DigitalOcean Fell 41% as Its Growth Accelerated. The Damage Is on the Cost Line
Hypothesis Opus 5 · Research Opus 5 · Writing Opus 5 · Prompt v1.4
DigitalOcean pre-announced a record quarter in July, raised its full-year forecast in August, and its shares still sit 28% below their June high after a 41% peak-to-trough slide. The business gives almost no support to that decline — with one exception that matters.
Revenue growth at the developer-focused cloud has accelerated four quarters running, from 15.7% to 28.6%, and contracted future revenue rose twelvefold to $894m. What broke is the cost line: gross margin has fallen every quarter since early 2025, to 55.0% from 61.4%, as graphics-processor capacity converts into depreciation, and GAAP operating income fell 17.5% on that 28.6% revenue gain.
So the selloff is unwinding a multiple, not a demand story. At 12.9x forward sales, down from roughly 15.5x at the May peak, DigitalOcean still costs 3.5x Nutanix on price-to-gross-profit — on four times the growth.
| Ticker | Company | Segment | Trend · 13mo | 30D | 1Y |
|---|---|---|---|---|---|
| The subject · what this brief is about | |||||
DOCN | DigitalOcean | Cloud Infrastructure & Platforms | 🟢 Cont. Bull | +11.0% | +318.6% |
| Compared against · context, not the story | |||||
NTNX | Nutanix | Cloud Infrastructure & Platforms | 🌱 Emerging Bull | +19.3% | −3.0% |
MSFT | Microsoft | Cloud Infrastructure & Platforms | 🔴 Cont. Bear | +23.5% | −4.2% |
ORCL | Oracle | Cloud Infrastructure & Platforms | 🔴 Cont. Bear | +21.2% | −38.9% |
RXT | Rackspace Technology | Cloud Infrastructure & Platforms | 🌱 Emerging Bull | +0.0% | +259.8% |
NBIS | Nebius | Cloud Infrastructure & AI | 🟢 Cont. Bull | +61.7% | +287.7% |
CRWV | CoreWeave | Cloud GPU Computing | 🔴 Cont. Bear | +44.4% | +5.3% |
12-month price & trend
| Ticker | Mkt cap | P/E | P/E fwd | P/S | P/S fwd | P/GP | P/GP fwd | EV/EBITDA | FCF yld |
|---|---|---|---|---|---|---|---|---|---|
DOCN | $15.2B | 51.6x | 89.4x | 15.0x | 12.9x | 26.3x | 22.6x | 42.6x | 0.1% |
NTNX | $18.0B | 65.3x | 30.4x | 6.5x | 5.6x | 7.5x | 6.5x | 53.3x | 4.3% |
MSFT | $3.7T | 27.5x | 25.2x | 11.1x | 9.4x | 16.3x | 13.9x | 18.2x | 1.8% |
| Ticker | Mkt cap | P/E | P/E fwd | P/S | P/S fwd | P/GP | P/GP fwd | EV/EBITDA | FCF yld |
|---|---|---|---|---|---|---|---|---|---|
ORCL | $433.0B | 25.3x | 18.7x | 6.4x | 4.8x | 9.8x | 7.3x | 17.4x | -5.5% |
RXT | $1.1B | n/m | — | 0.4x | 0.4x | 2.9x | 3.1x | 14.5x | 3.8% |
NBIS | $45.6B | 56.0x | — | 51.9x | 13.5x | 108.3x | 28.2x | 32.8x | -5.4% |
| Ticker | Mkt cap | P/E | P/E fwd | P/S | P/S fwd | P/GP | P/GP fwd | EV/EBITDA | FCF yld |
|---|---|---|---|---|---|---|---|---|---|
CRWV | $46.6B | n/m | — | 7.5x | 3.7x | 10.8x | 5.3x | 25.7x | -22.8% |
Consensus projections
| Ticker | FY2026E | FY2027E | FY2028E | |
|---|---|---|---|---|
DOCN | Revenue | +31.2% | +53.5% | +43.7% |
| EPS | −29.0% | +23.2% | +60.4% | |
NTNX | Revenue | +12.1% | +12.8% | +12.5% |
| EPS | +10.9% | +13.6% | +16.3% | |
MSFT | Revenue | +18.0% | +18.2% | +19.6% |
| EPS | +26.7% | +15.4% | +18.5% | |
ORCL | Revenue | +17.8% | +33.2% | +45.5% |
| EPS | +25.3% | +7.6% | +35.6% | |
RXT | Revenue | −6.6% | +4.4% | +8.4% |
| EPS | −11.9% | −194.9% | +167.0% | |
NBIS | Revenue | +512.2% | +244.5% | +86.2% |
| EPS | +126.3% | +35.2% | −23.8% | |
CRWV | Revenue | +147.1% | +98.0% | +60.2% |
| EPS | +194.1% | −65.7% | −325.8% |
Forward fiscal years only. Blank means no analyst coverage for that year.
DigitalOcean, which rents virtual machines and graphics-processor hours to individual developers, start-ups and small businesses, told investors on 7 July that it expected a record second quarter, with remaining performance obligations — revenue already under contract but not yet delivered — above $800m, more than ten times the year-earlier figure. It cited multiple nine-figure annual commitments from customers buying inference capacity. When the quarter actually printed on 4 August, the company raised full-year revenue guidance to $1.170–1.180bn from $1.130–1.145bn set in May.
The shares had already fallen by then, and they fell again on the print.
The demand side is not what broke
Revenue growth has accelerated in each of the last four quarters: 15.7%, 18.3%, 22.4% and 28.6%, the most recent taking quarterly revenue to $281.2m. Incremental annual recurring revenue of $93m was a record, up 191%. Annual recurring revenue tied to artificial-intelligence customers reached $234m, from $170m three months earlier, and 85% of it came from inference and core cloud services rather than raw bare-metal rental. Contracted future revenue finished at $894m against $71m a year ago, with the weighted-average contract length stretching from 1.6 years to over three. Non-GAAP earnings of $0.45 a share beat the $0.26 consensus by 73%.
The cost side is
Gross margin has declined in six consecutive quarters, to 55.0% from 61.4% in early 2025 — down 489 basis points year over year in the June quarter alone. Gross profit grew 18.1% against revenue growth of 28.6%. Depreciation and amortization went from $33m to $51m as data-center capacity purchased in 2025 landed on the income statement, and GAAP operating income fell 17.5% to $29.4m, with operating margin at 10.4% against 16.3% a year earlier. Adjusted free cash flow margin was 22% in the quarter, against 26% a year earlier, and management guides the full year to 11–13%. Trailing free cash flow yield is essentially zero.
The pressure is not company-specific. GPU hourly rental rates paid across the sector fell 20–25% over the past year, with the buyer of the hardware absorbing the depreciation. DigitalOcean's roughly 155 megawatts of committed capacity across 20 data centers is a fraction of what CoreWeave or Nebius operate, so it competes on inference and developer workloads rather than large-scale model training.
What the shares did, and against what
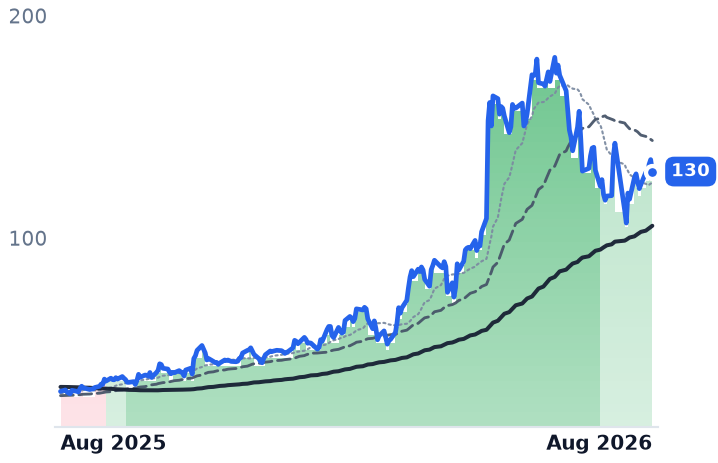
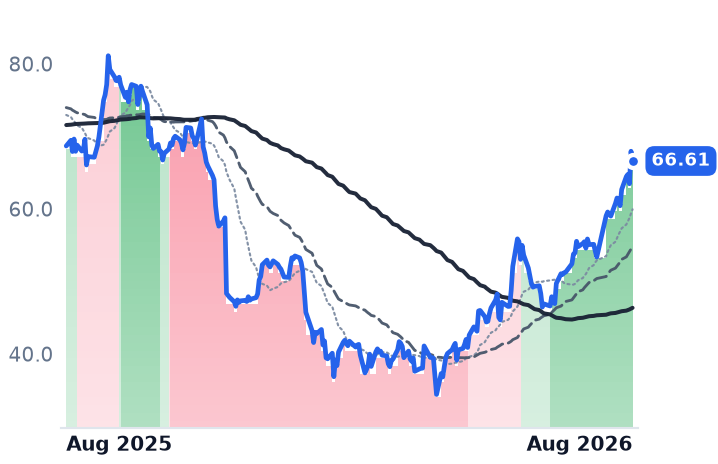
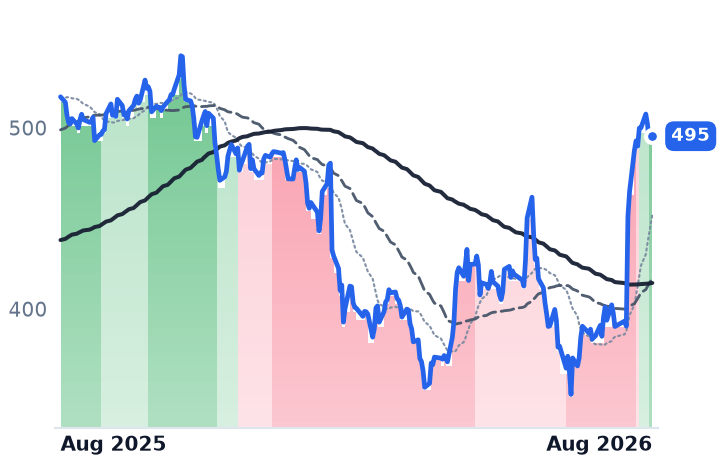
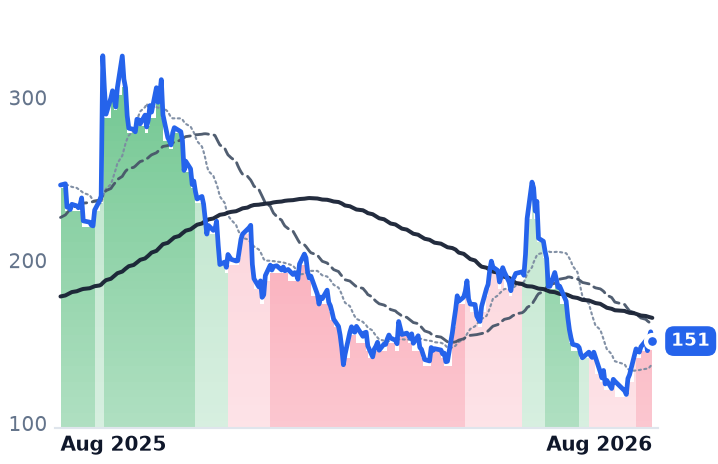
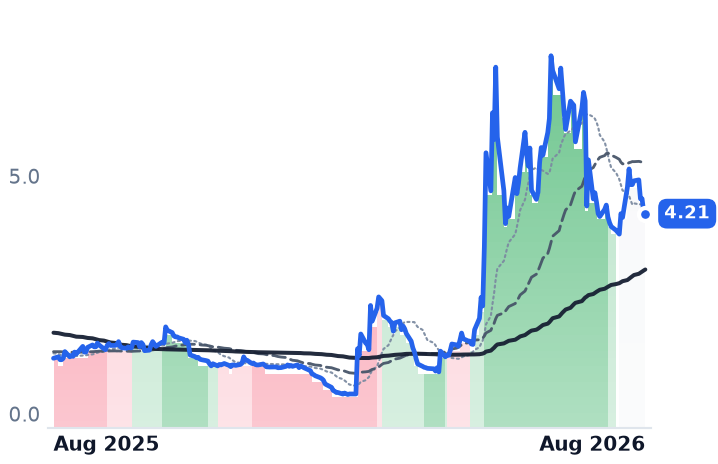
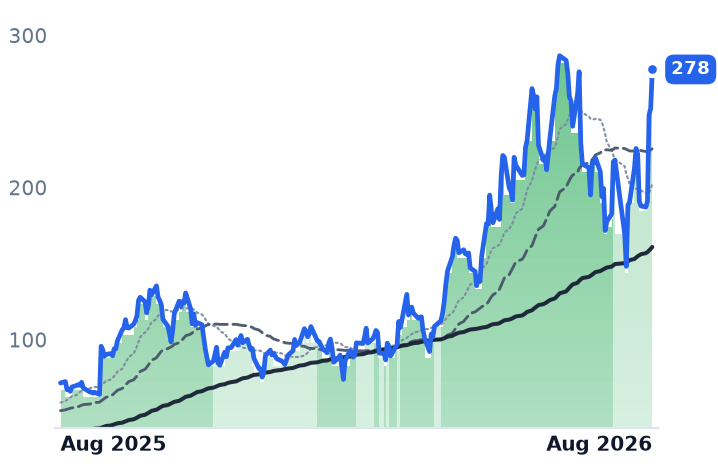
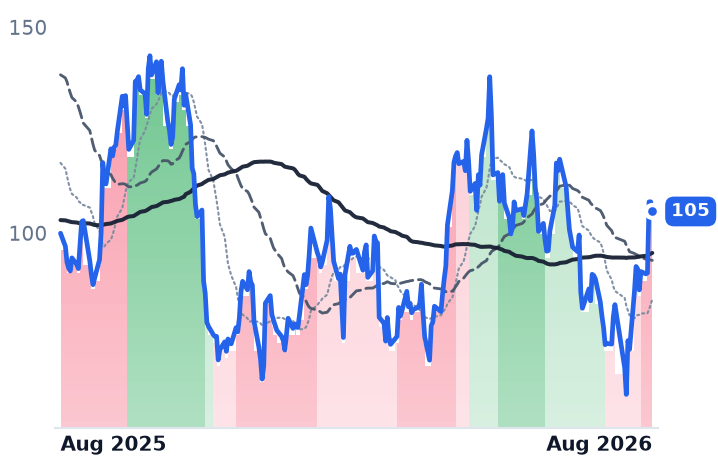
The stock peaked at $181.29 on 15 June, fell to $106.76 on 29 July and closed at $129.92 on 14 August. Roughly a third of the decline came before any July company news, during a stretch in which chip stocks shed more than $1trn on doubts about AI capital spending. Over three months DigitalOcean is down 16% while Nutanix, the enterprise-infrastructure software vendor that is the other big riser in this corner of cloud, is up 44%. Over twelve months the ranking inverts entirely: DigitalOcean is up 325%, Microsoft down 5% and Oracle down 39%.
Whether the price level leaves room
Forward price-to-sales has compressed to 12.9x from roughly 15.5x at the May peak. Because gross margin differs so sharply across these businesses — Nutanix earns 86.9%, DigitalOcean 55.0% — price against gross profit is the fairer comparison, and there DigitalOcean sits at 22.6x forward versus 6.5x for Nutanix. It is a 3.5x premium on consensus growth of 31% this year and 54% next, against 12% for Nutanix, whose revenue growth has slipped to 10% while its operating income grew 51%. Reported earnings are the wrong lens: consensus has DigitalOcean's earnings per share falling 29% this year, to $1.45, on 31% revenue growth, entirely because of depreciation and stock compensation.
On 23 July the company retired about $472m of its zero-coupon 2030 convertible notes, funding it by selling 12.5m shares at $117.54, leaving pro-forma net leverage at 0.7x with $767m of cash. That removed the conversion overhang and added roughly 12% to the share count in the middle of the drawdown.
One number the company did not give is net dollar retention — the spend growth of existing customers — which was absent from the release, the presentation and the call. With growth increasingly concentrated in a handful of very large AI-native accounts, it is the disclosure that would settle how broad this is. Analysts have not followed the price down: the median target across 13 of them is $175, and Barclays cut to $160 while keeping an overweight rating.
The setup
Where it stands — Growth is accelerating and margins are compressing at once; the shares have given back a third of a spectacular year. Would confirm — Gross margin stabilizing at or above 55% in the September quarter as capacity fills. Would invalidate — Third-quarter revenue below the $304–307m guide, or contracted future revenue failing to grow from $894m. Watch next — Third-quarter results in early November, with full-year adjusted free cash flow margin guided to 11–13%. Valuation — 12.9x forward sales against 15.0x trailing; 22.6x forward price-to-gross-profit versus Nutanix at 6.5x.