

Paycom's 45% Month Came Mostly in One Session. ZoomInfo's 29% Has No Business Behind It.
Hypothesis Opus 5 · Research Opus 5 · Writing Opus 5 · Prompt v1.4
Three payroll and sales-data software companies the market spent a year pricing as artificial-intelligence roadkill are up about 30% in a month. Only one of them printed news to justify it, and even there the news was about profit, not sales.
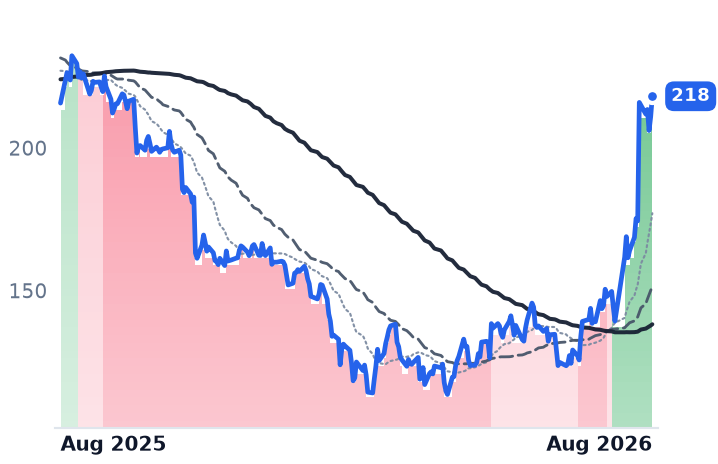
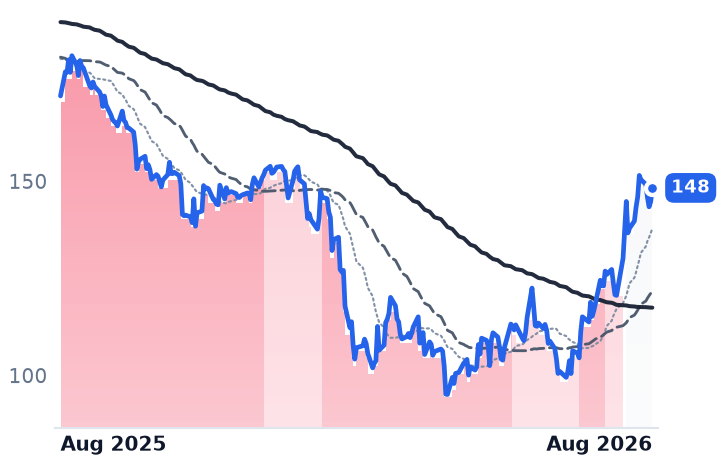
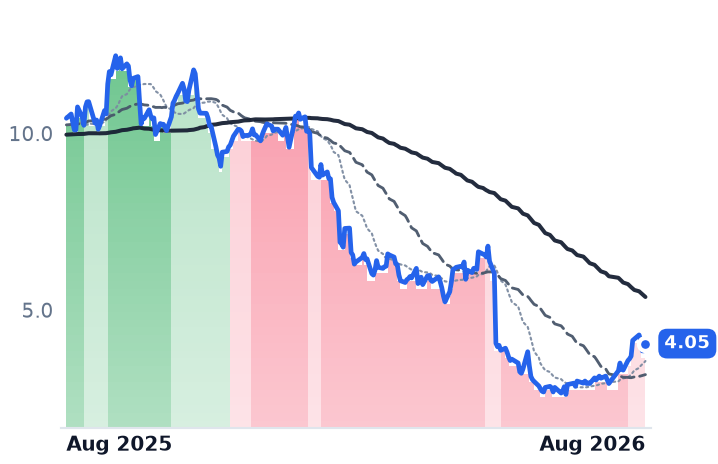
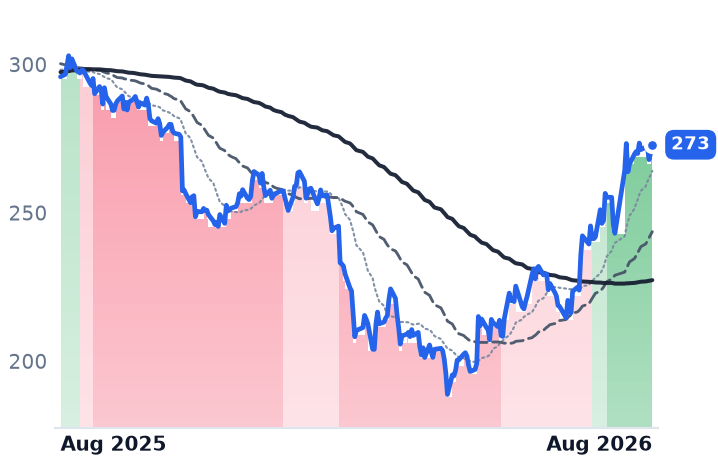
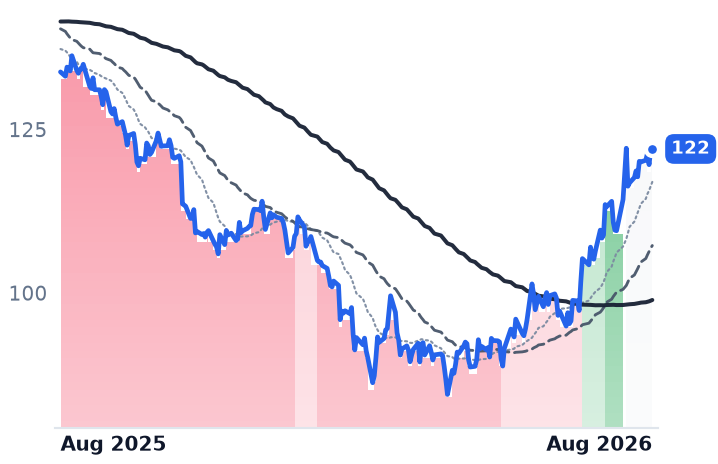
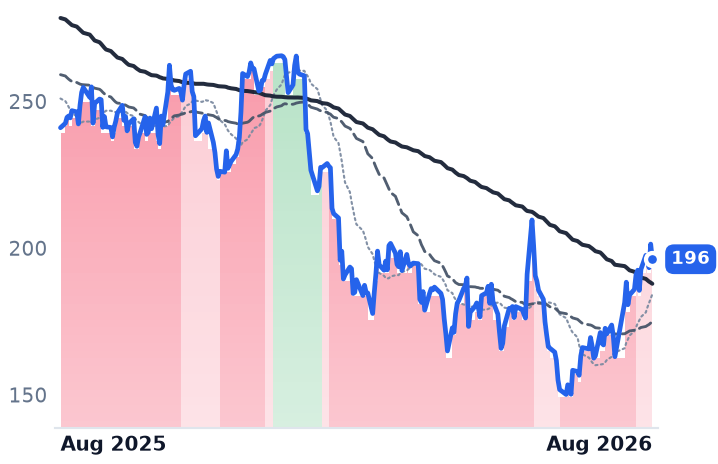
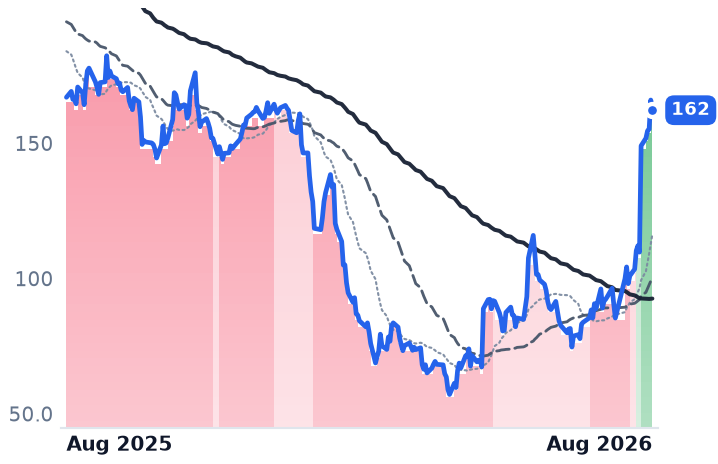
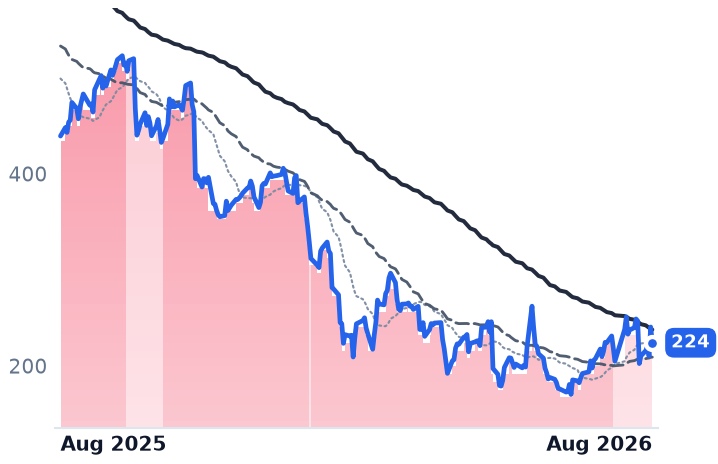
Paycom beat estimates on 5 August and raised guidance; the next session alone supplied roughly three-fifths of its 45% month. Its revenue growth has fallen from 23.2% in 2023 to a 7-8% guide for this year, while operating margin widened to 31.7% from 23.2% and the company retired a fifth of its shares in six months. Paylocity is following the same pattern — 11% growth delivered, about 7% guided. ZoomInfo diverges: revenue rose 1.2%, net revenue retention slipped to 89%, and it wrote off $651m of goodwill. It rallied anyway.
| Ticker | Company | Segment | Trend · 13mo | 30D | 1Y |
|---|---|---|---|---|---|
| The subject · what this brief is about | |||||
PAYC | Paycom Software | HR & Workforce Management | 🔴 Cont. Bear | +45.0% | +1.1% |
PCTY | Paylocity | HR & Workforce Management | 🔴 Cont. Bear | +16.9% | −13.8% |
GTM | ZoomInfo Technologies | HR & Workforce Management | 🔴 Cont. Bear | +29.4% | −61.2% |
| Compared against · context, not the story | |||||
DOCN | DigitalOcean | Cloud Infrastructure & Platforms | 🟢 Cont. Bull | +11.0% | +318.6% |
ADP | Automatic Data Processing | HCM Software & Payroll | 🌱 Emerging Bull | +6.4% | −7.7% |
PAYX | Paychex | HCM Software & Payroll | 🌱 Emerging Bull | +7.5% | −8.8% |
WDAY | Workday | Enterprise Resource Planning | 🔴 Cont. Bear | +36.6% | −12.1% |
NOW | ServiceNow | Specialized Enterprise Solutions | 🔴 Cont. Bear | +19.2% | −28.5% |
CRM | Salesforce | Customer Experience & CRM | 🔴 Cont. Bear | +13.6% | −18.6% |
TEAM | Atlassian | Developer Tools & DevOps | 🔴 Cont. Bear | +75.6% | −2.9% |
WK | Workiva | Security & Compliance | ⚠️ Emerging Bear | +23.8% | −5.7% |
TNET | TriNet | HCM Software & Payroll | 🔴 Cont. Bear | +13.7% | +7.0% |
HUBS | HubSpot | Customer Experience & CRM | 🔴 Cont. Bear | −0.2% | −49.0% |
ZM | Zoom Communications | Communications & Collaboration | 🟢 Cont. Bull | +14.0% | +44.9% |
HQY | HealthEquity | Patient Engagement & Benefits | 🌱 Emerging Bull | +6.1% | +16.5% |
NSP | Insperity | HCM Software & Payroll | 🌱 Emerging Bull | +5.5% | +8.0% |
12-month price & trend
| Ticker | Mkt cap | P/E | P/E fwd | P/S | P/S fwd | P/GP | P/GP fwd | EV/EBITDA | FCF yld |
|---|---|---|---|---|---|---|---|---|---|
PAYC | $9.8B | 23.1x | 18.2x | 4.6x | 4.5x | 5.7x | 5.6x | 11.8x | 7.7% |
PCTY | $7.9B | 29.7x | 16.8x | 4.5x | 4.2x | 6.5x | 6.1x | 15.6x | 5.6% |
GTM | $1.2B | n/m | 3.6x | 0.9x | 1.0x | 1.1x | 1.2x | n/m | 37.6% |
| Ticker | Mkt cap | P/E | P/E fwd | P/S | P/S fwd | P/GP | P/GP fwd | EV/EBITDA | FCF yld |
|---|---|---|---|---|---|---|---|---|---|
DOCN | $15.2B | 51.6x | 89.4x | 15.0x | 12.9x | 26.3x | 22.6x | 42.6x | 0.1% |
ADP | $108.5B | 24.7x | 22.2x | 4.9x | 4.7x | 10.3x | 9.7x | 17.2x | 4.6% |
PAYX | $32.8B | 20.1x | 16.7x | 5.2x | 5.0x | 7.0x | 6.8x | 12.8x | 6.6% |
| Ticker | Mkt cap | P/E | P/E fwd | P/S | P/S fwd | P/GP | P/GP fwd | EV/EBITDA | FCF yld |
|---|---|---|---|---|---|---|---|---|---|
WDAY | $47.1B | 55.8x | 16.7x | 4.8x | 4.4x | 6.3x | 5.8x | 30.0x | 6.3% |
NOW | $127.2B | 76.4x | 30.2x | 8.6x | 7.8x | 11.5x | 10.5x | 38.2x | 3.6% |
CRM | $160.7B | 22.6x | 13.9x | 3.8x | 3.5x | 4.8x | 4.5x | 13.8x | 9.1% |
| Ticker | Mkt cap | P/E | P/E fwd | P/S | P/S fwd | P/GP | P/GP fwd | EV/EBITDA | FCF yld |
|---|---|---|---|---|---|---|---|---|---|
TEAM | $42.6B | n/m | 26.7x | 6.5x | 5.8x | 7.6x | 6.8x | 282.1x | 3.1% |
WK | $2.7B | 189.9x | 16.3x | 2.9x | 2.6x | 3.6x | 3.2x | 95.9x | 6.5% |
TNET | $1.9B | 12.0x | 8.9x | 0.4x | 0.4x | 2.1x | 2.2x | 6.4x | 17.7% |
| Ticker | Mkt cap | P/E | P/E fwd | P/S | P/S fwd | P/GP | P/GP fwd | EV/EBITDA | FCF yld |
|---|---|---|---|---|---|---|---|---|---|
HUBS | $11.3B | 77.9x | 16.7x | 3.3x | 3.1x | 3.9x | 3.7x | 37.3x | 6.8% |
ZM | $31.4B | 15.4x | 17.7x | 6.4x | 6.2x | 8.2x | 8.0x | 11.0x | 6.2% |
HQY | $6.9B | 32.9x | 17.8x | 5.3x | 4.9x | 7.6x | 7.1x | 23.6x | 6.3% |
| Ticker | Mkt cap | P/E | P/E fwd | P/S | P/S fwd | P/GP | P/GP fwd | EV/EBITDA | FCF yld |
|---|---|---|---|---|---|---|---|---|---|
NSP | $1.2B | n/m | 14.7x | 0.2x | 0.2x | 1.3x | 1.3x | 29.1x | 5.8% |
Consensus projections
| Ticker | FY2026E | FY2027E | FY2028E | |
|---|---|---|---|---|
PAYC | Revenue | +7.6% | +7.1% | +8.5% |
| EPS | +29.5% | +15.1% | +10.5% | |
PCTY | Revenue | +11.1% | +7.5% | +7.6% |
| EPS | +15.4% | +9.0% | +9.7% | |
GTM | Revenue | −2.6% | −2.1% | +1.9% |
| EPS | +6.9% | +0.6% | +8.6% | |
DOCN | Revenue | +31.2% | +53.5% | +43.7% |
| EPS | −29.0% | +23.2% | +60.4% | |
ADP | Revenue | +7.0% | +5.9% | +5.7% |
| EPS | +11.0% | +10.6% | +9.3% | |
PAYX | Revenue | +16.5% | +5.4% | +5.4% |
| EPS | +10.1% | +7.6% | +6.5% | |
WDAY | Revenue | +13.4% | +11.8% | +11.0% |
| EPS | +26.5% | +18.5% | +17.3% | |
NOW | Revenue | +22.4% | +18.7% | +18.6% |
| EPS | +17.1% | +23.2% | +21.4% | |
CRM | Revenue | +9.3% | +11.1% | +9.4% |
| EPS | +17.4% | +20.2% | +10.4% | |
TEAM | Revenue | +24.7% | +13.4% | +15.9% |
| EPS | +55.5% | +10.5% | +18.0% | |
WK | Revenue | +17.9% | +15.6% | +17.5% |
| EPS | +77.9% | +20.3% | +33.4% | |
TNET | Revenue | +317.5% | +3.8% | −76.7% |
| EPS | −3.0% | +6.6% | +19.2% | |
HUBS | Revenue | +18.5% | +14.9% | +14.0% |
| EPS | +37.2% | +22.5% | +18.5% | |
ZM | Revenue | +4.2% | +4.8% | +4.0% |
| EPS | +9.7% | +1.2% | +4.0% | |
HQY | Revenue | +9.9% | +7.6% | +8.2% |
| EPS | +25.4% | +16.9% | +15.5% | |
NSP | Revenue | +1.0% | +5.0% | +5.4% |
| EPS | +79.5% | +36.1% | +30.9% |
Forward fiscal years only. Blank means no analyst coverage for that year.
On 5 August, Paycom Software — an Oklahoma City vendor whose single-database payroll, time-tracking and benefits system runs the back office for small and mid-sized American employers — beat quarterly estimates and raised its full-year forecast. The next session did most of the work of its month. The shares closed nearly 24% higher, and that one day accounts for about three-fifths of everything Paycom has gained since mid-July.
That matters because Paycom is more than half the combined market value of the three companies in this corner of software, and because the other two names have no comparable event behind them. Paylocity, a Schaumburg, Illinois rival selling payroll and human capital management to the same mid-market employers, added 17%. ZoomInfo, which sells a business-to-business contact database with buying-signal tracking to sales and marketing teams, added 29% — while telling investors its revenue will shrink this year.
The profit line moved, not the top line
Paycom's second-quarter revenue was $531.2m, up 9.8%, with recurring revenue up 11%. Operating income rose 50% to $168.5m. Operating margin reached 31.7%, against 23.2% a year earlier. Management attributed the gain to a 2025 data-center build now saving more than $100m a year in research and development, plus a $30m cut in third-party AI token fees — artificial intelligence is currently reducing Paycom's own cost base, not its customers' headcount. Management said client employment growth remains stable and consistent with historical levels.
Underneath, the growth curve is bending down: 23.2% revenue growth in 2023, 11.2% in 2024, 8.9% in 2025, and a raised full-year guide of $2.197-2.212bn that still implies 7-8%. Diluted earnings per share of $2.34 was up 48% on net income growth of 20%, the difference coming from a share count that fell to 45.9m from 56.3m. Paycom bought back $1.4bn of stock in the first half, cutting shares outstanding by a fifth, with $1.66bn of authorization left. After the beat, analysts raised targets sharply — TD Cowen from $149 to $244, Baird from $183 to $245 — leaving a consensus of $269.76 across 25 analysts.
The one that is actually shrinking
ZoomInfo is the case the AI-disruption thesis was written for, and its quarter confirmed it. Revenue of $310.4m grew 1.2%; gross profit fell slightly. Net revenue retention — what existing customers spend this year against last — dropped to 89%, from 90% in each of the prior three quarters. The company took a $651m goodwill impairment and a $35m restructuring charge, producing a net loss of $643.7m. Headcount is down 15% year on year with several hundred more cuts planned, and smaller-customer contract value fell 12%. Management said software-sector softness "doesn't get better near term" and is modelling no recovery. A securities class action is pending, with a lead-plaintiff deadline of 24 August.
One piece is growing: the Operations segment, which sells data by consumption rather than by seat, grew contract value 20%. On cash measures the stock is genuinely cheap — 1.13x trailing gross profit and a 37.6% free-cash-flow yield — but consensus models revenue declining again in 2027.
Paylocity sits between them. Fiscal 2026 revenue of $1.771bn grew 11% on a client base up roughly 7%, with operating margin at 21.8% against 19.1%. Then it guided fiscal 2027 to $1.880-1.895bn, about 7%. Seats are still being added; the price per platform is what is decelerating.
Nothing here is distinctive
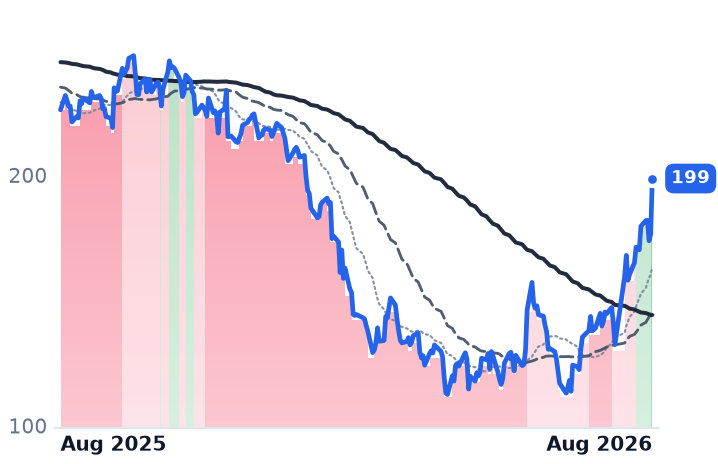
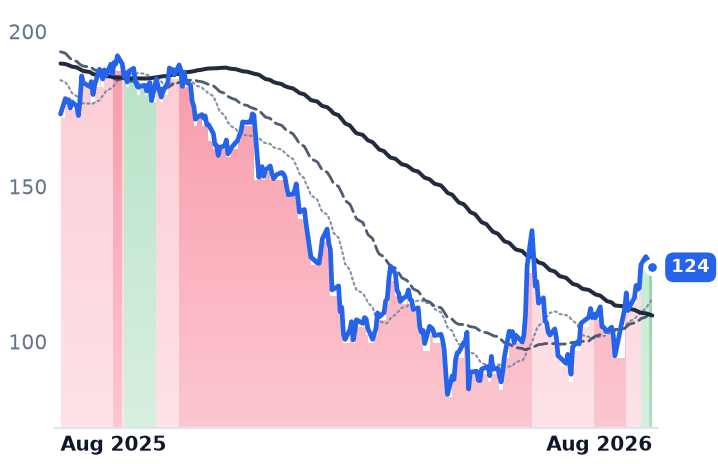
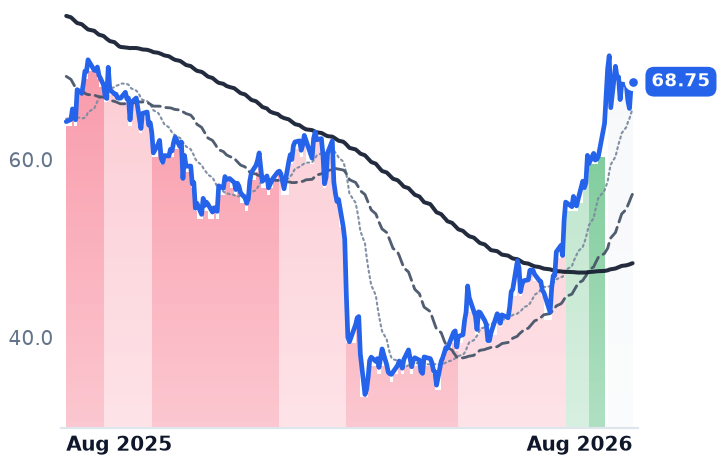
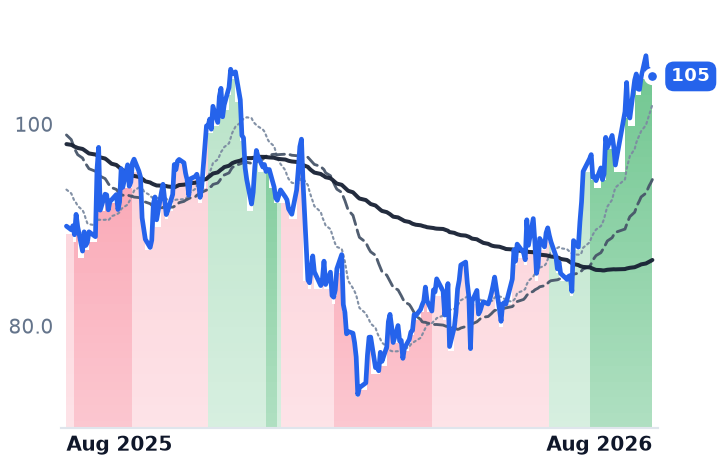
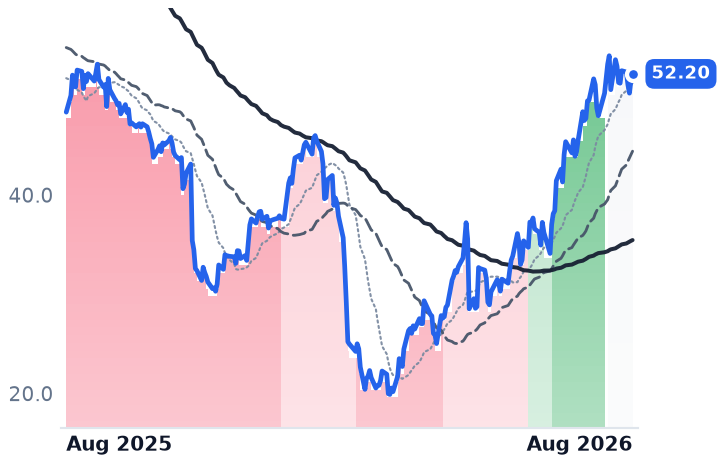
The wider software complex moved at least as much. Over the same window Workday rose 40%, Atlassian 77%, ServiceNow 18% and Salesforce 18%, helped by soft producer-price data that carried the S&P 500 to a record close on 13 August. The bear case that mattered most — that falling rates would gut interest earned on customer payroll floats — is not currently operative: the Federal Reserve's target range stands at 3.5-3.75% with a pause the baseline for the rest of 2026, ADP is guiding client-funds interest revenue up, and Paycom's outlook assumes stable rates. The employment base is likewise intact: ADP's data showed private employers adding 122,000 jobs in May and 98,000 in June.
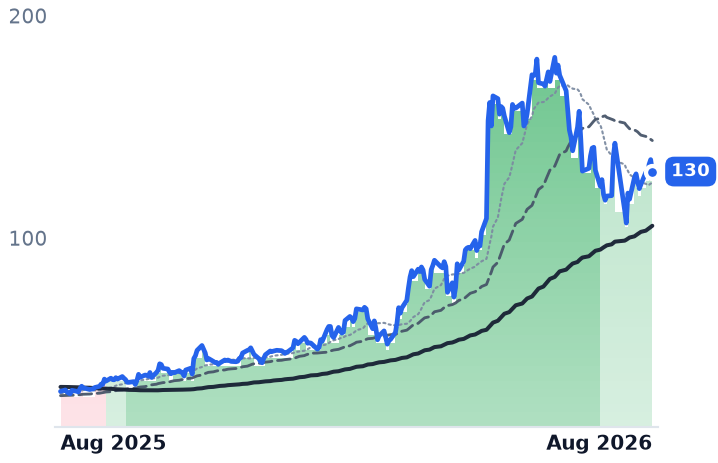
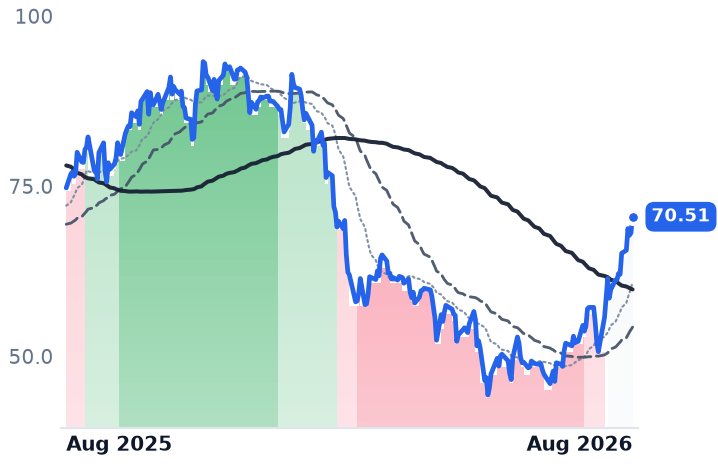
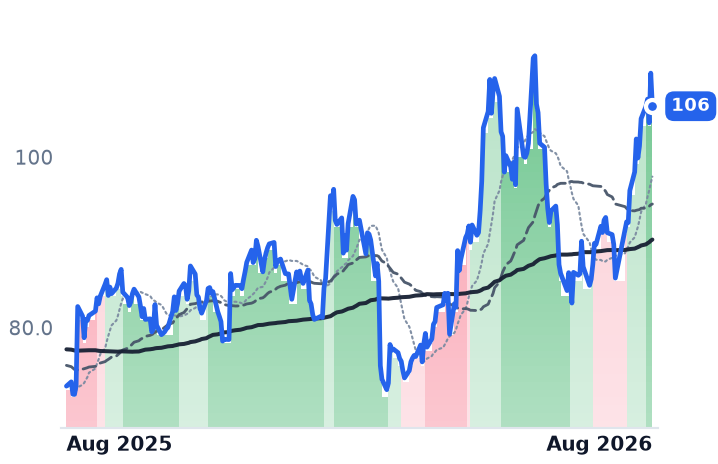
On price per dollar of gross profit — the fair comparison across very different gross margins — Paycom trades at 5.56x forward and Paylocity 6.07x, against 22.56x for DigitalOcean, the developer cloud these applications run above. DigitalOcean is guiding roughly 30.5% revenue growth this year. The HR names are guiding 7-8%. The gap in price is doing exactly what the gap in growth asks of it.
The setup
Where it stands — Three HR and sales-software names are up about 30% in a month on one earnings beat and a broad software re-rating. Would confirm — Paycom recurring revenue growth holding at or above 11% year on year in the third quarter. Would invalidate — Paycom cutting its $2.197bn revenue floor, or Paylocity tracking below its $1.880bn fiscal-2027 guide. Watch next — ZoomInfo's class-action lead-plaintiff deadline, 24 August; Paycom's third-quarter results in early November. Valuation — Paycom 23.1x trailing and 18.2x forward earnings, versus about 12.6x forward on its 16 July price.