

Digital Realty and Equinix Rallied on Their Own Numbers, Not a Rate Cut That Never Came
Hypothesis Opus 5 · Research Opus 5 · Writing Opus 5 · Prompt v1.4
The two listed landlords of the artificial-intelligence buildout have added roughly 10% between them in a month, and the easy explanation — long-duration real estate repricing on hopes of Federal Reserve cuts — does not survive contact with the evidence. The Fed held on 29 July, the 10-year Treasury yield rose to about 4.67%, and the rest of the property complex went nowhere: cell-tower owner Crown Castle fell, so did warehouse landlord Prologis and Realty Income.
What moved these two was their own quarters. Digital Realty reported a record $1.9bn leasing backlog and raised full-year core funds from operations (FFO) guidance to $8.15-$8.20 a share; Equinix called its raise the largest in company history and now sees 2026 adjusted funds from operations (AFFO) of $42.69-$43.29 a share.
The odd part: the multiple never expanded. Both trade near where they did in May on sales, on a bigger base.
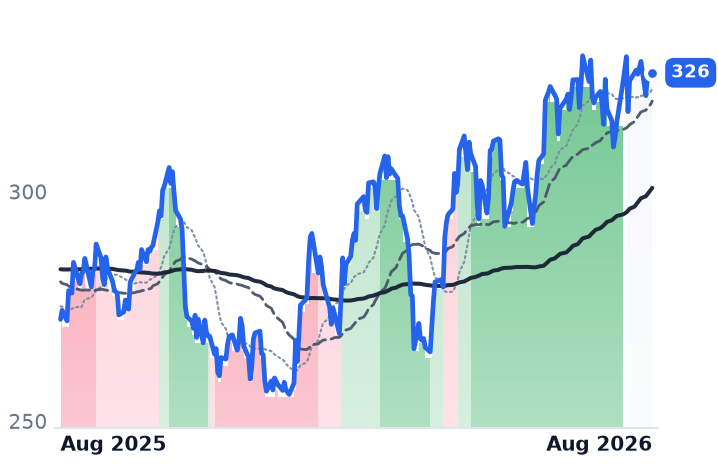
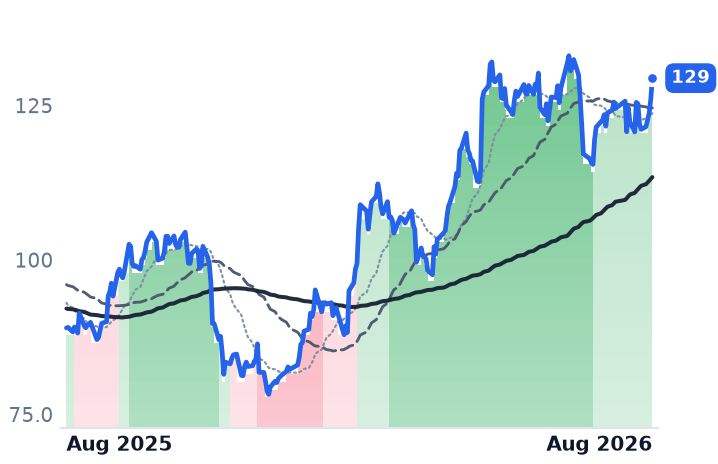
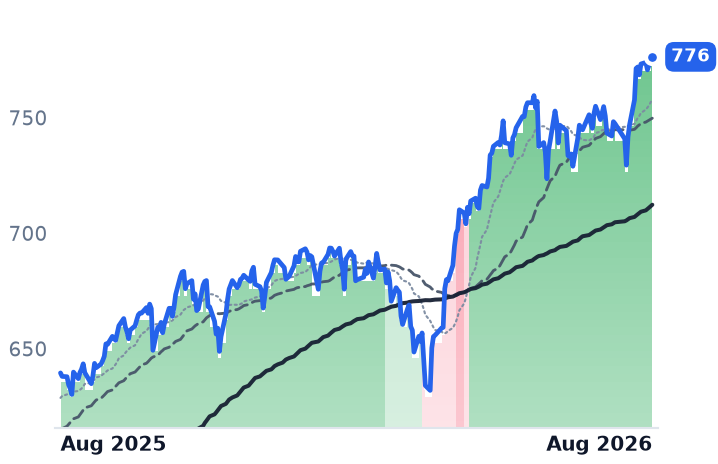
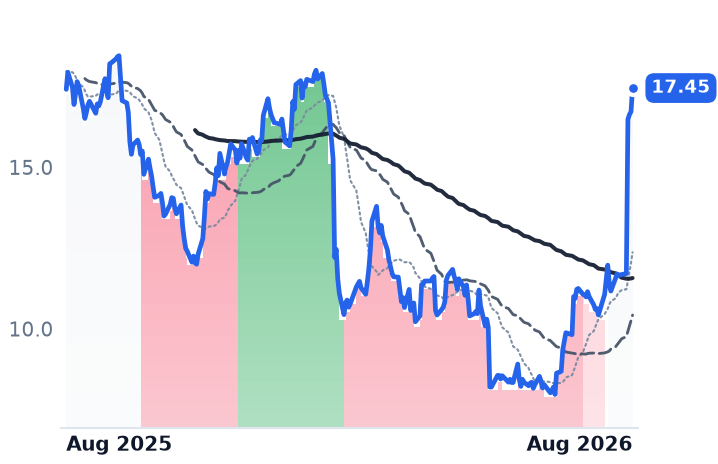
| Ticker | Company | Segment | Trend · 13mo | 30D | 1Y |
|---|---|---|---|---|---|
| The subject · what this brief is about | |||||
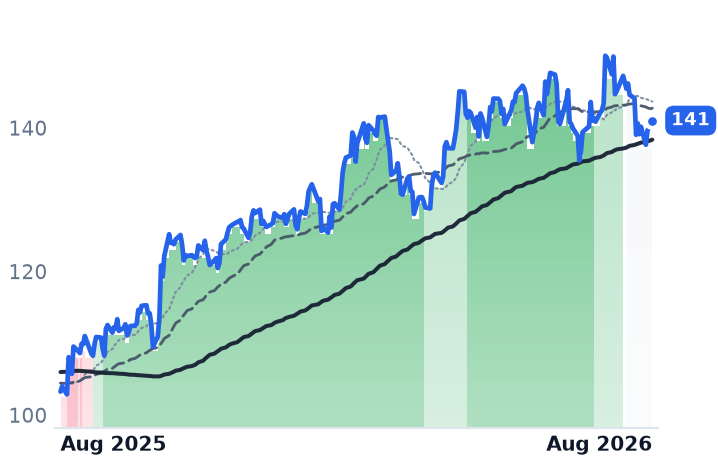
DLR | Digital Realty Trust | Data Center & Colocation | 🟢 Cont. Bull | +13.7% | +23.1% |
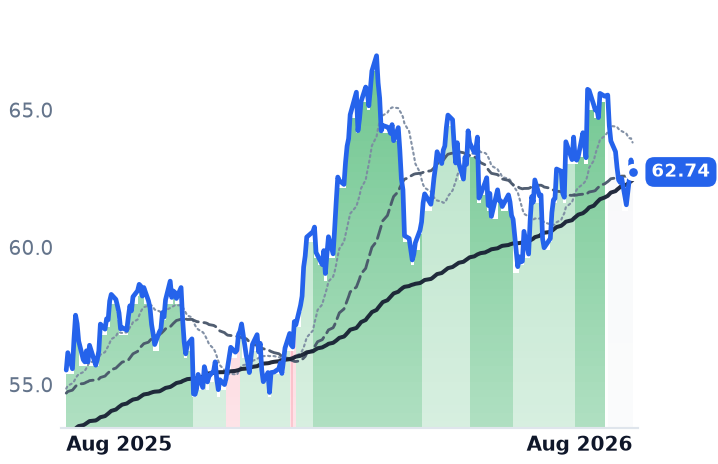
EQIX | Equinix | Data Center & Colocation | 🌱 Emerging Bull | +7.8% | +44.7% |
| Compared against · context, not the story | |||||
AMT | American Tower | Wireless & Fiber Infrastructure | 🔴 Cont. Bear | +4.1% | −11.2% |
CCI | Crown Castle | Wireless & Fiber Infrastructure | 🔴 Cont. Bear | −4.4% | −22.1% |
PLD | Prologis | Logistics & Distribution | 🟢 Cont. Bull | −1.7% | +36.6% |
O | Realty Income | Net Lease Retail | 🟢 Cont. Bull | −0.8% | +13.0% |
SPG | Simon Property | Open-Air Shopping Centers | 🟢 Cont. Bull | −1.1% | +32.1% |
WELL | Welltower | Seniors Housing & Assisted Living | 🟢 Cont. Bull | +1.0% | +47.1% |
PSA | Public Storage | Self-Storage | 🌱 Emerging Bull | +3.6% | +19.7% |
IRM | Iron Mountain Incorporated | Records & Information Management | 🟢 Cont. Bull | +4.8% | +45.4% |
SPY | State Street SPDR S&P 500 ETF Trust | Asset Management | 🟢 Cont. Bull | +2.9% | +21.4% |
NIQ | NIQ Global Intelligence | Business Process & Analytics Services | 🔴 Cont. Bear | +58.8% | +0.2% |
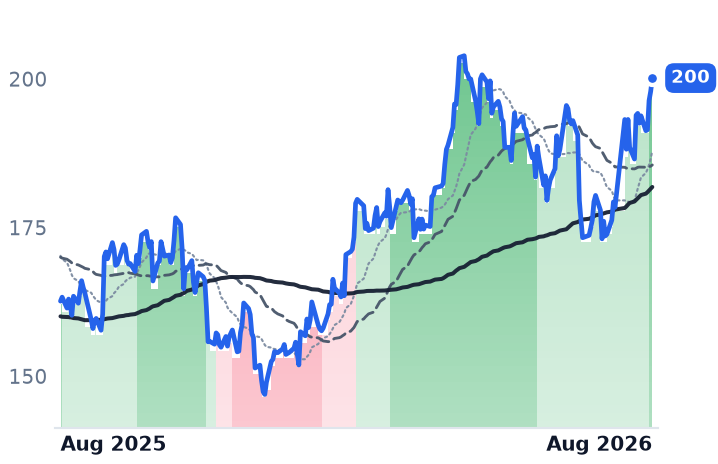
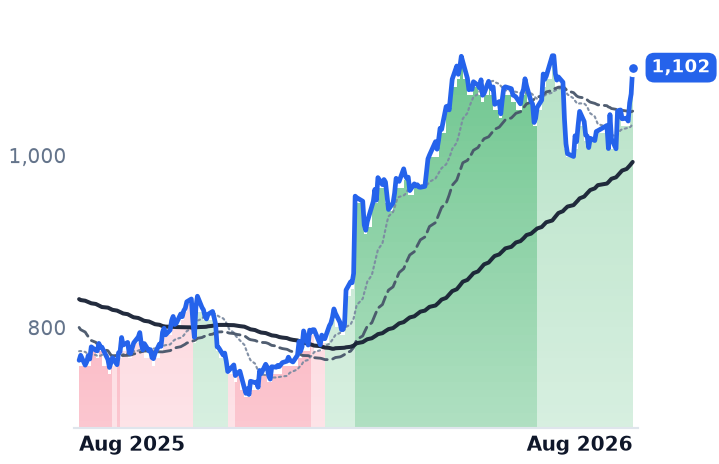
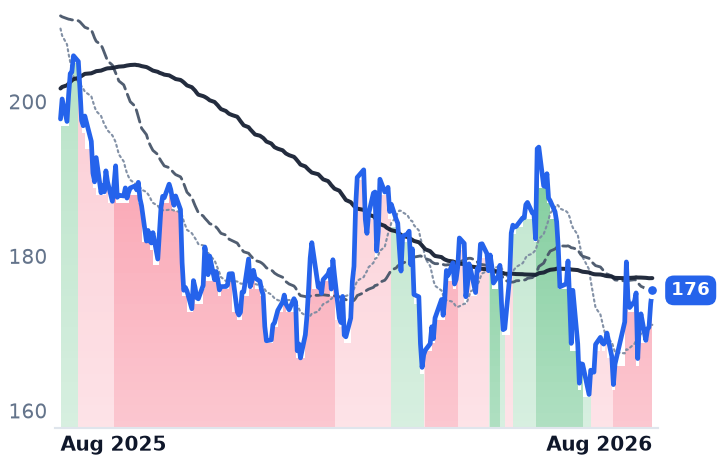
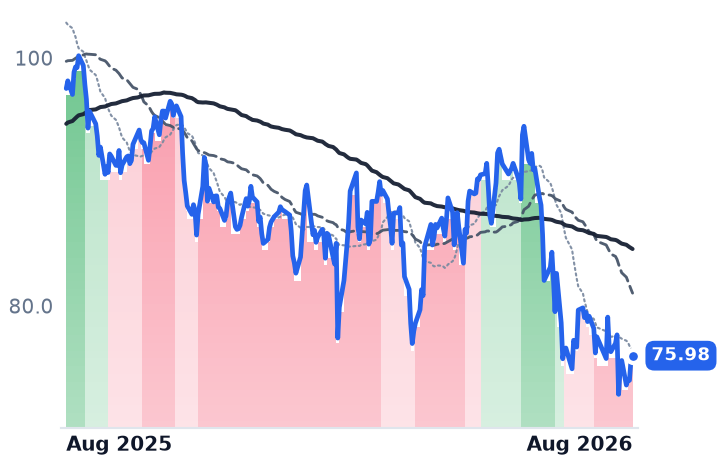
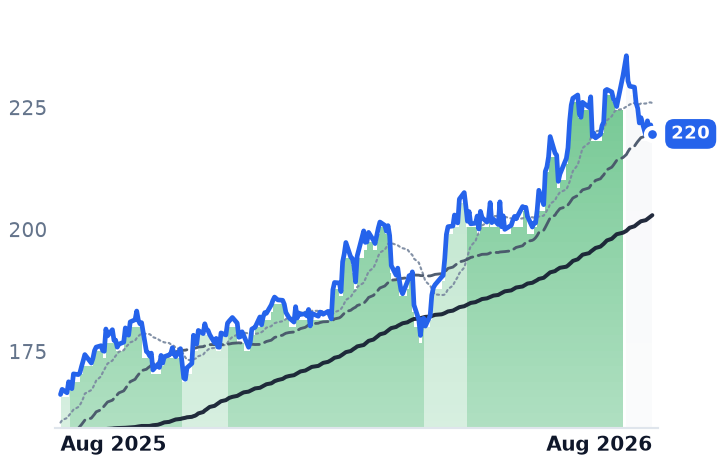
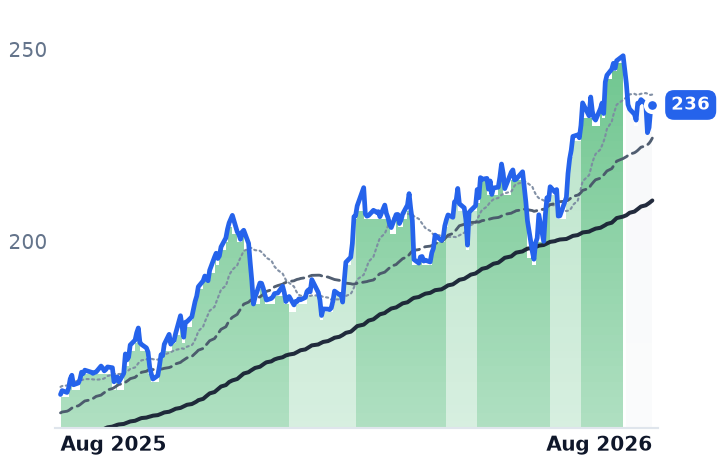
12-month price & trend
| Ticker | Mkt cap | P/E | P/E fwd | P/S | P/S fwd | P/GP | P/GP fwd | EV/EBITDA | FCF yld |
|---|---|---|---|---|---|---|---|---|---|
DLR | $74.1B | 92.2x | 76.5x | 10.8x | 10.5x | 78.5x | 76.6x | 26.5x | 1.8% |
EQIX | $108.7B | 70.6x | 64.1x | 11.1x | 10.6x | 21.4x | 20.5x | 29.2x | 1.3% |
AMT | $80.4B | 23.7x | 25.1x | 7.3x | 7.3x | 10.0x | 10.0x | 17.6x | 4.9% |
| Ticker | Mkt cap | P/E | P/E fwd | P/S | P/S fwd | P/GP | P/GP fwd | EV/EBITDA | FCF yld |
|---|---|---|---|---|---|---|---|---|---|
CCI | $33.0B | 30.6x | 38.2x | 7.9x | 8.2x | 12.6x | 12.9x | 20.4x | 7.3% |
PLD | $131.0B | 35.2x | 42.1x | 14.6x | 15.1x | 33.8x | 34.7x | 21.4x | 3.8% |
O | $57.0B | 49.4x | 37.1x | 9.6x | 10.0x | 14.0x | 14.6x | 20.8x | 7.1% |
| Ticker | Mkt cap | P/E | P/E fwd | P/S | P/S fwd | P/GP | P/GP fwd | EV/EBITDA | FCF yld |
|---|---|---|---|---|---|---|---|---|---|
SPG | $65.0B | 13.8x | 30.3x | 9.8x | 10.0x | 11.5x | 11.7x | 12.1x | 5.0% |
WELL | $150.9B | 106.3x | 79.5x | 13.0x | 11.1x | 33.5x | 28.6x | 63.0x | 1.7% |
PSA | $51.3B | 27.0x | 29.5x | 10.6x | 10.2x | 17.4x | 16.8x | 18.9x | 6.0% |
| Ticker | Mkt cap | P/E | P/E fwd | P/S | P/S fwd | P/GP | P/GP fwd | EV/EBITDA | FCF yld |
|---|---|---|---|---|---|---|---|---|---|
IRM | $36.0B | 86.5x | 50.4x | 4.8x | 4.5x | 8.8x | 8.3x | 15.8x | -1.8% |
SPY | $773.0B | — | — | — | — | — | — | — | — |
NIQ | $3.4B | n/m | 11.8x | 0.8x | 0.8x | 1.5x | 1.5x | 8.7x | 2.6% |
Consensus projections
| Ticker | FY2026E | FY2027E | FY2028E | |
|---|---|---|---|---|
DLR | Revenue | +16.0% | +11.1% | +14.1% |
| EPS | −28.5% | −3.7% | +25.8% | |
EQIX | Revenue | +11.0% | +10.7% | +11.2% |
| EPS | +16.6% | +9.5% | +9.5% | |
AMT | Revenue | +4.0% | +3.3% | +5.9% |
| EPS | +34.5% | +1.4% | +10.5% | |
CCI | Revenue | −5.0% | +1.3% | +2.3% |
| EPS | +112.8% | +44.5% | +5.5% | |
PLD | Revenue | +6.7% | +6.3% | +2.8% |
| EPS | +21.3% | +12.3% | +8.1% | |
O | Revenue | +7.5% | +6.2% | +7.9% |
| EPS | +36.5% | +8.7% | +2.9% | |
SPG | Revenue | +12.9% | +3.2% | +1.4% |
| EPS | −4.8% | +3.8% | +9.0% | |
WELL | Revenue | +31.6% | +12.3% | +17.7% |
| EPS | +47.3% | +20.1% | +14.3% | |
PSA | Revenue | +4.4% | +7.5% | +3.3% |
| EPS | +7.5% | −0.2% | +4.3% | |
IRM | Revenue | +16.2% | +8.8% | +7.7% |
| EPS | +20.1% | +9.3% | +16.4% | |
NIQ | Revenue | +7.1% | +5.1% | +5.0% |
| EPS | +220.5% | +23.4% | +20.2% |
Forward fiscal years only. Blank means no analyst coverage for that year.
Two companies own most of the listed floor space the artificial-intelligence buildout actually runs in. Digital Realty leases wholesale halls — big, powered, contracted by the megawatt — to cloud and enterprise tenants across 309 facilities. Equinix rents smaller footprints inside interconnection hubs where networks and clouds physically plug into one another, to more than 10,000 customers. Both spent the summer telling investors that demand got better, not worse.
Digital Realty's second quarter, reported on 23 July, carried a record backlog of signed-but-not-commenced leases of $1.9bn at 100% share — close to 30% of the rent already flowing through its data centers. Equinix, six days later, lifted 2026 AFFO per share guidance to $42.69-$43.29 and added a three-year frame through 2029 of 10-13% annual revenue growth. Both raised outlooks on leasing volume and pricing together.
The rate explanation does not hold
Data-center REITs are long-duration assets, so a month like this usually invites a macro story. It doesn't fit. The Federal Reserve held rates steady on 29 July with three dissents, and the 10-year Treasury yield climbed 7 basis points to 4.67%. Over the same 30 days American Tower, which leases space on cell towers, rose 3.6%, no better than the S&P 500. Crown Castle, its domestic-tower peer, fell 4.8%. Prologis, the largest warehouse landlord, slipped 1.7%, and Realty Income, which owns single-tenant retail, fell 4.6%. Whatever lifted these two did not lift the asset class.
The shape of the move matters as much as its size. Digital Realty dropped 11.4% between late June and 2 July after agreeing to pay Blackstone $3.5bn for its stakes in three Northern Virginia hyperscale campuses, 288 megawatts in all, two-thirds of it settled in newly issued shares — the stock fell about 5% premarket on the news. Bank of America then cut it to Neutral, lowering its target to $170 from $210 on the argument that the scale and location of its development pipeline are a poor fit for AI demand. The 8.3% leg that followed earnings a fortnight later erased that. Over three months, Digital Realty is up 2.0% and Equinix 1.5%.
What the businesses did
Digital Realty's revenue growth has accelerated four quarters running, from 10.2% year over year to 28.9% in the June quarter, and operating margin went from 8.8% to 25.9% over the same stretch. Renewals repriced upward: cash re-leasing spreads topped 25%, and on leases larger than a megawatt they hit 66.7%. It now has $20bn under construction, 1.4 gigawatts, 63% pre-leased at an average stabilized yield of 11.5%, with leverage at 4.7x debt to EBITDA against a 5.5x target.
Equinix is the slower, denser business. Revenue growth accelerated from 5.2% to 16.4%, gross margin rose to 53.1%, and second-quarter operating income grew 34.6% — real operating leverage. AFFO per share rose 18%, churn ran at 1.8%, below its own 2-2.5% target, and it added a record 9,700 net interconnections.
Two cautions sit inside those same disclosures. Equinix told investors its blended cost of capital will rise about 150 basis points while cash-on-cash yields on new growth capital fall from 27% toward the mid-20s, with leverage climbing a full turn to roughly 4.6x on $5-7bn of annual capital spending. And Digital Realty's incremental leasing is narrow: first-half hyperscale signings above $1.4bn already exceeded all of 2025, and two leases signed after quarter-end account for $410m of annualized rent between them. Customer concentration is the standing risk on this business, and it grew this quarter.
The multiple did not move
Ignore the price-to-earnings figures on these two — 92x trailing for Digital Realty, 71x for Equinix. Property depreciation swamps REIT net income; consensus has Digital Realty's earnings per share falling to $2.62 in 2026 while FFO grows double digits. On the measure that matters, Digital Realty trades near 24.5x 2026 core FFO excluding promote income, the top of its own 22-25x historical range, and Equinix near 25.6x forward AFFO, mid-range against 25-30x.
More telling: neither got more expensive during the advance. Digital Realty's trailing price-to-sales is 10.81, against 11.14 in mid-May; Equinix's is 11.07 against 11.17. The shares are roughly where they were three months ago while the revenue and guidance base underneath them grew. That is the opposite of a multiple-expansion trade, and it is the reason Bank of America's bear case remains live rather than disproved — the market has simply not paid up for the better numbers yet.
The setup
Where it stands — A month's gain that reverses a deal-driven selloff, backed by record leasing at both landlords and no multiple expansion. Would confirm — Digital Realty's backlog holding above $1.9bn at 100% share in the third quarter, with commencements on schedule. Would invalidate — Equinix's cash-on-cash yields on new capital falling below the mid-20s, or churn returning above its 2.5% ceiling. Watch next — Third-quarter results, due late October, and whether Digital Realty lifts 2026 development capital spending above $4.75bn again. Valuation — Digital Realty ~24.5x 2026 core FFO against a 22-25x range; Equinix ~25.6x forward AFFO against 25-30x.