

Gas Pipeline Fundamentals Have Never Been Stronger. The Shares Fell Anyway.
Hypothesis Opus 5 · Research Opus 5 · Writing Opus 5 · Prompt v1.3
In the five weeks to 12 August every large North American natural-gas pipeline operator raised or reaffirmed its 2026 profit forecast, signed data-center supply deals, or both — Energy Transfer contracted roughly 900,000 thousand cubic feet a day of gas to three Oracle data centres, Williams closed a $5.34bn joint venture with Blackstone over five power plants including one feeding a Meta campus, and federal regulators certificated Kinder Morgan's $1.7bn, 2.1 billion-cubic-feet-a-day Mississippi Crossing line on 31 July.
The shares mostly fell anyway. The businesses do not explain it: Kinder Morgan grew adjusted earnings before interest, tax, depreciation and amortisation 12% and cut leverage to 3.6 times, and Williams raised its 2025-30 growth target to 11%-plus from 10%. Regulated utilities fell harder over the same month, with the 10-year Treasury yield at 4.69%.
Valuation is where the group splits — and Texas has just frozen 49.8 gigawatts of data-centre grid hookups.
| Ticker | Company | Segment | Trend | 30D | 1Y |
|---|---|---|---|---|---|
| The subject · what this brief is about | |||||
KMI | Kinder Morgan | Natural Gas Pipelines & Transmission | 🟢 Cont. Bull | −2.5% | +20.6% |
WMB | The Williams Companies | Natural Gas Pipelines & Transmission | 🟢 Cont. Bull | −3.1% | +30.3% |
ET | Energy Transfer | Natural Gas Pipelines & Transmission | 🌱 Emerging Bull | +4.1% | +24.1% |
DTM | DT Midstream | Natural Gas Pipelines & Transmission | 🟢 Cont. Bull | −8.1% | +34.0% |
TRP | TC Energy | Natural Gas Pipelines & Transmission | 🟢 Cont. Bull | −7.0% | +26.2% |
TRP.TO | TC Energy | Oil & Gas Midstream | 🟢 Cont. Bull | −7.8% | +32.0% |
PPL.TO | Pembina Pipeline | Oil & Gas Midstream | 🟢 Cont. Bull | −3.1% | +42.7% |
| Compared against · context, not the story | |||||
NI | NiSource | Natural Gas Distribution | 🟢 Cont. Bull | −9.8% | −0.1% |
SRE | Sempra | US Electric & Gas Utilities | ⚠️ Emerging Bear | −8.2% | +6.5% |
AEP | American Electric Power | Vertically Integrated Utilities | 🟢 Cont. Bull | −7.9% | +11.6% |
ATO | Atmos Energy | Natural Gas Distribution | ⚠️ Emerging Bear | −5.1% | +3.1% |
SO | The Southern | Vertically Integrated Utilities | 🟢 Cont. Bull | −4.0% | −0.4% |
NEE | NextEra Energy | Vertically Integrated Utilities | ⚠️ Emerging Bear | −4.6% | +20.6% |
DUK | Duke Energy | Vertically Integrated Utilities | 🟢 Cont. Bull | −2.4% | +0.7% |
EPD | Enterprise Products Partners | Crude Oil & NGL Pipelines | 🟢 Cont. Bull | +0.6% | +23.6% |
TRGP | Targa Resources | Natural Gas Gathering & Processing | 🟢 Cont. Bull | −4.8% | +62.6% |
OKE | ONEOK | Natural Gas Gathering & Processing | 🌱 Emerging Bull | +0.2% | +25.9% |
LNG | Cheniere Energy | LNG Export & Infrastructure | 🌱 Emerging Bull | +1.8% | +17.2% |
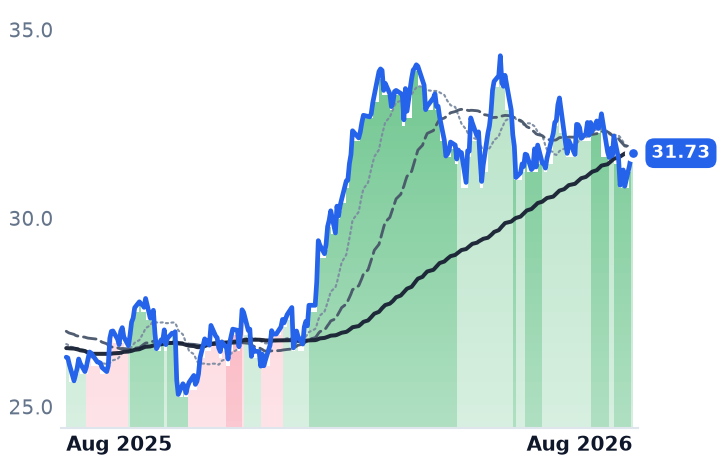
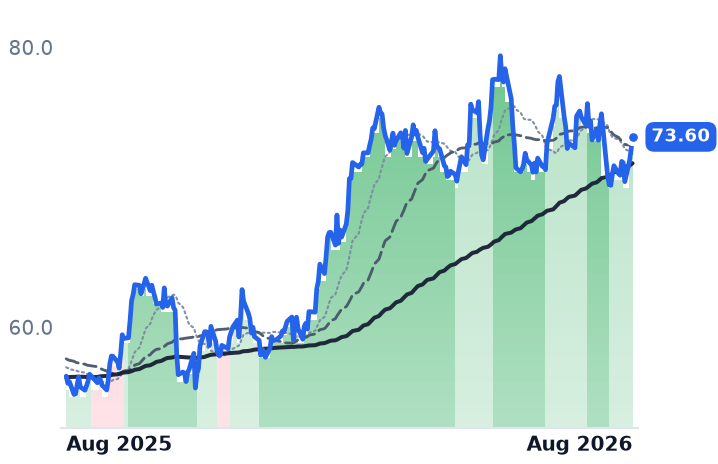
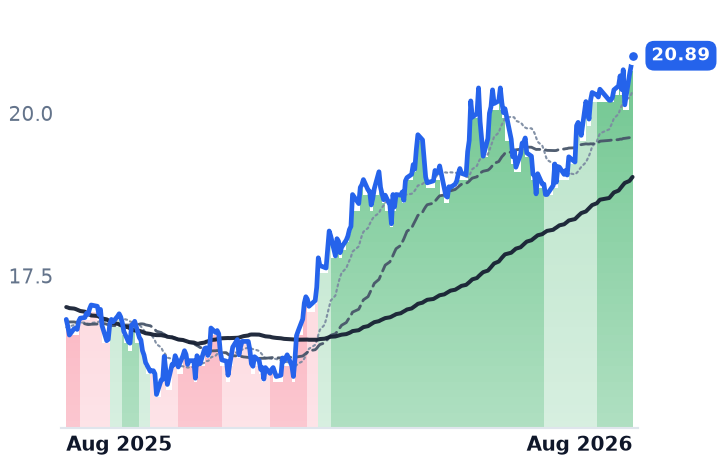
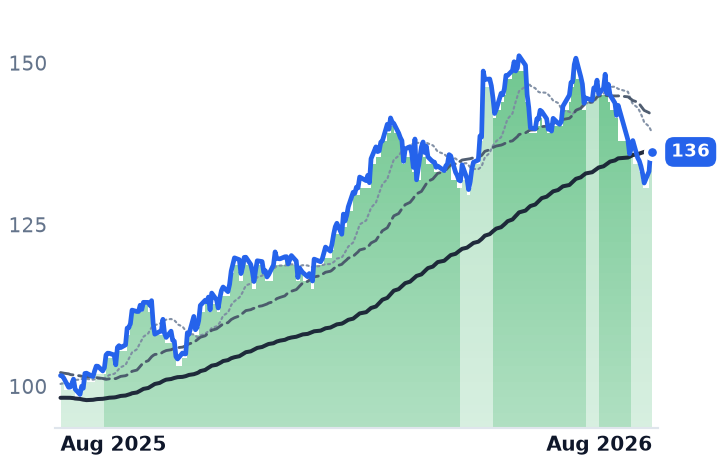
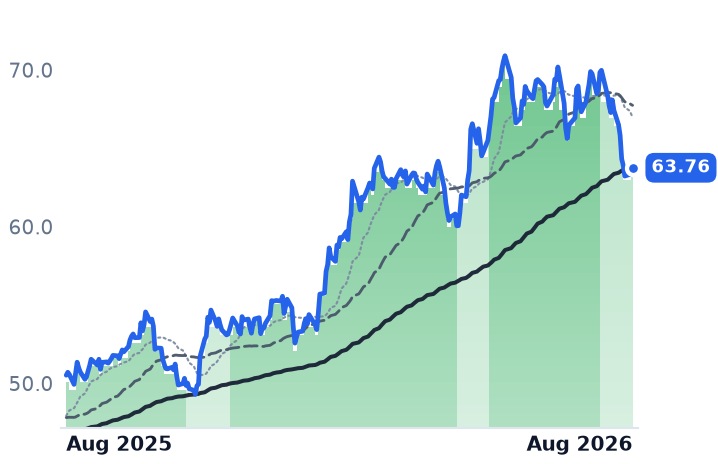
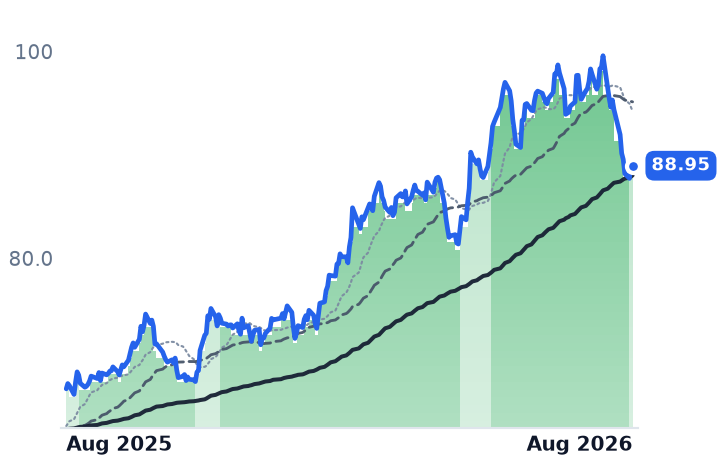
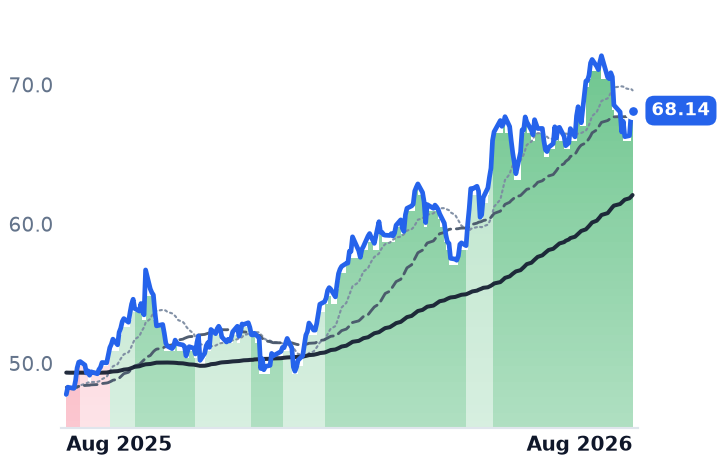
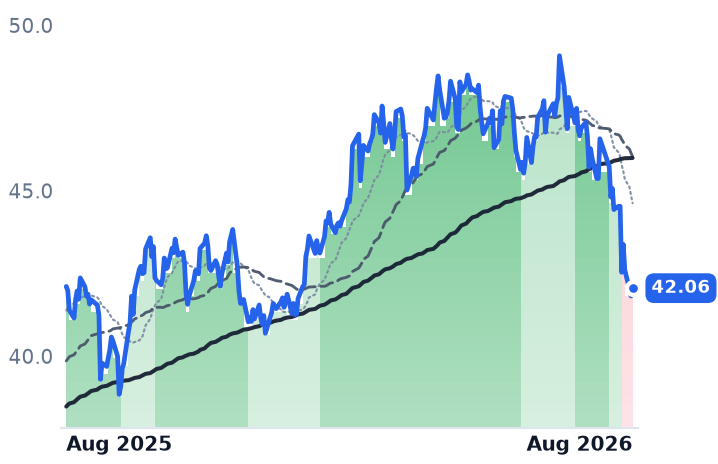
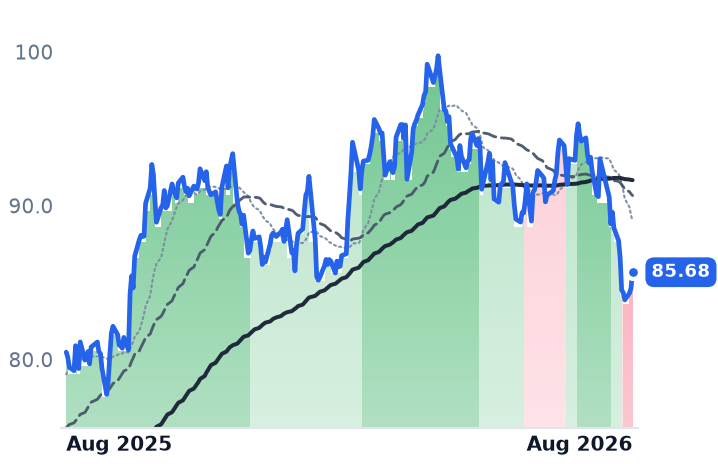
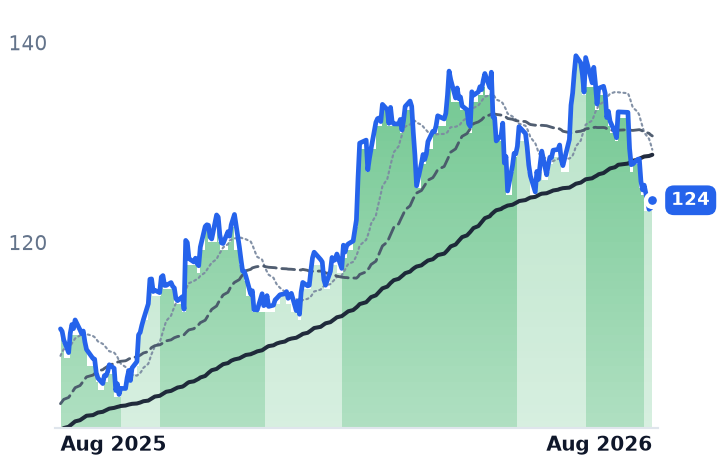
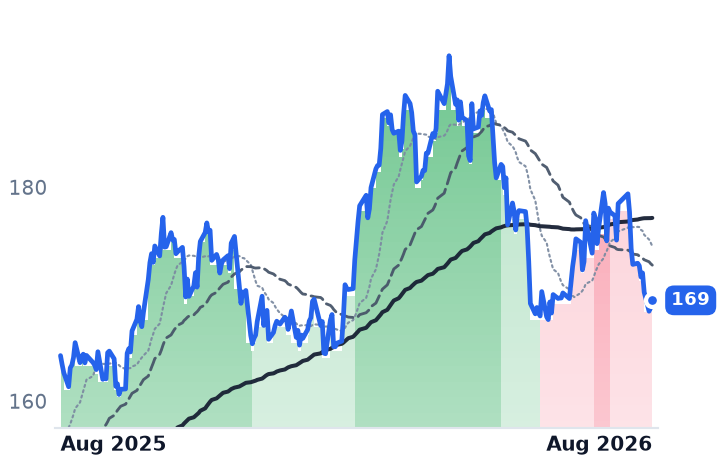
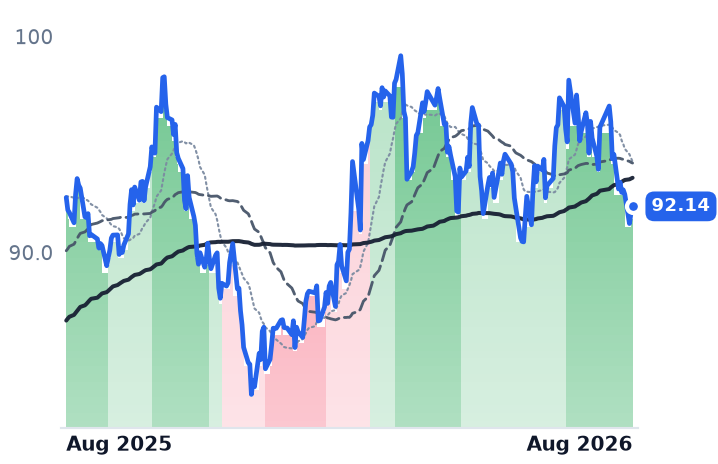
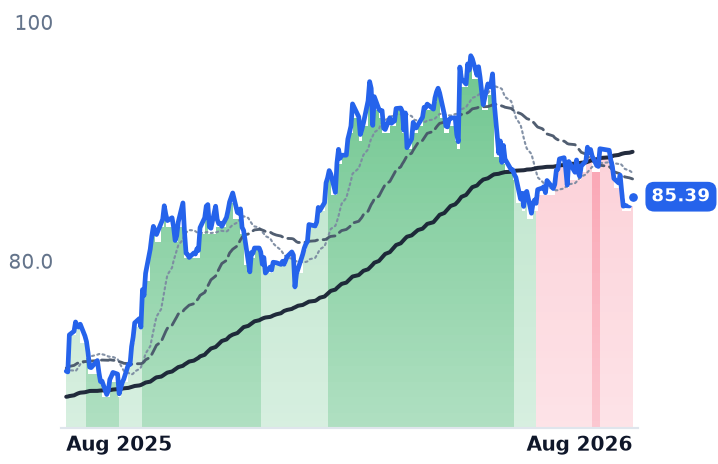
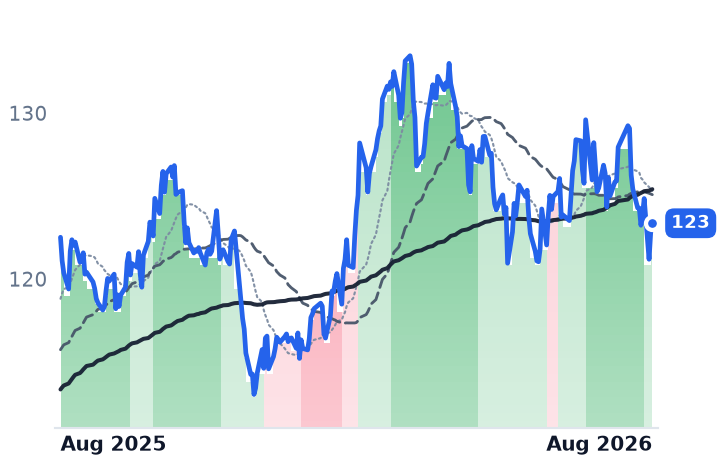
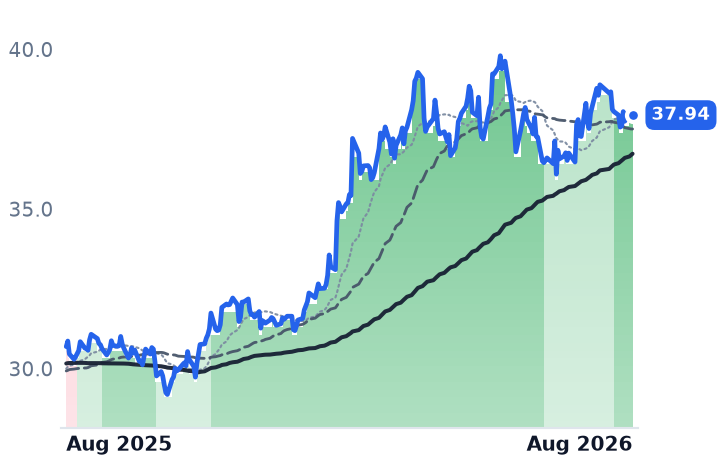
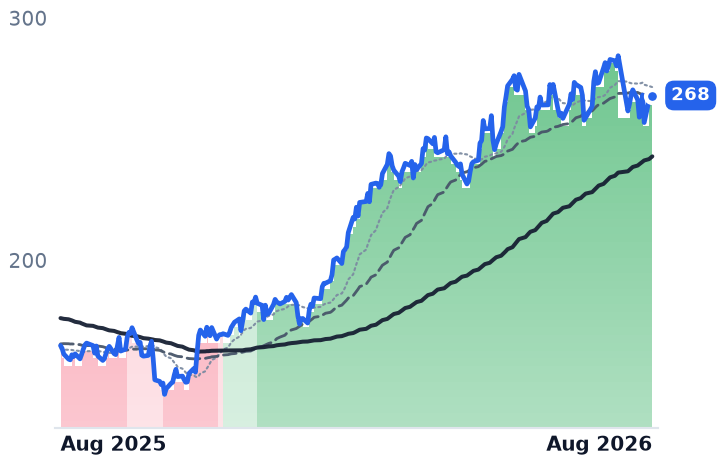
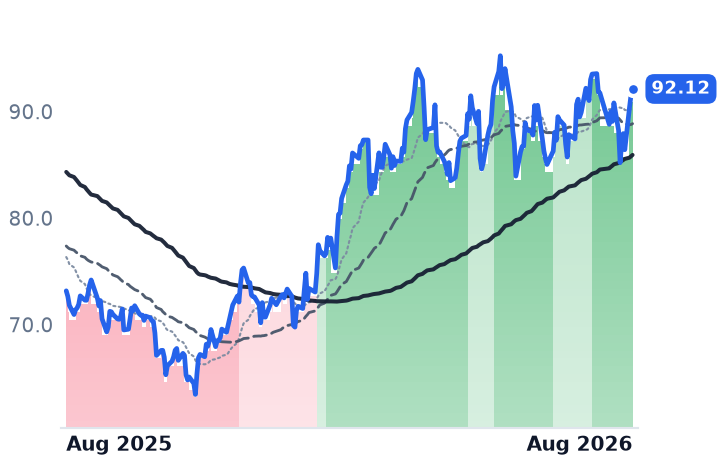
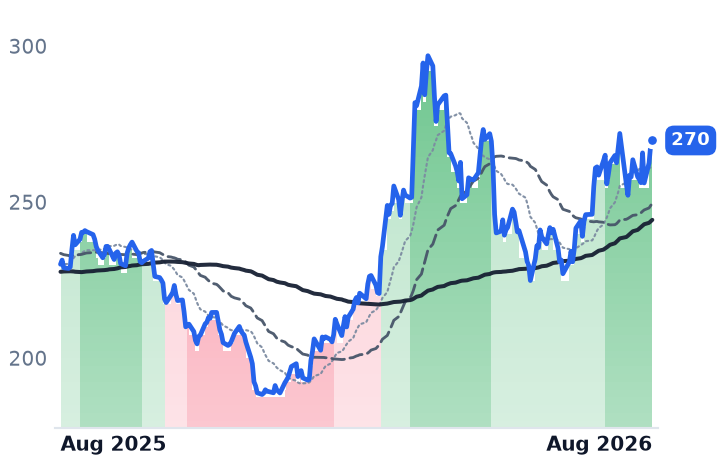
12-month price & trend
| Ticker | Mkt cap | P/E | P/E fwd | P/S | P/S fwd | P/GP | P/GP fwd | EV/EBITDA | FCF yld |
|---|---|---|---|---|---|---|---|---|---|
KMI | $70.7B | 20.3x | 20.9x | 3.9x | 3.9x | 7.2x | 7.1x | 12.7x | 5.5% |
WMB | $90.1B | 29.2x | 30.4x | 7.4x | 7.3x | 10.0x | 10.0x | 16.2x | -0.2% |
ET | $72.1B | 13.0x | 13.4x | 0.7x | 0.7x | 2.9x | 2.7x | 9.7x | 7.2% |
| Ticker | Mkt cap | P/E | P/E fwd | P/S | P/S fwd | P/GP | P/GP fwd | EV/EBITDA | FCF yld |
|---|---|---|---|---|---|---|---|---|---|
DTM | $13.9B | 29.6x | 28.3x | 10.6x | 10.4x | 16.8x | 16.4x | 15.7x | 3.5% |
TRP | $66.2B | 26.6x | 16.9x | 5.8x | 4.1x | 11.2x | 8.0x | 13.8x | 4.4% |
TRP.TO | $92.4B | 26.6x | 23.9x | 5.8x | 5.8x | 11.2x | 11.3x | 13.8x | 4.4% |
| Ticker | Mkt cap | P/E | P/E fwd | P/S | P/S fwd | P/GP | P/GP fwd | EV/EBITDA | FCF yld |
|---|---|---|---|---|---|---|---|---|---|
PPL.TO | $39.6B | 24.0x | 22.0x | 5.0x | 4.6x | 13.4x | 12.3x | 14.2x | 5.2% |
NI | $20.2B | 22.1x | 20.4x | 2.9x | 2.8x | 5.8x | 5.6x | 11.8x | -5.4% |
SRE | $54.8B | 23.0x | 16.4x | 4.0x | 4.0x | 12.3x | 12.3x | 17.8x | -10.8% |
| Ticker | Mkt cap | P/E | P/E fwd | P/S | P/S fwd | P/GP | P/GP fwd | EV/EBITDA | FCF yld |
|---|---|---|---|---|---|---|---|---|---|
AEP | $68.1B | 18.6x | 19.7x | 3.1x | 2.9x | 7.6x | 7.2x | 13.7x | 9.1% |
ATO | $28.3B | 20.0x | 20.1x | 5.7x | 5.5x | 9.4x | 9.0x | 14.3x | -7.1% |
SO | $106.6B | 22.2x | 20.2x | 3.5x | 3.5x | 8.1x | 8.0x | 12.7x | 2.4% |
| Ticker | Mkt cap | P/E | P/E fwd | P/S | P/S fwd | P/GP | P/GP fwd | EV/EBITDA | FCF yld |
|---|---|---|---|---|---|---|---|---|---|
NEE | $194.7B | 23.8x | 23.1x | 6.9x | 6.3x | 10.3x | 9.4x | 17.3x | 1.2% |
DUK | $97.3B | 18.7x | 18.6x | 2.9x | 2.9x | 4.3x | 4.2x | 11.6x | 1.6% |
EPD | $81.7B | 13.1x | 13.0x | 1.4x | 1.4x | 10.5x | 10.6x | 7.9x | 1.8% |
| Ticker | Mkt cap | P/E | P/E fwd | P/S | P/S fwd | P/GP | P/GP fwd | EV/EBITDA | FCF yld |
|---|---|---|---|---|---|---|---|---|---|
TRGP | $55.1B | 24.4x | 23.6x | 3.3x | 2.8x | 9.0x | 7.6x | 15.5x | 1.1% |
OKE | $54.5B | 14.9x | 15.1x | 1.4x | 1.3x | 6.3x | 6.0x | 11.0x | 5.3% |
LNG | $54.1B | 42.0x | — | 2.6x | 2.4x | 7.1x | 6.7x | 12.0x | 8.4% |
Consensus projections
| Ticker | FY2026E | FY2027E | FY2028E | |
|---|---|---|---|---|
KMI | Revenue | +8.2% | +1.9% | +5.8% |
| EPS | +18.1% | +0.8% | +8.6% | |
WMB | Revenue | +7.4% | +9.9% | +12.7% |
| EPS | +14.1% | +4.5% | +18.3% | |
ET | Revenue | +35.3% | +1.9% | +4.9% |
| EPS | +16.7% | +3.6% | +7.4% | |
DTM | Revenue | +7.4% | +5.4% | +10.1% |
| EPS | +9.7% | +5.9% | +12.0% | |
TRP | Revenue | +6.7% | +4.4% | +5.3% |
| EPS | +7.3% | +5.4% | +6.2% | |
TRP.TO | Revenue | +5.2% | +4.4% | +5.3% |
| EPS | +5.8% | +5.4% | +6.2% | |
PPL.TO | Revenue | +9.3% | +4.2% | +4.6% |
| EPS | +15.8% | +2.2% | +5.3% | |
NI | Revenue | +15.3% | +5.7% | +6.3% |
| EPS | +9.2% | +9.4% | +10.1% | |
SRE | Revenue | −3.3% | −2.0% | +1.8% |
| EPS | +11.5% | +8.0% | +8.5% | |
AEP | Revenue | +9.1% | +5.8% | +7.5% |
| EPS | +7.4% | +7.9% | +10.5% | |
ATO | Revenue | +7.0% | +7.8% | +8.8% |
| EPS | +14.2% | +6.9% | +8.5% | |
SO | Revenue | +7.7% | +5.5% | +6.1% |
| EPS | +6.8% | +7.5% | +9.2% | |
NEE | Revenue | +9.0% | +9.3% | +8.6% |
| EPS | +9.4% | +8.8% | +8.4% | |
DUK | Revenue | +5.7% | +4.4% | +4.0% |
| EPS | +6.2% | +6.9% | +7.0% | |
EPD | Revenue | +12.8% | +5.4% | +5.7% |
| EPS | +11.6% | +9.6% | +8.3% | |
TRGP | Revenue | +16.8% | +16.2% | +10.1% |
| EPS | +27.5% | +14.5% | +17.8% | |
OKE | Revenue | +25.2% | −5.2% | +2.7% |
| EPS | +6.0% | +9.1% | +10.8% | |
LNG | Revenue | +11.3% | +6.7% | +3.2% |
| EPS | −141.4% | −349.0% | −9.4% |
Forward fiscal years only. Blank means no analyst coverage for that year.
Over the five weeks to 12 August, the companies that own the pipes carrying America's natural gas reported one of their strongest quarters of the cycle. Kinder Morgan, the Houston operator of roughly 83,000 miles of pipeline and 143 terminals, grew second-quarter adjusted earnings before interest, tax, depreciation and amortisation (EBITDA) 12% and adjusted earnings per share 32%, lifted full-year guidance about 5% above budget and raised its dividend 2%. Gas transport volumes rose 7% and gathering volumes 26%, with its Haynesville shale system up 54%.
Tulsa-based Williams, whose core asset is the Transco line running from the Gulf Coast to New York, raised 2026 adjusted EBITDA guidance to $8.3–8.5bn and lifted its 2025-2030 compound annual growth target to 11%-plus from 10%-plus, having guided 9% in May. Energy Transfer, the Dallas partnership with roughly 31,000 miles of gas pipe, raised full-year guidance to $18.8–19.1bn. Calgary's TC Energy, which moves gas across 93,300 kilometres of line, grew comparable EBITDA 12% and is tracking the upper end of C$11.6–11.8bn. DT Midstream, a Detroit pure-play gas gatherer with just 588 employees, reaffirmed 2026 adjusted EBITDA guidance of $1,155–1,225m. Pembina Pipeline, the Calgary midstream operator moving 3.1m barrels of oil equivalent a day, reiterated C$4.35–4.55bn while noting it trends to the midpoint.
The demand is now contracted, not projected
The data-centre link stopped being a forecast this quarter. Energy Transfer signed long-term agreements with Oracle to supply about 900,000 thousand cubic feet a day to three US data centres and brought its Hugh Brinson line into service. Williams closed a $5.34bn joint venture on 13 July selling Blackstone, Apollo and KKR 49% of five behind-the-meter power projects while keeping control; the first, a 200-megawatt plant serving a Meta campus in New Albany, Ohio, came in on time and on budget in 18 months. And on 31 July the Federal Energy Regulatory Commission (FERC) granted certificates for Kinder Morgan's Mississippi Crossing — 208 miles of large-diameter pipe and up to 2.1 billion cubic feet a day into the Southeast — part of a 3.4 Bcf/d buildout. The single largest permitting risk in the group cleared while the shares were falling. Kinder Morgan's sanctioned backlog is $9.6bn, TC Energy's origination backlog passed $20bn, and DT Midstream took final investment decision on about $300m of Haynesville expansion.
On business momentum the tape CONTRADICTS the fundamentals. The likelier cause sits in the bond market: the 10-year Treasury yield reached 4.69% on 12 August after topping 4.71% the day before, and over the same 30 days regulated utilities fell harder than the pipelines — NiSource -10.7%, Sempra -9.3%, AEP -8.4% — while Energy Transfer actually rose. That is a repricing of long-duration cash flows, not of gas demand.
Where the market is charging most
On valuation the verdict splits, and it splits along capital intensity. Energy Transfer sits at 9.7x trailing enterprise value to EBITDA, 13.0x trailing and 13.4x forward earnings, on a 7.2% free cash flow yield — the cheapest name and the only riser; its advance is CONFIRMED by the numbers, helped by an 78% revenue jump and by scrapping its Lake Charles liquefied natural gas project, which Argus called the first reality check on the US LNG wave. Williams at 16.2x EV/EBITDA, 29.2x trailing and 30.4x forward earnings, and a negative trailing free cash flow yield of -0.24%, and DT Midstream at 15.7x EV/EBITDA and 16.8x price-to-gross-profit — dearest per dollar of gross profit — are the two carrying the biggest data-centre capital programmes and the two falling hardest. Their de-rating is CONFIRMED by valuation. Kinder Morgan at 12.7x EV/EBITDA with leverage down to 3.6 times, and TC Energy at 13.8x with the group's widest trailing-to-forward compression (26.6x to 16.9x), are where business and price most plainly disagree. Consensus 2026 earnings estimates rise across all six, from +7.3% at TC Energy to +18.1% at Kinder Morgan. Pembina is the lone operational blemish: revenue up 15.5% but operating income down 7%.
The tape's own signal was late. Kinder Morgan's 50-day average crossed below its 200-day on 11 August, triggered by a 7 August low of $30.85 — after which it rose three straight sessions. Williams had already stepped down on 28 July and has since recovered 4.5% off its own 7 August low.
The genuine threat is regulatory, not financial. Texas Governor Greg Abbott ordered a pause and audit of grid interconnections covering almost 49.8 gigawatts of data-centre projects, which BNEF says puts about 20% of the US pipeline at risk of delay and up to $8bn of revenue at risk by early 2027. TC Energy chief executive François Poirier called the pushback regional — two or three of roughly 15 states — and said it may move sanctioning timing rather than demand. Kinder Morgan separately flagged tightening compression-equipment supply as turbine capacity shifts toward power generation.
The setup
Where it stands — Six gas pipeline operators raised or held 2026 guidance and won permits while their shares fell alongside rate-sensitive utilities. Would confirm — Kinder Morgan adding at least $1bn to its $9.6bn sanctioned backlog in the second half of 2026, as guided. Would invalidate — Mississippi Crossing, Trident or Williams' Delta Access slipping their stated 2027-2029 in-service dates. Watch next — TC Energy's Crossroads sanctioning decision, expected in the fourth quarter of 2026 at a 5x-7x build multiple. Valuation — Trailing enterprise value to EBITDA spans 9.7x at Energy Transfer to 16.2x at Williams; forward earnings 13.4x to 30.4x.