

Nvidia's $500bn AI MOUs Changed the Narrative for Asset Managers, Not the Numbers
Hypothesis Opus 5 · Research Opus 5 · Writing Opus 5 · Prompt v1.3
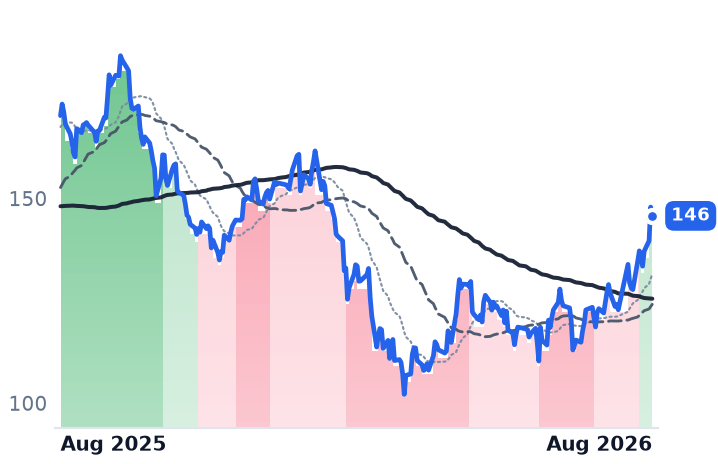
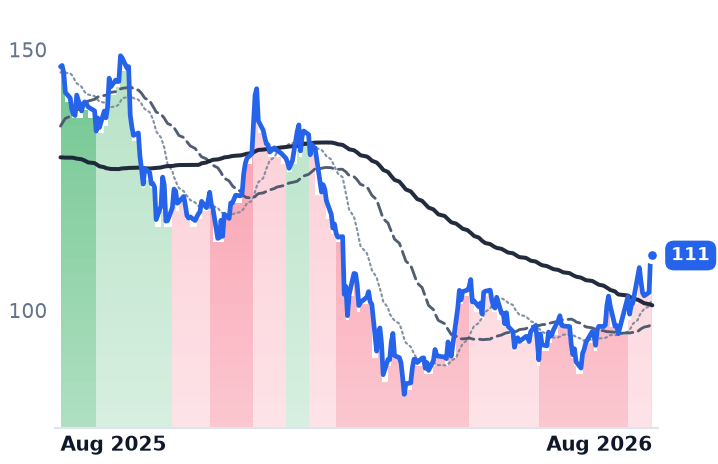
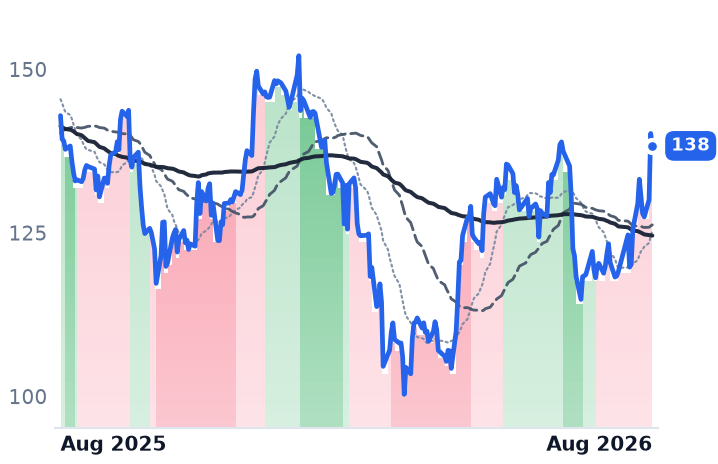
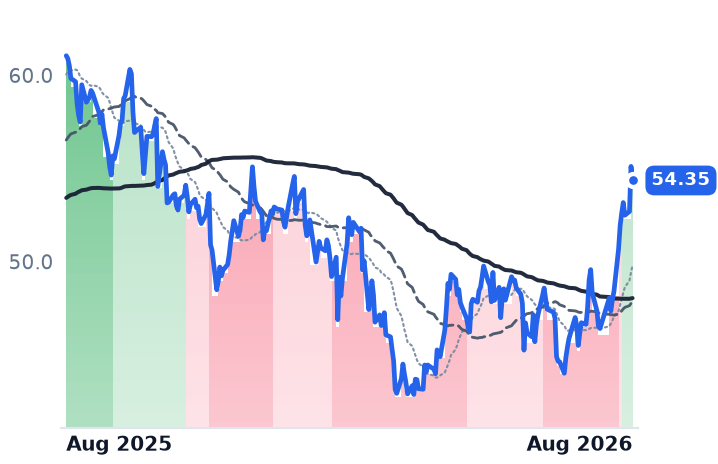
Nvidia said on 10 August it had signed memorandums of understanding with Apollo, BlackRock, Blackstone, Brookfield Asset Management, Goldman Sachs and KKR to build platforms mobilising more than $500bn of outside capital to fund AI data centres. The named managers jumped the next session; the group has added roughly 12% in a month.
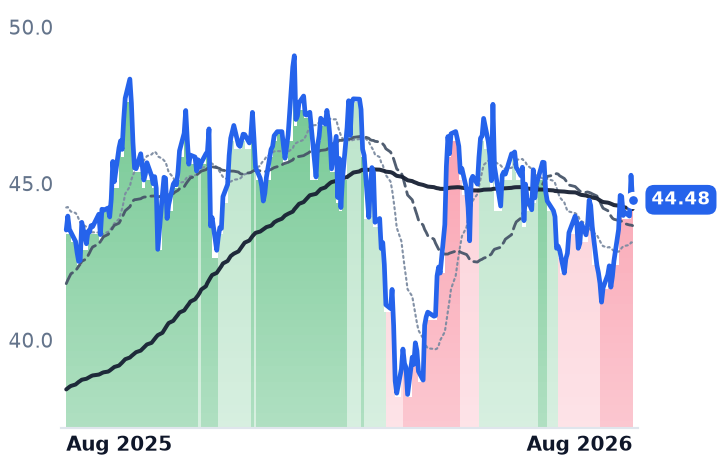
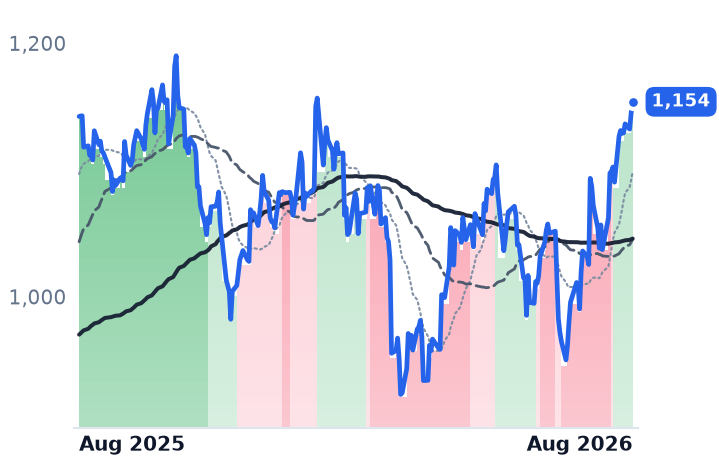
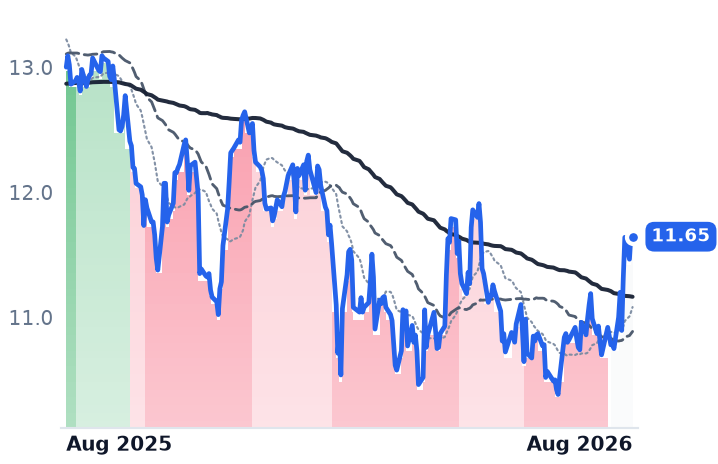
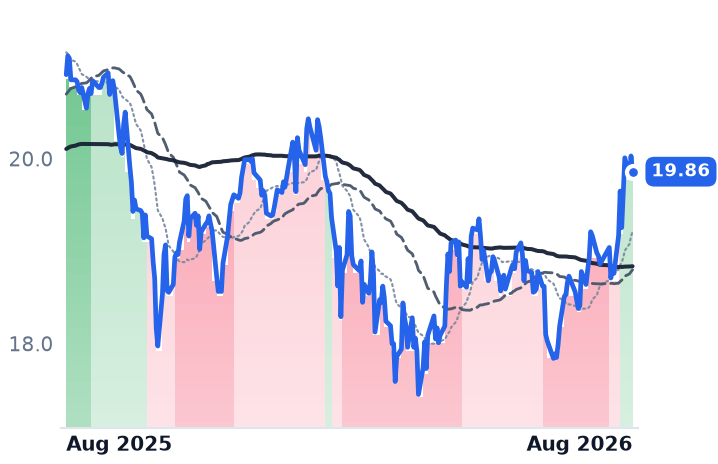
The fee engines are real and were already running. Blackstone's fee-related earnings rose 22% to $1.8bn with its data-centre platform at $185bn, up from $130bn in January; Apollo's rose 25% with fee-generating assets up 34%; KKR's per-share figure rose 34%. But those same lines grew all through the twelve months in which Blackstone fell 13%, KKR 22% and Blue Owl 36% — the announcement changed the narrative, not the numbers.
The unresolved part is credit. KKR told investors on 30 July that hyperscaler data-centre spreads had widened and the market was showing indigestion on large deals.
| Ticker | Company | Segment | Trend | 30D | 1Y |
|---|---|---|---|---|---|
| The subject · what this brief is about | |||||
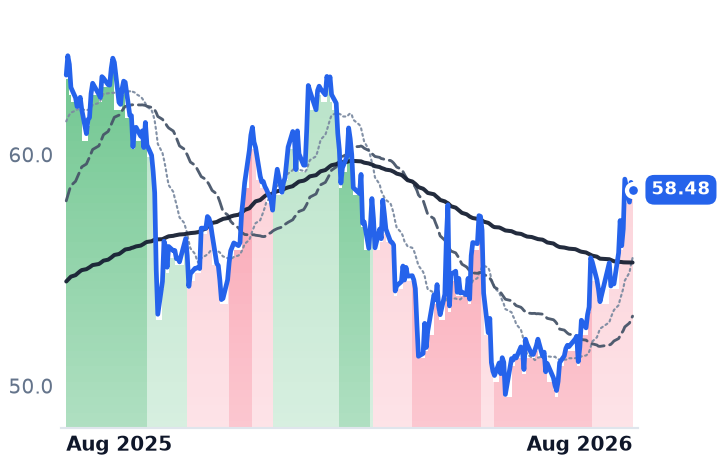
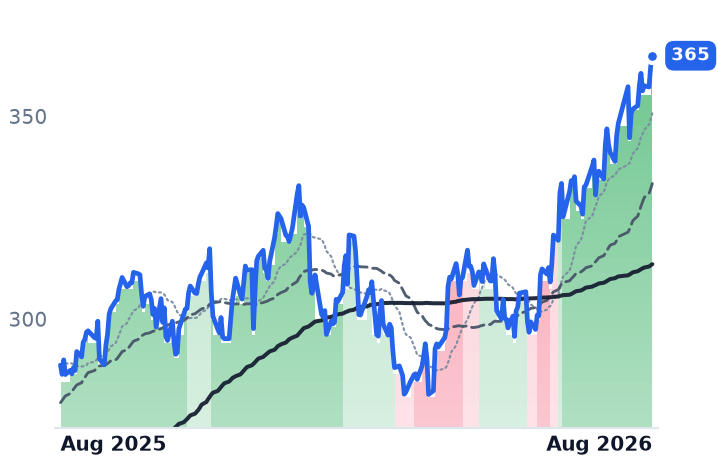
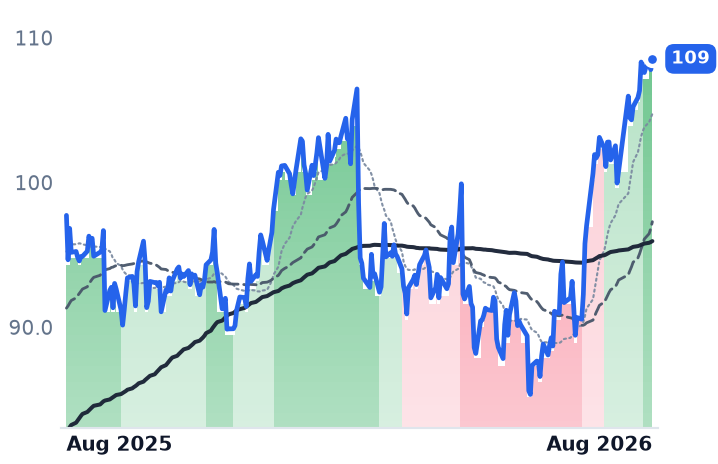
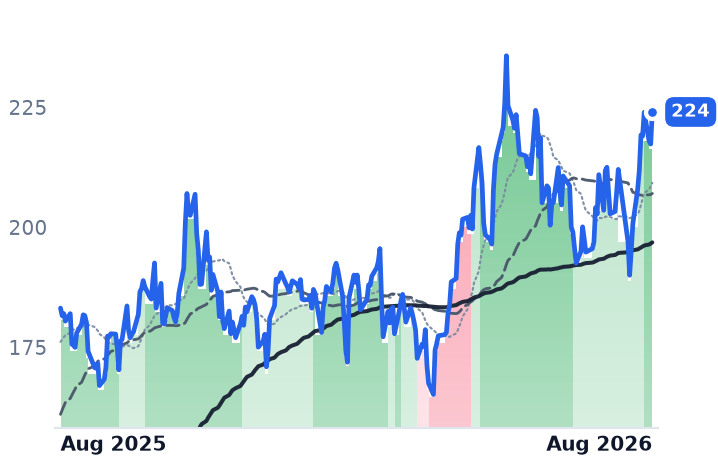
BX | Blackstone | Alternative & Private Capital | 🔴 Cont. Bear | +19.4% | −14.4% |
KKR | KKR | Alternative & Private Capital | 🔴 Cont. Bear | +14.1% | −24.7% |
APO | Apollo Global Management | Alternative & Private Capital | 🔴 Cont. Bear | +16.4% | −3.2% |
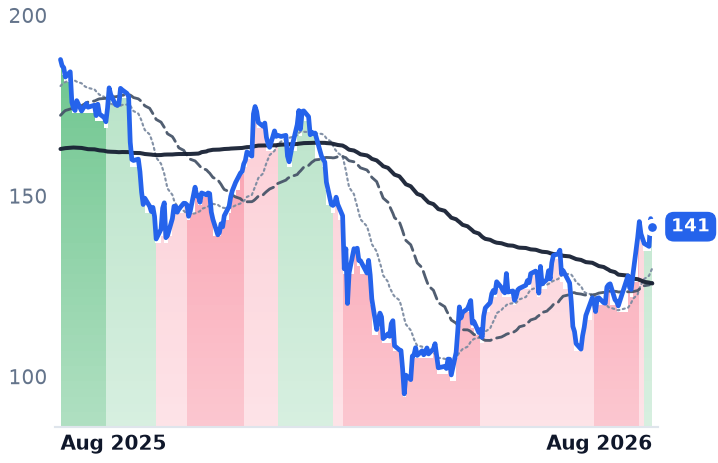
ARES | Ares Management | Alternative & Private Capital | 🔴 Cont. Bear | +17.5% | −24.6% |
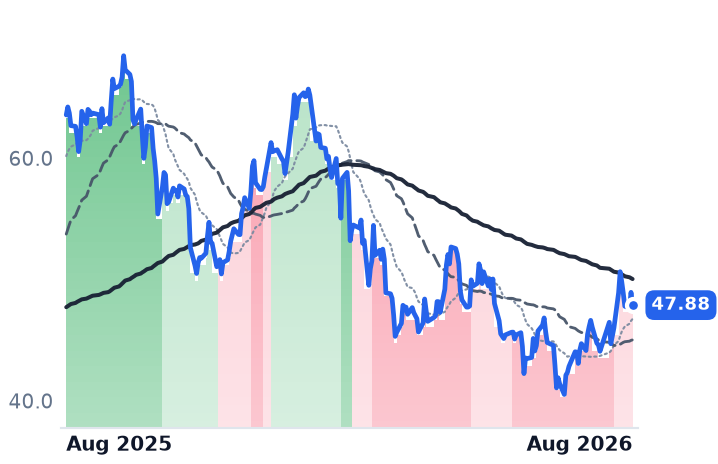
BAM | Brookfield Asset Management | Real Estate & Infrastructure | 🔴 Cont. Bear | +16.6% | −11.0% |
BIP | Brookfield Infrastructure Partners | Infrastructure & Transport Conglomerates | 🟢 Cont. Bull | +4.7% | +33.1% |
CG | The Carlyle | Alternative & Private Capital | 🔴 Cont. Bear | +8.5% | −24.7% |
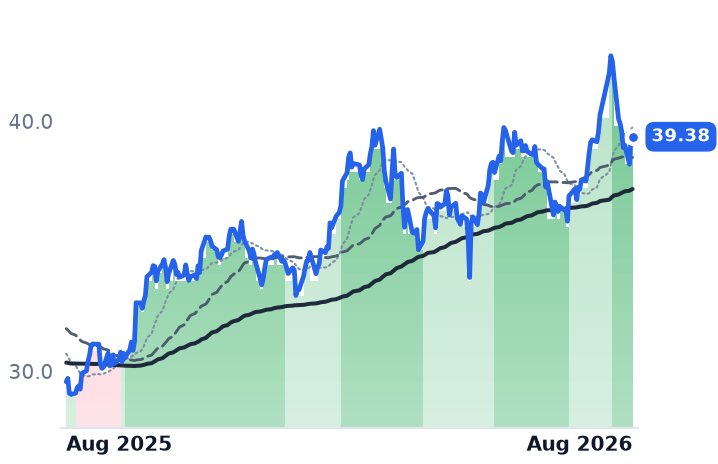
GS | The Goldman Sachs | Bulge Bracket Investment Banks | 🟢 Cont. Bull | −0.8% | +41.8% |
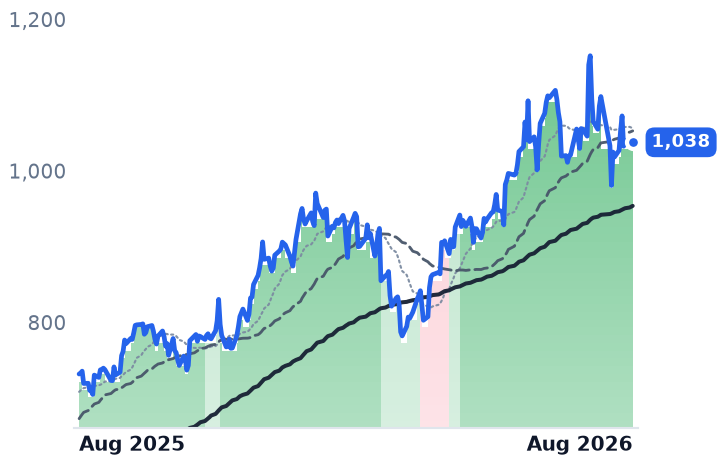
MS | Morgan Stanley | Bulge Bracket Investment Banks | 🟢 Cont. Bull | −1.4% | +50.6% |
OWL | Blue Owl Capital | Alternative & Private Capital | 🔴 Cont. Bear | +31.2% | −37.2% |
HASI | HA Sustainable Infrastructure Capital | Financial - Diversified | 🟢 Cont. Bull | +10.5% | +65.8% |
ARCC | Ares Capital | Middle Market Credit | 🔴 Cont. Bear | +6.5% | −5.0% |
MAIN | Main Street Capital | Middle Market Credit | ⚠️ Emerging Bear | +11.4% | −7.8% |
JPM | JPMorgan Chase | Global Investment Banking & Markets | 🟢 Cont. Bull | +9.1% | +26.4% |
| Compared against · context, not the story | |||||
TPG | TPG | Alternative & Private Capital | ⚠️ Emerging Bear | +19.7% | −16.6% |
BN | Brookfield | Real Estate & Infrastructure | ⚠️ Emerging Bear | +2.6% | +2.2% |
BLK | BlackRock | Diversified Asset Managers | ⚠️ Emerging Bear | +11.9% | +1.0% |
OBDC | Blue Owl Capital | Business Development & Specialty Finance | 🔴 Cont. Bear | +7.2% | −10.4% |
SCHW | The Charles Schwab | Wealth Management & Advisory | 🟢 Cont. Bull | +6.0% | +11.1% |
NVDA | NVIDIA | AI & Data Center GPUs | 🟢 Cont. Bull | +10.1% | +22.3% |
AVGO | Broadcom | Semiconductor Subsystems | 🟢 Cont. Bull | +9.9% | +35.7% |
ORCL | Oracle | Cloud Infrastructure & Platforms | 🔴 Cont. Bear | +15.9% | −39.5% |
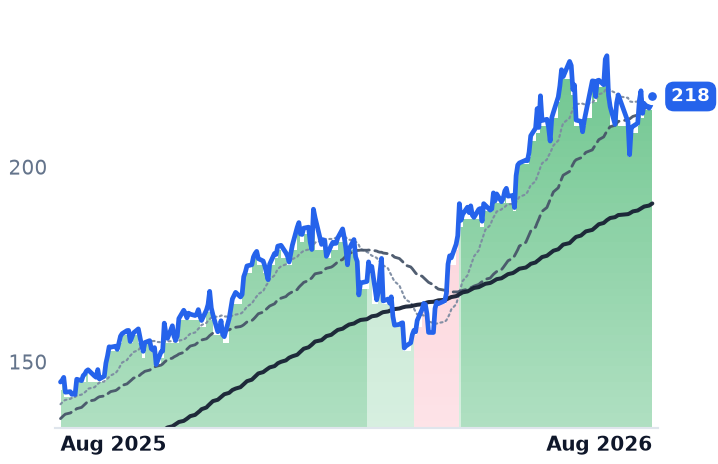
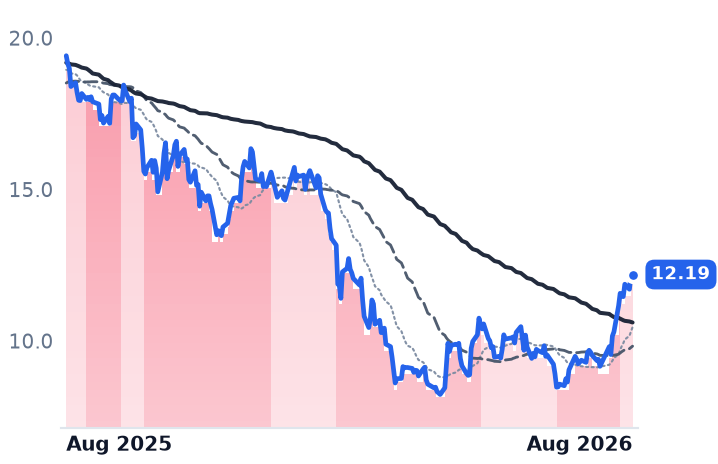
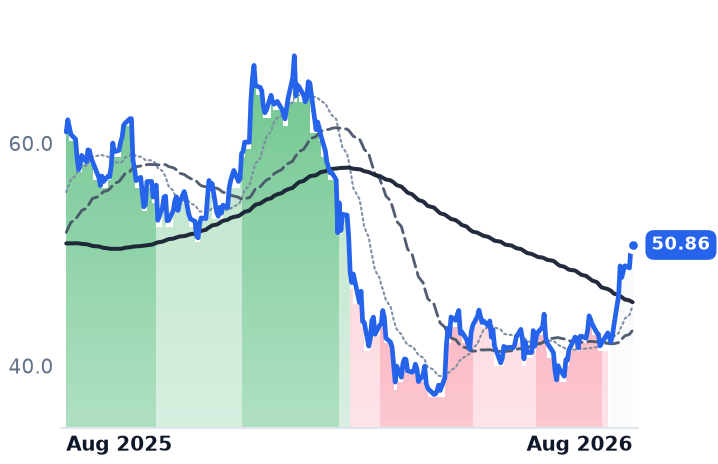
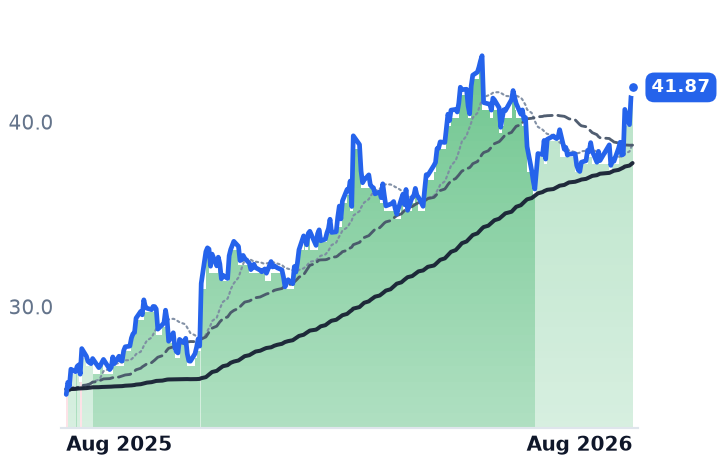
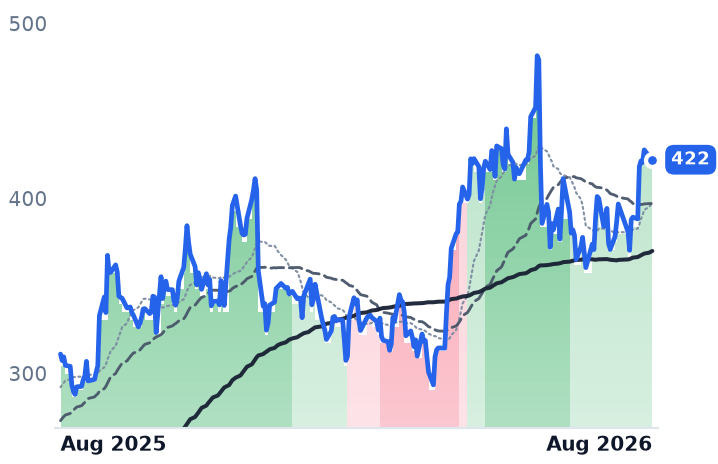
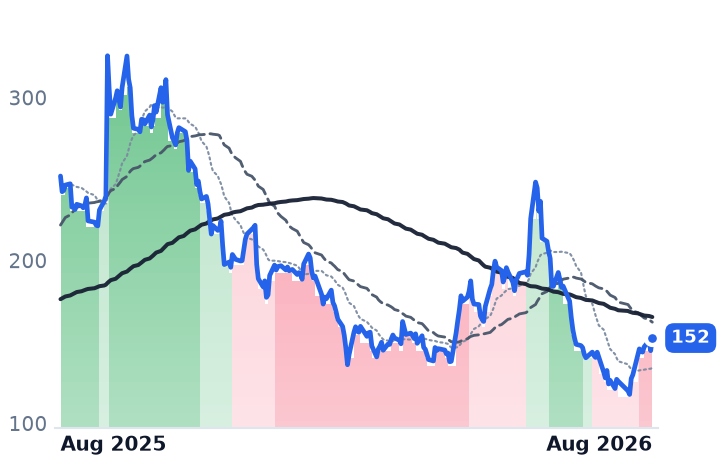
12-month price & trend
| Ticker | Mkt cap | P/E | P/E fwd | P/S | P/S fwd | P/GP | P/GP fwd | EV/EBITDA | FCF yld |
|---|---|---|---|---|---|---|---|---|---|
BX | $176.9B | 32.5x | 24.7x | 11.0x | 12.1x | 12.4x | 13.6x | 22.4x | 2.5% |
KKR | $99.6B | 33.0x | 17.9x | 4.7x | 9.4x | 10.1x | 20.2x | 14.8x | 8.5% |
APO | $79.8B | 30.0x | 15.7x | 2.4x | 3.4x | 2.7x | 3.8x | 5.9x | 5.9% |
| Ticker | Mkt cap | P/E | P/E fwd | P/S | P/S fwd | P/GP | P/GP fwd | EV/EBITDA | FCF yld |
|---|---|---|---|---|---|---|---|---|---|
ARES | $46.7B | 62.2x | 24.2x | 7.3x | 8.3x | 11.6x | 13.2x | 24.1x | 1.8% |
BAM | $87.0B | 31.3x | 29.6x | 16.1x | 14.3x | 20.1x | 17.8x | 23.9x | 2.1% |
BIP | $18.2B | 55.0x | 36.4x | 0.7x | 1.4x | 2.6x | 5.3x | 7.2x | -3.2% |
| Ticker | Mkt cap | P/E | P/E fwd | P/S | P/S fwd | P/GP | P/GP fwd | EV/EBITDA | FCF yld |
|---|---|---|---|---|---|---|---|---|---|
CG | $17.4B | 47.7x | 13.4x | 4.4x | 4.7x | 6.2x | 6.7x | 34.7x | -11.5% |
GS | $306.0B | 15.8x | 14.9x | 2.6x | 4.3x | 4.5x | 7.5x | 27.4x | -13.6% |
MS | $343.4B | 17.5x | 16.9x | 2.7x | 4.2x | 4.5x | 7.0x | 24.1x | -4.6% |
| Ticker | Mkt cap | P/E | P/E fwd | P/S | P/S fwd | P/GP | P/GP fwd | EV/EBITDA | FCF yld |
|---|---|---|---|---|---|---|---|---|---|
OWL | $19.1B | 102.3x | 13.8x | 6.4x | 6.8x | 10.5x | 11.1x | 24.3x | 6.9% |
TPG | $16.0B | 47.7x | 14.8x | 4.5x | 5.9x | 4.7x | 6.2x | 29.7x | 6.1% |
HASI | $5.3B | 63.4x | 14.1x | 11.5x | 11.5x | 41.5x | 41.5x | 44.1x | 4.4% |
| Ticker | Mkt cap | P/E | P/E fwd | P/S | P/S fwd | P/GP | P/GP fwd | EV/EBITDA | FCF yld |
|---|---|---|---|---|---|---|---|---|---|
BN | $99.3B | 84.0x | 16.2x | 1.3x | 13.0x | 3.7x | 36.8x | 10.5x | -7.3% |
BLK | $167.9B | 26.9x | 20.4x | 6.5x | 6.0x | 11.0x | 10.1x | 17.7x | 2.1% |
OBDC | $5.6B | 15.5x | 8.5x | 4.2x | 3.5x | 6.6x | 5.5x | 21.5x | 19.4% |
| Ticker | Mkt cap | P/E | P/E fwd | P/S | P/S fwd | P/GP | P/GP fwd | EV/EBITDA | FCF yld |
|---|---|---|---|---|---|---|---|---|---|
ARCC | $14.3B | 14.7x | 10.4x | 6.2x | 4.6x | 9.2x | 6.9x | 18.2x | 7.5% |
MAIN | $5.4B | 11.8x | 15.3x | 7.8x | 9.3x | 9.1x | 10.9x | 17.5x | 3.2% |
JPM | $978.5B | 15.7x | 14.8x | 3.3x | 4.7x | 5.3x | 7.5x | 20.5x | 8.8% |
| Ticker | Mkt cap | P/E | P/E fwd | P/S | P/S fwd | P/GP | P/GP fwd | EV/EBITDA | FCF yld |
|---|---|---|---|---|---|---|---|---|---|
SCHW | $158.1B | 16.8x | 15.1x | 5.6x | 5.9x | 6.5x | 6.9x | 10.4x | 6.2% |
NVDA | $5.4T | 34.0x | 24.8x | 21.3x | 13.7x | 28.7x | 18.5x | 28.0x | 2.2% |
AVGO | $2.0T | 68.2x | 36.4x | 26.6x | 19.0x | 39.7x | 28.4x | 48.9x | 1.6% |
| Ticker | Mkt cap | P/E | P/E fwd | P/S | P/S fwd | P/GP | P/GP fwd | EV/EBITDA | FCF yld |
|---|---|---|---|---|---|---|---|---|---|
ORCL | $413.1B | 24.1x | 17.8x | 6.1x | 4.6x | 9.3x | 7.0x | 16.8x | -5.7% |
Valuation & fundamentals
Consensus projections
| Ticker | FY2026E | FY2027E | FY2028E | |
|---|---|---|---|---|
BX | Revenue | +15.0% | +24.4% | +4.9% |
| EPS | +10.7% | +25.2% | +10.8% | |
KKR | Revenue | +33.9% | +17.8% | +32.9% |
| EPS | +26.0% | +18.0% | +15.7% | |
APO | Revenue | +27.3% | +16.0% | +13.9% |
| EPS | +10.8% | +21.4% | +16.1% | |
ARES | Revenue | +22.9% | +19.5% | +9.3% |
| EPS | +17.7% | +23.8% | +17.7% | |
BAM | Revenue | +12.2% | +16.1% | +12.9% |
| EPS | +12.9% | +17.8% | +16.8% | |
BIP | Revenue | +61.2% | −25.6% | +8.1% |
| EPS | +2.1% | +38.8% | −2.9% | |
CG | Revenue | −1.7% | +36.3% | +9.0% |
| EPS | −10.1% | +41.6% | +15.4% | |
GS | Revenue | +20.6% | +2.7% | +1.8% |
| EPS | +42.8% | +4.7% | +5.3% | |
MS | Revenue | +16.6% | +5.5% | +5.6% |
| EPS | +30.4% | +5.9% | +8.1% | |
OWL | Revenue | +5.9% | +10.5% | +16.1% |
| EPS | +7.9% | +11.4% | +14.5% | |
TPG | Revenue | +22.8% | +20.1% | +16.9% |
| EPS | +21.3% | +26.0% | +14.3% | |
HASI | Revenue | +18.8% | +11.2% | +14.0% |
| EPS | +10.5% | +10.9% | +8.9% | |
BN | Revenue | −6.8% | +21.4% | +21.7% |
| EPS | +13.2% | +23.7% | +15.4% | |
BLK | Revenue | +16.7% | +10.9% | +13.2% |
| EPS | +12.5% | +14.1% | +15.0% | |
OBDC | Revenue | −12.9% | −0.6% | −3.1% |
| EPS | −14.6% | +0.4% | −4.4% | |
ARCC | Revenue | +1.4% | +3.1% | −1.4% |
| EPS | −4.5% | +1.4% | −3.9% | |
MAIN | Revenue | +3.4% | +7.4% | +9.8% |
| EPS | −4.9% | +3.3% | +4.4% | |
JPM | Revenue | +12.9% | +2.5% | +4.5% |
| EPS | +22.0% | +1.4% | +8.3% | |
SCHW | Revenue | +11.6% | +10.0% | +9.3% |
| EPS | +23.5% | +17.5% | +15.9% | |
NVDA | Revenue | +65.1% | +84.2% | +43.2% |
| EPS | +59.0% | +91.7% | +42.0% | |
AVGO | Revenue | +66.6% | +65.5% | +33.9% |
| EPS | +71.7% | +68.7% | +33.7% | |
ORCL | Revenue | +17.8% | +33.2% | +45.5% |
| EPS | +25.3% | +7.6% | +35.6% |
Forward fiscal years only. Blank means no analyst coverage for that year.
A memorandum, not a wire transfer
Nvidia, which designs the graphics processors that nearly every artificial-intelligence data centre is built around, said on 10 August it had signed memorandums of understanding with six financial firms — Apollo Global Management, BlackRock, Blackstone, Brookfield Asset Management, Goldman Sachs and KKR — to establish financing platforms mobilising more than $500bn of third-party capital for hyperscalers, frontier AI labs and enterprises. Chief executive Jensen Huang described the effort as making chips an investable asset class — long-lived, revenue-generating hardware to borrow against the way lenders borrow against office towers or toll roads. The next session Apollo, an alternative manager that also owns the Athene annuity business, rose 5.95%; KKR rose more than 6% and Blackstone about 4%.
A memorandum of understanding is not funded capital. Apollo made the distinction itself on its 4 August call, telling investors that its $35bn financing for the chipmaker Broadcom — the largest private-credit deal on record — draws over multiple quarters weighted to the fourth quarter of 2026 through the third of 2027, and that fees are booked on deployment, not on announcement.
The fee lines were already there
What these firms sell in this story is arrangement: they raise money from pensions and insurers, lend it or invest it against data-centre construction, and take a management fee plus a spread. That business is compounding fast. Blackstone, the world's largest alternative asset manager, reported second-quarter fee-related earnings of $1.8bn, up 22%, with infrastructure assets of $90bn up 40% and a data-centre platform valued at $185bn against $130bn at the start of the year; it holds 15 gigawatts of entitled, powered sites. KKR, a private-equity, credit and infrastructure firm, posted fee-related earnings of $1.32 a share, up 34%, on $120bn of infrastructure assets, and in June launched Helix, a permanent vehicle with more than $10bn of founding capital from KKR, the Kuwait Investment Authority, Nvidia and the power producer Vistra. Apollo's fee-related earnings rose 25% with fee-generating assets up 34% and $82bn of dry powder carrying roughly $400m of embedded annual fees. Ares Management, a Los Angeles credit specialist, grew fee-related earnings 20% and is building seven data-centre campuses totalling about a gigawatt through its Ada Infrastructure arm, worth an estimated $50m–$100m of incremental fee earnings by 2027. Brookfield Asset Management, the Canadian infrastructure and real-assets manager, grew fee earnings 20% to $808m and is raising a $10bn AI fund against a pipeline above $100bn, with Nvidia as cornerstone investor.
Verdict on the business: CONFIRMS the direction, CONTRADICTS the timing. Every one of those lines was accelerating through the twelve months in which the same shares fell — Blackstone down 13%, KKR 22%, Ares 24%, Brookfield 11%, Blue Owl 36%. Nothing in the fundamentals turned over on 10 August.
What is already priced
The valuations split the group three ways. Apollo shows the widest compression from trailing to expected earnings — 30.0 times to 15.7 times, on enterprise value of just 5.9 times EBITDA — and KKR is close behind at 33.0 to 17.9. Blackstone compresses less, 32.5 to 24.7. At the expensive end, Brookfield trades at 31.3 times trailing and 29.6 times forward, almost no compression at all, on 16.1 times sales, the richest in the group; Ares carries 62.2 times trailing against 24.2 forward with a price-to-book of 8.1.
The two banks are the cheapest and the ones that did not move. Goldman Sachs trades at 15.8 times trailing and 14.9 times forward earnings at 2.54 times book, Morgan Stanley at 17.5 and 16.9 at 3.10 times book — but both are up more than 44% over twelve months and both slipped about 1.8% during the month the managers rallied. Their businesses are strong: Goldman posted record revenue of $20.3bn with financing revenues across fixed income and equities of $4.5bn, up 62%, and Morgan Stanley grew investment banking 58% and raised its 2026 data-centre capital-spending forecast to $850bn from $575bn. Goldman also named the constraint: its supplementary leverage ratio, a capital floor, fell to 4.3%, the lowest among peers, limiting how much of this debt it can hold itself. Verdict on valuation: INCONCLUSIVE — supported at Apollo and KKR, stretched at Brookfield and Ares.
Where the risk sits
KKR told investors on 30 July that hyperscaler data-centre spreads had recently widened and that the market was showing indigestion on large deals. Blue Owl, the group's worst twelve-month performer, capped private-credit redemptions at 5% per fund after roughly $5.4bn of first-quarter withdrawal requests, including requests equal to 40.7% of shares in its technology fund. The Bank for International Settlements counts private credit outstanding to AI-related borrowers above $200bn and warns of "shadow borrowing" — obligations economically like debt sitting outside corporate balance sheets, linking hyperscalers to insurers and pensions. Banks that have hit single-counterparty limits on Oracle's $300bn buildout are pushing that paper toward pension and insurance portfolios.
On the tape, the managers were in downtrends days before the announcement: Apollo, Carlyle — the Washington buyout firm, still down 3.6% over three months — and Blue Owl were all below their long-term averages as of 11 August, and KKR's 50-day average crossed above its 200-day only that day. Goldman and Morgan Stanley have held that crossover for 76 and 78 sessions since mid-April. A macro tailwind helped too: July payrolls unexpectedly fell, pulling Treasury yields down days before Nvidia's announcement.
One name in this grouping does not belong to the story: HASI finances renewable energy and efficiency projects, not data centres, and is down 3.9% over three months despite a 71.7% twelve-month gain.
The setup
Where it stands — A two-week repricing of managers that were in downtrends, triggered by non-binding Nvidia financing memorandums layered on fee growth that was already running. Would confirm — Third-quarter disclosure converting the $500bn memorandums into funded commitments, with fee-related earnings growth holding above 20% at Blackstone, Apollo and Ares. Would invalidate — Further widening in hyperscaler data-centre spreads, or another private-credit vehicle gating redemptions as Blue Owl did. Watch next — Third-quarter results in late October, and Apollo's Broadcom deployment schedule beginning in the fourth quarter of 2026. Valuation — Apollo 30.0x trailing to 15.7x forward; Brookfield 31.3x to 29.6x; Goldman 15.8x to 14.9x at 2.54x book.