

CDW Fell 12% on Record Sales as Memory Inflation Ate Its Margin
Hypothesis Opus 5 · Research Opus 5 · Writing Opus 5 · Prompt v1.3
A shortage of computer memory has repriced the corporate hardware channel. CDW, which resells and installs hardware, software and cloud services for American and British companies and public agencies, reported record quarterly sales of $6.57bn, up 10%, and record adjusted earnings of $2.91 a share — yet gross margin narrowed to 20.1% from 20.8% and free cash flow swung to minus $82.6m on roughly $400m of inventory build. The shares fell 12% on the print.
The businesses do not all read the same way. Ingram Micro, the distributor one rung upstream, grew gross profit 14.2% and operating income 38.6% in the same quarter with margin up rather than down, and trades at 8.3x forward earnings against 15.2x trailing. Two other names here — IBM and N-able — fell on company-specific failures rather than component costs.
Whether dearer memory is a one-quarter working-capital drag or a lasting reset of the reseller's spread is what the next quarter settles.
| Ticker | Company | Segment | Trend | 30D | 1Y |
|---|---|---|---|---|---|
| The subject · what this brief is about | |||||
CDW | CDW | IT Infrastructure & Operations | 🌱 Emerging Bull | −5.3% | −13.5% |
INGM | Ingram Micro | IT Infrastructure & Operations | 🟢 Cont. Bull | −2.7% | +52.1% |
IBM | International Business Machines | IT Infrastructure & Operations | ⚠️ Emerging Bear | −17.9% | +2.7% |
DXC | DXC Technology | IT Infrastructure & Operations | 🔴 Cont. Bear | +12.4% | −15.1% |
KD | Kyndryl | IT Infrastructure & Operations | 🔴 Cont. Bear | +11.7% | −52.7% |
NABL | N-able | IT Infrastructure & Operations | 🔴 Cont. Bear | −26.0% | −54.9% |
| Compared against · context, not the story | |||||
ACN | Accenture | Enterprise Consulting & Systems Integration | 🔴 Cont. Bear | +29.5% | −23.3% |
CTSH | Cognizant Technology Solutions | Enterprise Consulting & Systems Integration | 🔴 Cont. Bear | +32.5% | −14.2% |
IT | Gartner | Research & Advisory | 🔴 Cont. Bear | +34.6% | −15.8% |
EPAM | EPAM Systems | Enterprise Consulting & Systems Integration | 🔴 Cont. Bear | +14.0% | −35.1% |
GLOB | Globant | Enterprise Consulting & Systems Integration | 🔴 Cont. Bear | +20.3% | −48.2% |
G | Genpact | Business Process & Analytics Services | 🔴 Cont. Bear | +12.5% | −20.0% |
EXLS | ExlService | Business Process & Analytics Services | 🔴 Cont. Bear | +23.4% | −16.4% |
LDOS | Leidos | Defense & Government Solutions | ⚠️ Emerging Bear | +30.9% | −20.7% |
CACI | CACI International | Defense & Government Solutions | ⚠️ Emerging Bear | +34.4% | +34.2% |
SAIC | Science Applications International | Defense & Government Solutions | 🌱 Emerging Bull | +11.5% | +10.2% |
BAH | Booz Allen Hamilton | Government & Defense Consulting | 🔴 Cont. Bear | +18.6% | −28.2% |
FIS | Fidelity National Information Services | Financial Services Technology | 🔴 Cont. Bear | +0.9% | −38.2% |
JKHY | Jack Henry & Associates | Financial Services Technology | 🔴 Cont. Bear | +2.5% | −1.5% |
ACIW | ACI Worldwide | Payment Processing & Fintech | 🌱 Emerging Bull | −7.4% | +17.7% |
ARW | Arrow Electronics | Enterprise IT Solutions | 🟢 Cont. Bull | +0.4% | +69.0% |
AVT | Avnet | Component & Specialty Distribution | 🟢 Cont. Bull | +12.5% | +88.8% |
SNX | TD SYNNEX | Broad IT Infrastructure | 🟢 Cont. Bull | +2.1% | +77.4% |
SPY | State Street SPDR S&P 500 ETF Trust | Asset Management | 🟢 Cont. Bull | +3.3% | +22.7% |
INFY | Infosys | Enterprise Consulting & Systems Integration | 🔴 Cont. Bear | +9.7% | −19.9% |
WIT | Wipro | Enterprise Consulting & Systems Integration | 🔴 Cont. Bear | +5.0% | −24.7% |
CNXC | Concentrix | Business Process & Analytics Services | 🔴 Cont. Bear | +3.9% | −42.9% |
GDYN | Grid Dynamics | Enterprise Consulting & Systems Integration | 🔴 Cont. Bear | +29.8% | +0.3% |
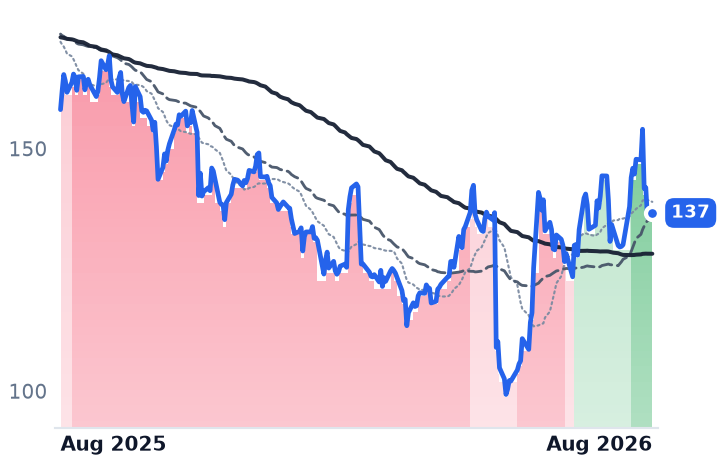
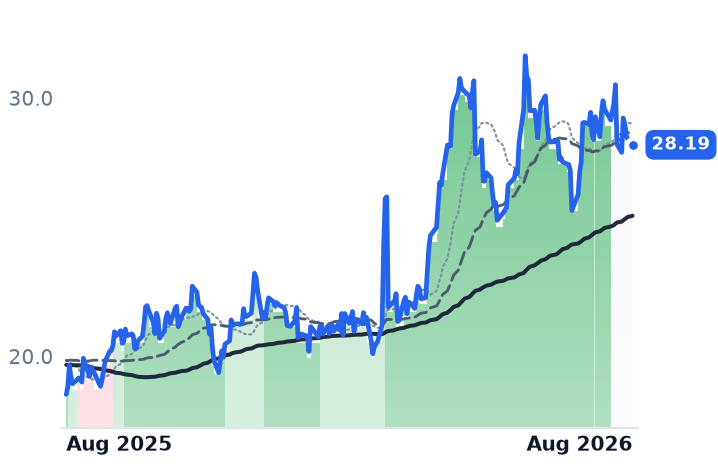
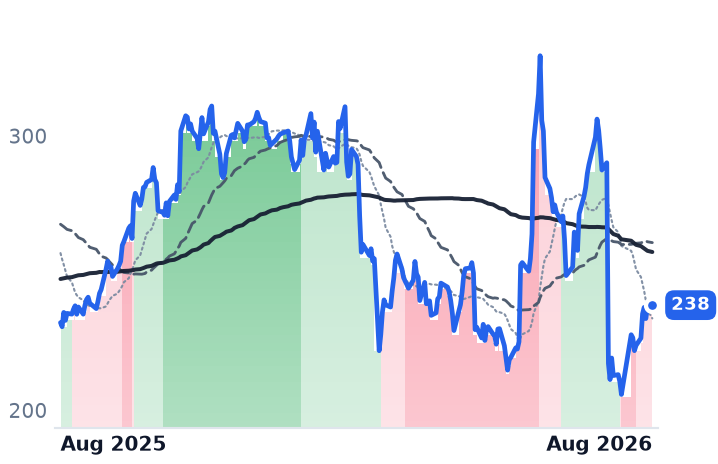
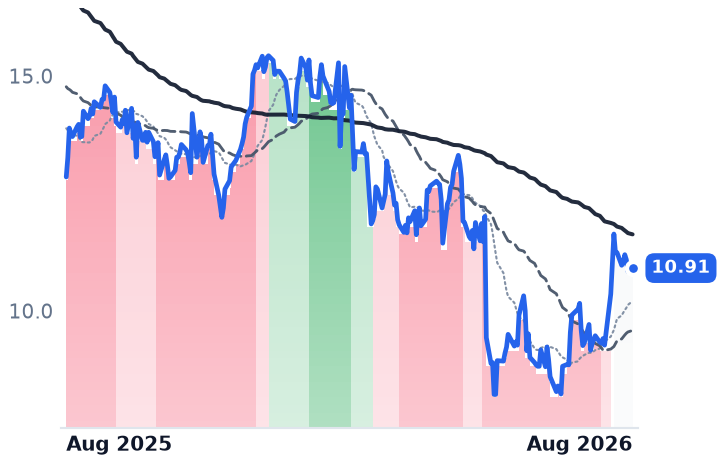
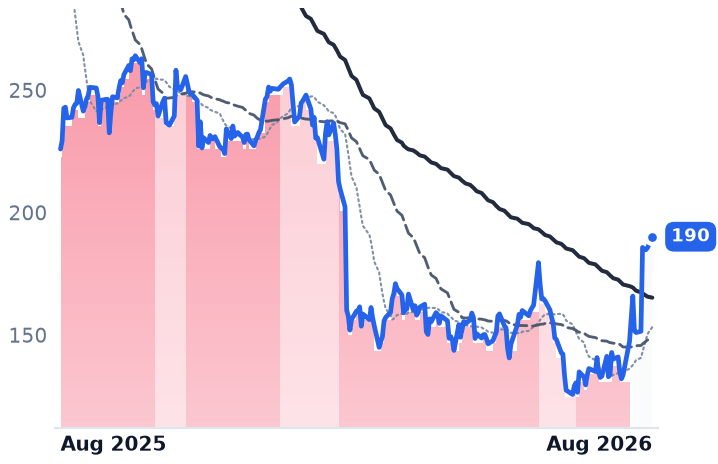
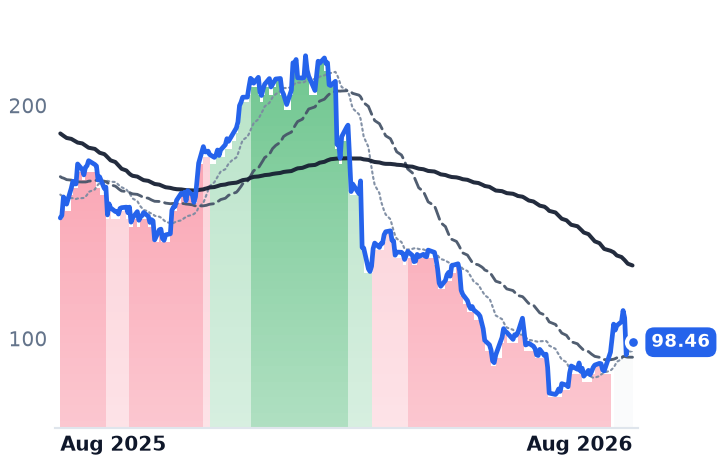
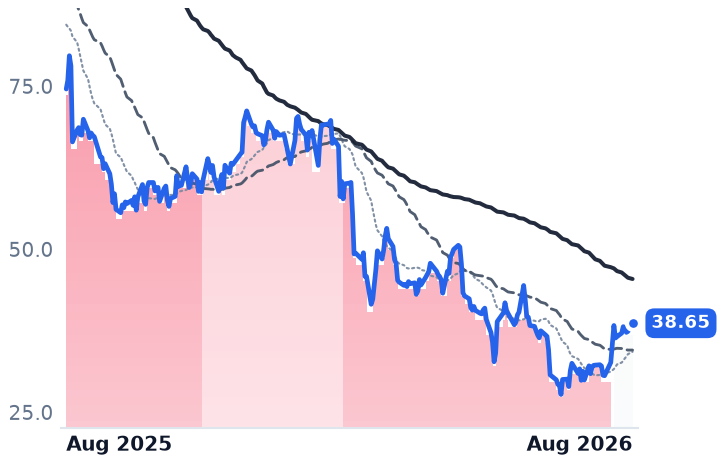
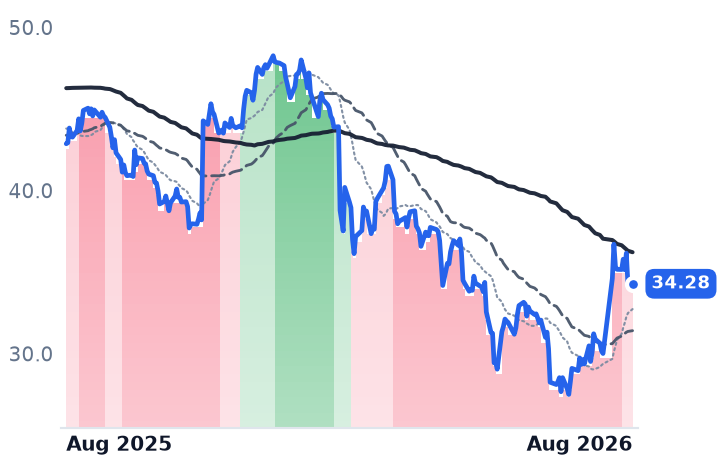
12-month price & trend
| Ticker | Mkt cap | P/E | P/E fwd | P/S | P/S fwd | P/GP | P/GP fwd | EV/EBITDA | FCF yld |
|---|---|---|---|---|---|---|---|---|---|
CDW | $17.5B | 16.4x | 12.6x | 0.7x | 0.7x | 3.3x | 3.3x | 12.7x | 6.3% |
INGM | $6.5B | 15.2x | 8.3x | 0.1x | 0.1x | 1.5x | 1.5x | 7.6x | -3.6% |
IBM | $222.5B | 20.6x | 19.2x | 3.2x | 3.2x | 5.5x | 5.5x | 17.3x | 6.6% |
| Ticker | Mkt cap | P/E | P/E fwd | P/S | P/S fwd | P/GP | P/GP fwd | EV/EBITDA | FCF yld |
|---|---|---|---|---|---|---|---|---|---|
DXC | $1.8B | 14.3x | 4.2x | 0.1x | 0.1x | 0.7x | 0.7x | 2.6x | 71.0% |
KD | $3.0B | 9.2x | 7.2x | 0.1x | 0.2x | 0.5x | 0.9x | 2.6x | 4.9% |
NABL | $628.2M | n/m | 8.0x | 1.2x | 1.1x | 1.6x | 1.4x | 13.9x | 10.8% |
| Ticker | Mkt cap | P/E | P/E fwd | P/S | P/S fwd | P/GP | P/GP fwd | EV/EBITDA | FCF yld |
|---|---|---|---|---|---|---|---|---|---|
ACN | $107.5B | 13.9x | 12.7x | 1.5x | 1.5x | 4.7x | 4.7x | 8.3x | 11.7% |
CTSH | $26.0B | 12.4x | 10.0x | 1.2x | 1.2x | 3.7x | 3.7x | 6.8x | 10.0% |
IT | $9.8B | 13.8x | 10.7x | 1.5x | 1.5x | 2.2x | 2.2x | 9.0x | 12.8% |
| Ticker | Mkt cap | P/E | P/E fwd | P/S | P/S fwd | P/GP | P/GP fwd | EV/EBITDA | FCF yld |
|---|---|---|---|---|---|---|---|---|---|
EPAM | $5.1B | 13.1x | 7.5x | 0.9x | 0.9x | 3.2x | 3.2x | 6.5x | 8.4% |
GLOB | $1.6B | 15.0x | 6.0x | 0.7x | 0.7x | 2.1x | 2.1x | 5.5x | 18.8% |
G | $5.8B | 10.1x | 8.4x | 1.1x | 1.1x | 3.0x | 3.0x | 7.5x | 9.8% |
| Ticker | Mkt cap | P/E | P/E fwd | P/S | P/S fwd | P/GP | P/GP fwd | EV/EBITDA | FCF yld |
|---|---|---|---|---|---|---|---|---|---|
EXLS | $5.2B | 21.5x | 15.0x | 2.3x | 2.2x | 6.0x | 5.7x | 12.6x | 5.3% |
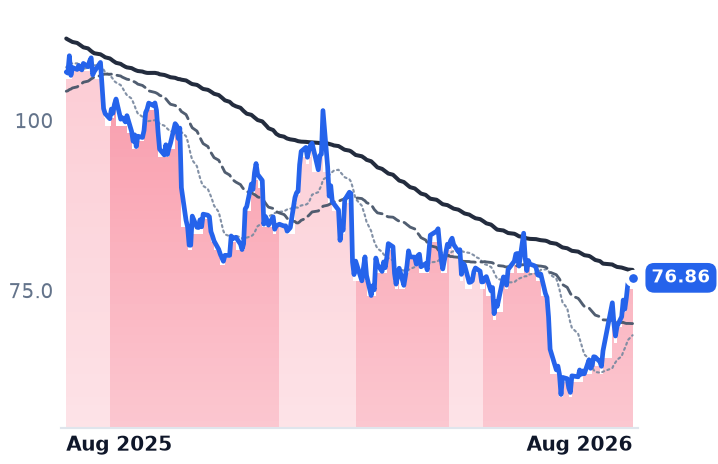
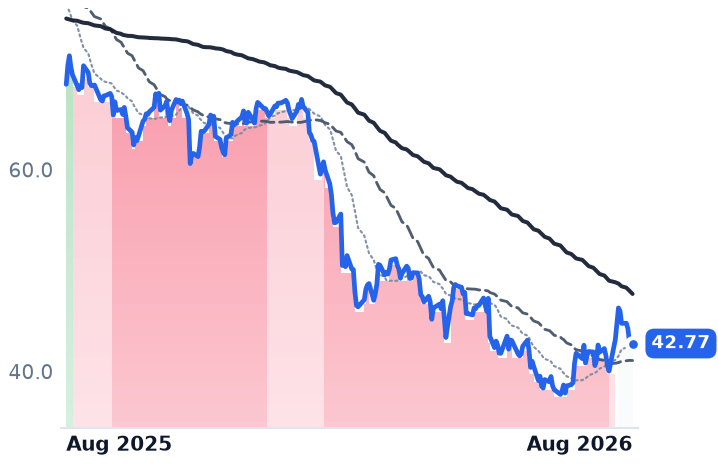
LDOS | $17.3B | 12.7x | 11.1x | 1.0x | 0.9x | 5.7x | 5.2x | 10.1x | 12.5% |
CACI | $14.2B | 26.5x | 20.7x | 1.5x | 1.3x | 6.9x | 6.0x | 17.7x | 9.0% |
| Ticker | Mkt cap | P/E | P/E fwd | P/S | P/S fwd | P/GP | P/GP fwd | EV/EBITDA | FCF yld |
|---|---|---|---|---|---|---|---|---|---|
SAIC | $5.3B | 14.2x | 12.4x | 0.7x | 0.7x | 5.6x | 5.6x | 10.8x | 11.3% |
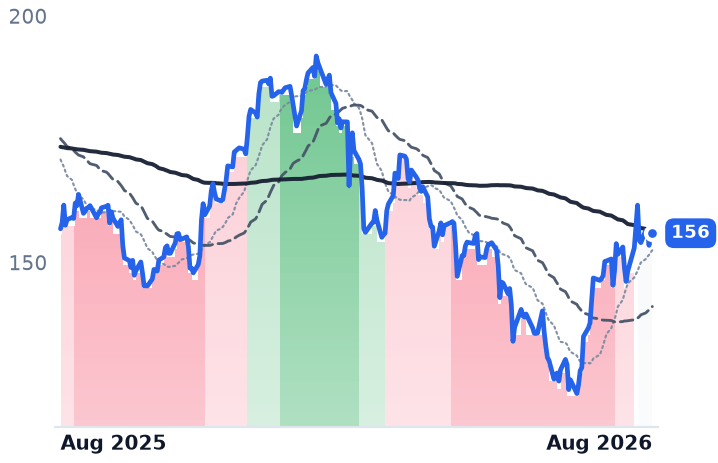
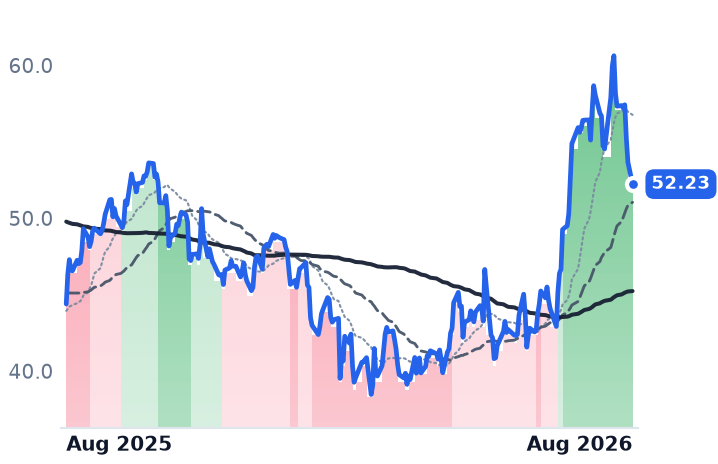
BAH | $8.8B | 10.7x | 11.7x | 0.8x | 0.8x | 1.5x | 1.5x | 7.2x | 10.7% |
FIS | $22.1B | 6.5x | 6.9x | 1.8x | 1.6x | 4.9x | 4.3x | 6.9x | 12.2% |
| Ticker | Mkt cap | P/E | P/E fwd | P/S | P/S fwd | P/GP | P/GP fwd | EV/EBITDA | FCF yld |
|---|---|---|---|---|---|---|---|---|---|
JKHY | $11.1B | 21.8x | 21.6x | 4.4x | 4.1x | 10.0x | 9.3x | 12.5x | 6.6% |
ACIW | $4.2B | 20.6x | 17.1x | 2.4x | 2.2x | 5.0x | 4.6x | 11.2x | 6.8% |
ARW | $10.7B | 14.7x | 10.5x | 0.3x | 0.3x | 2.7x | 2.7x | 9.7x | 3.5% |
| Ticker | Mkt cap | P/E | P/E fwd | P/S | P/S fwd | P/GP | P/GP fwd | EV/EBITDA | FCF yld |
|---|---|---|---|---|---|---|---|---|---|
AVT | $6.9B | 32.2x | 16.4x | 0.3x | 0.3x | 2.9x | 2.9x | 12.6x | 0.5% |
SNX | $18.6B | 18.7x | 13.7x | 0.3x | 0.3x | 4.4x | 4.4x | 9.5x | 6.7% |
SPY | $773.0B | — | — | — | — | — | — | — | — |
| Ticker | Mkt cap | P/E | P/E fwd | P/S | P/S fwd | P/GP | P/GP fwd | EV/EBITDA | FCF yld |
|---|---|---|---|---|---|---|---|---|---|
INFY | $50.8B | 15.2x | 15.8x | 2.5x | 2.5x | 8.2x | 8.2x | 9.8x | 7.6% |
WIT | $20.0B | 14.8x | 0.2x | 1.9x | 0.0x | 6.5x | n/m | 9.8x | 7.7% |
CNXC | $1.5B | n/m | 2.3x | 0.2x | 0.2x | 0.6x | 0.6x | n/m | 33.7% |
| Ticker | Mkt cap | P/E | P/E fwd | P/S | P/S fwd | P/GP | P/GP fwd | EV/EBITDA | FCF yld |
|---|---|---|---|---|---|---|---|---|---|
GDYN | $614.9M | 275.6x | 17.2x | 1.5x | 1.4x | 4.3x | 4.0x | 13.9x | 2.6% |
Valuation & fundamentals
Consensus projections
| Ticker | FY2026E | FY2027E | FY2028E | |
|---|---|---|---|---|
CDW | Revenue | +7.9% | +3.6% | +3.3% |
| EPS | +9.7% | +9.1% | +9.3% | |
INGM | Revenue | +10.7% | +3.5% | +4.3% |
| EPS | +18.1% | +11.2% | +11.9% | |
IBM | Revenue | +5.0% | +3.9% | +5.1% |
| EPS | +8.4% | +6.8% | +8.6% | |
DXC | Revenue | −1.2% | −4.3% | −1.5% |
| EPS | −5.6% | −18.8% | +15.8% | |
KD | Revenue | +0.4% | −1.9% | −0.1% |
| EPS | +49.9% | +8.7% | +32.6% | |
NABL | Revenue | +9.4% | +8.4% | — |
| EPS | −1.8% | +15.7% | — | |
ACN | Revenue | +6.0% | +4.1% | +5.3% |
| EPS | +7.6% | +5.9% | +7.3% | |
CTSH | Revenue | +5.3% | +4.7% | +5.2% |
| EPS | +10.8% | +9.8% | +10.4% | |
IT | Revenue | −0.7% | +4.6% | +6.3% |
| EPS | +7.2% | +12.5% | +14.2% | |
EPAM | Revenue | +5.1% | +5.8% | +6.6% |
| EPS | +14.1% | +8.8% | +9.2% | |
GLOB | Revenue | +1.0% | +4.4% | +5.2% |
| EPS | +1.6% | +6.1% | +7.3% | |
G | Revenue | +7.2% | +7.3% | +8.4% |
| EPS | +12.6% | +10.0% | +14.4% | |
EXLS | Revenue | +16.0% | +11.7% | +11.8% |
| EPS | +19.5% | +13.5% | +14.9% | |
LDOS | Revenue | +5.2% | +5.8% | +4.6% |
| EPS | +17.1% | +4.4% | +4.7% | |
CACI | Revenue | +10.9% | +11.9% | +6.3% |
| EPS | +14.2% | +10.6% | +14.0% | |
SAIC | Revenue | −2.4% | −1.2% | +1.1% |
| EPS | +15.3% | +0.9% | +8.1% | |
BAH | Revenue | −6.1% | +1.6% | +3.6% |
| EPS | −4.3% | +2.3% | +10.7% | |
FIS | Revenue | +29.0% | +4.2% | +3.0% |
| EPS | +7.7% | +8.2% | +10.5% | |
JKHY | Revenue | +7.0% | +5.9% | +6.6% |
| EPS | +12.4% | +5.9% | +8.9% | |
ACIW | Revenue | +9.0% | +7.6% | — |
| EPS | +3.9% | +17.8% | — | |
ARW | Revenue | +28.3% | +4.5% | +7.3% |
| EPS | +91.8% | +8.1% | +13.4% | |
AVT | Revenue | +22.2% | +14.3% | +9.6% |
| EPS | +52.1% | +54.9% | +11.8% | |
SNX | Revenue | +9.8% | +5.7% | +5.6% |
| EPS | +28.4% | +9.8% | +13.2% | |
INFY | Revenue | +1.6% | +4.0% | +3.7% |
| EPS | +2.3% | +4.3% | +4.6% | |
WIT | Revenue | +5.4% | +4.3% | +2.6% |
| EPS | +4.6% | +3.1% | +3.8% | |
CNXC | Revenue | +1.5% | +1.3% | +7.0% |
| EPS | −3.5% | +5.5% | +32.4% | |
GDYN | Revenue | +6.5% | +9.2% | +10.6% |
| EPS | +11.3% | +17.7% | +9.6% |
Forward fiscal years only. Blank means no analyst coverage for that year.
Prices for LPDDR5X memory rose 89% in the second quarter of 2026 and DDR4 by as much as 51%, as artificial-intelligence data-centre buyers soaked up supply that would otherwise have gone into laptops and general-purpose servers (TweakTown). For the companies that buy finished boxes and move them on, that inflates the invoice, thins the spread and ties up cash — the defining pressure on this group of six infrastructure names this summer.
The box movers
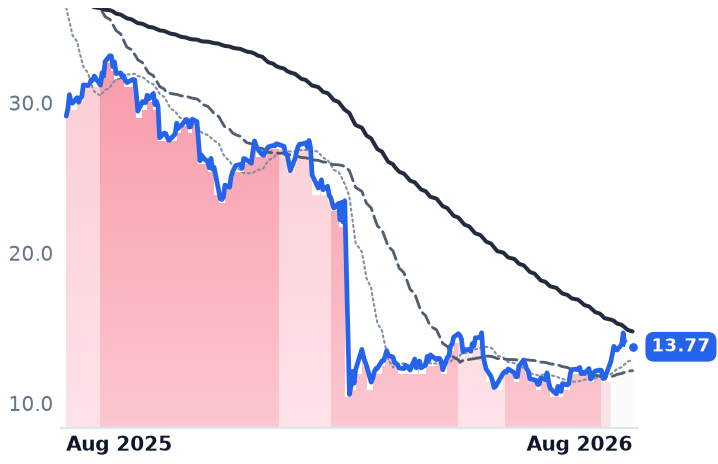
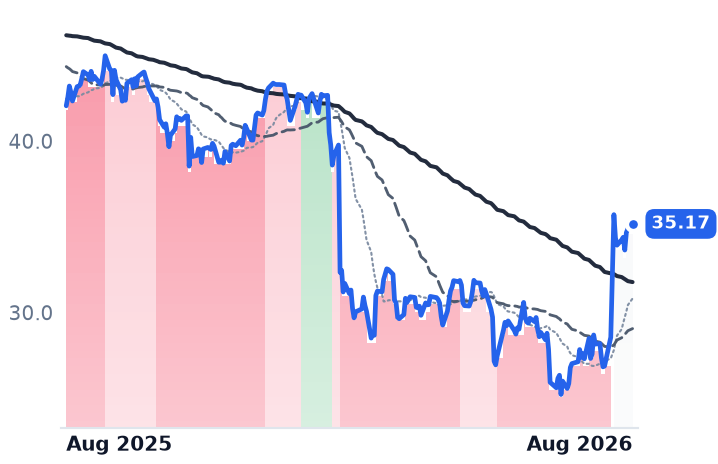
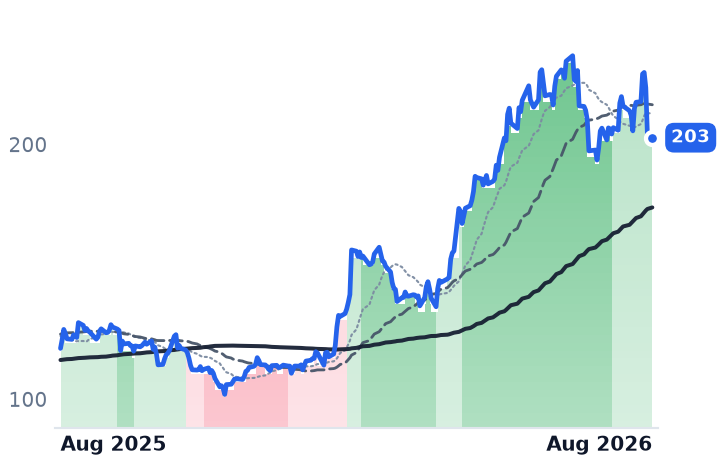
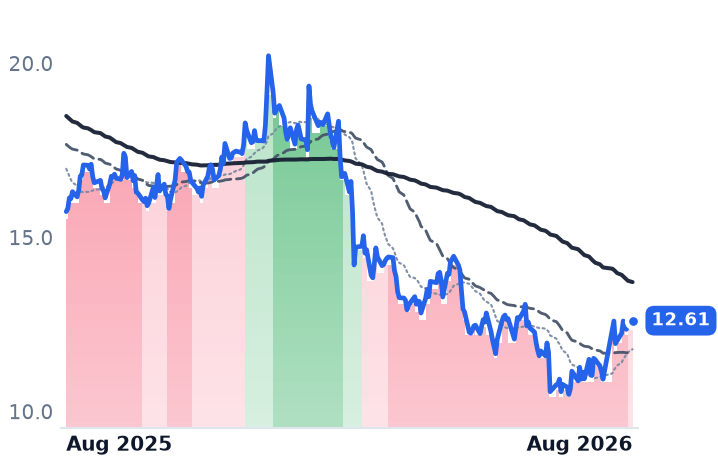
CDW is the clearest case. On its 5 August call management raised full-year guidance to mid-single-digit gross-profit growth and high-end high-single-digit adjusted earnings growth, said written orders exceeded invoicing with backlog "significantly elevated", and still watched the stock drop 12.3% (StockStory). The reason sits below the revenue line: revenue up 10.0%, gross profit up only 6.3%, operating income up 2.0%, and adjusted free cash flow of $278m year-to-date, 42% of non-GAAP net income against an 80-90% target. This is the second such quarter — CDW fell more than 20% in May when Q1 gross margin contracted 60 basis points to 21.0% amid memory-supply constraints (Investing.com). Net leverage is 2.5x within its 2-3x target and $545m of stock has been repurchased this year.
Ingram Micro, the global distributor that sells devices, servers, networking and cloud subscriptions to resellers, took the same cost shock and produced the opposite result: record net sales of $14.53bn up 13.6%, gross profit $959m up 14.2%, operating income up 38.6%, gross margin 6.60% versus 6.56%, and a guide to continued double-digit growth (earnings call). The cost is on the balance sheet: trailing free-cash-flow yield is negative 3.6%, the working capital of financing pricier inventory.
Verdict on the business: SPLIT. Component inflation confirms the tape at CDW and contradicts it at Ingram Micro, whose shares slipped 3% on a record quarter.
Two collapses that skewed the group
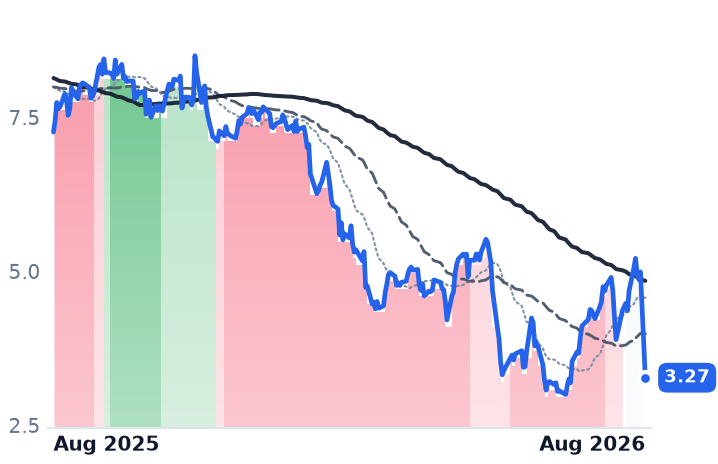
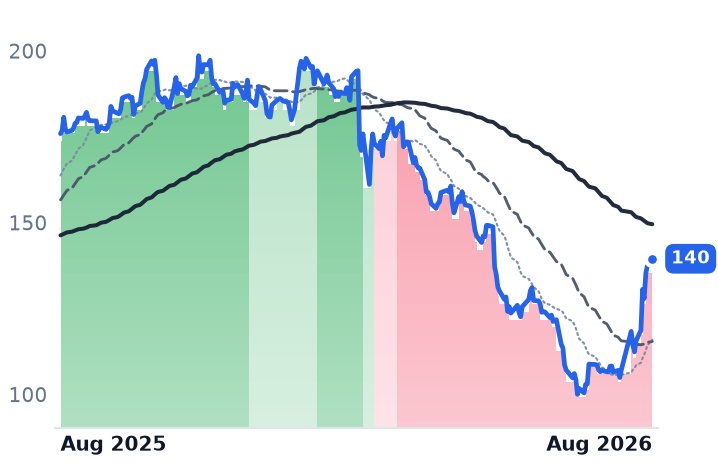
IBM lost about $67bn of market value on 14 July, its worst single day on record, after pre-announcing quarterly revenue of $17.2bn against $17.86bn expected (CNBC); chief executive Arvind Krishna said the company "faltered" and "did not adapt and move quickly enough" (Fortune), and the miss dragged the wider software complex with it (Bloomberg). Revenue growth decelerated from 9.5% to 1.1%, gross profit fell 0.7% and operating income 15.3%. Management blamed large licence deals in transaction-processing software as customers redirected budget to supply-constrained servers — the same memory shock, seen from the vendor side. Annual recurring revenue of $24.6bn grew 8% and Red Hat accelerated to 11%.
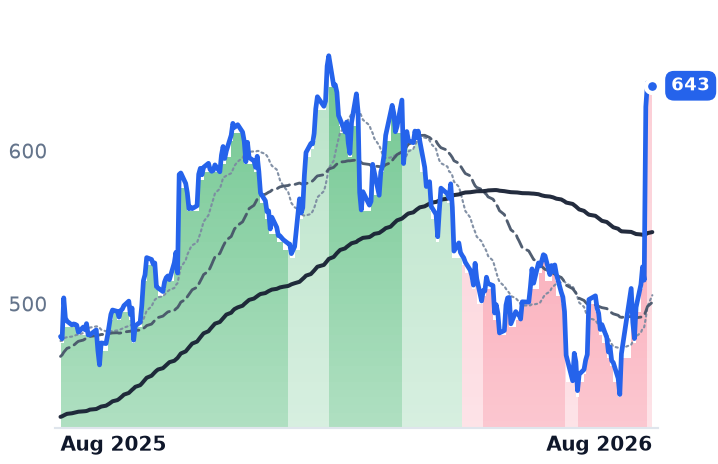
N-able, which sells remote-monitoring, backup and endpoint-security tools to the managed service providers that look after small businesses, fell 36% on 10 August (Investing.com). Quarterly earnings met consensus; full-year revenue guidance was cut to $539-542m from $554-559m because its largest renewal group came in at mid-80s renewal rates against higher-80s expected, with some endpoint-security customers moving to SentinelOne. Growth has gone 13.1% to 5.3% in two quarters and gross margin from 78.1% to 76.8%. This is competitive loss, not a cost cycle.
The outsourcers, on other news
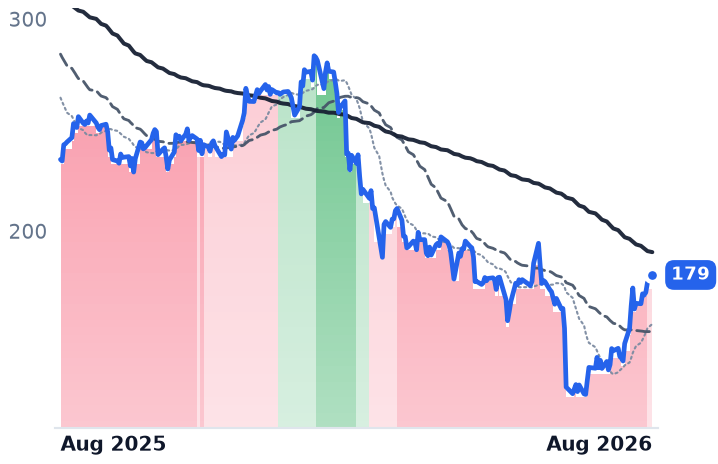
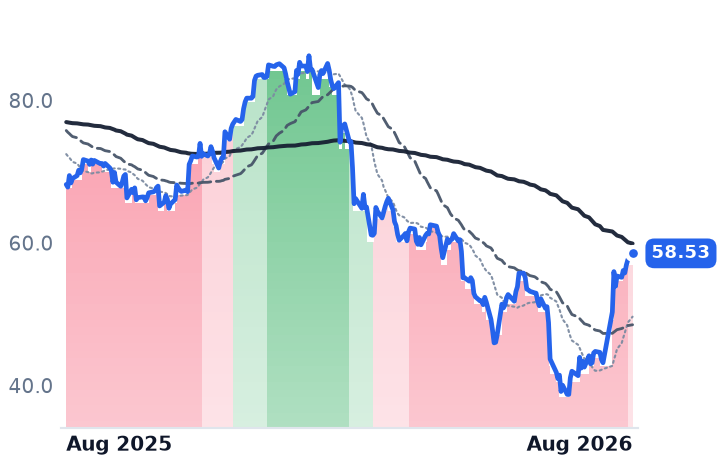
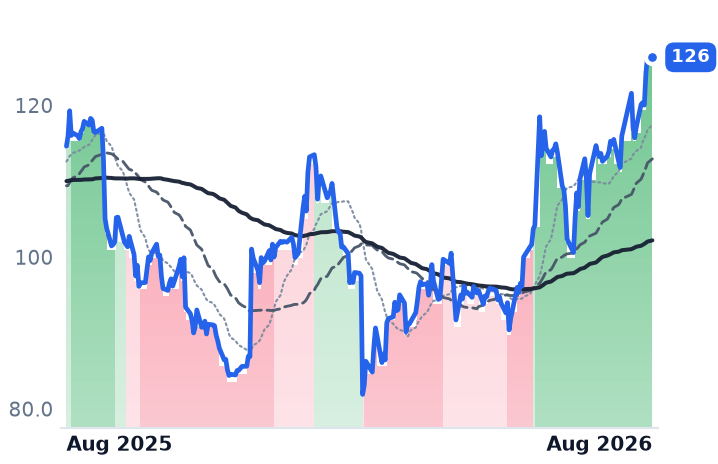
DXC Technology, a 115,000-person IT outsourcer, rose despite organic revenue down 6.7%, gross profit down 20.8% and non-GAAP earnings per share down 41% (company release) — because a consortium of Apollo Global Management and Kyndryl has approached it with an all-cash proposal discussed at $22-25 a share against a $10.91 close (Nasdaq). Kyndryl, spun out of IBM in 2020 to run mainframes and core platforms for banks and telecoms, reported revenue down 3% but consulting up 10% and hyperscaler-related revenue above $530m growing 34% (Kyndryl), with trailing signings of $14.2bn now exceeding revenue and fiscal-2028 targets of over $1.2bn pretax income against a $3.0bn market value. Kyndryl also quantified the direct-sourcing threat from the other end: client spend routed through IBM has halved to under $2bn as customers buy hardware direct and keep the service.
Verdict on valuation: MIXED. CDW at 12.6x forward against 16.4x trailing with a 6.3% free-cash-flow yield, and Ingram at 8.3x forward and 7.6x enterprise value to EBITDA, sit well below their trailing marks while gross-profit dollars still grow. IBM at 19.2x forward is the most expensive name here and has de-rated only modestly from the roughly 22x it carried in May. DXC at 4.2x forward and 0.58x book is cheap on takeover odds, not on trading.
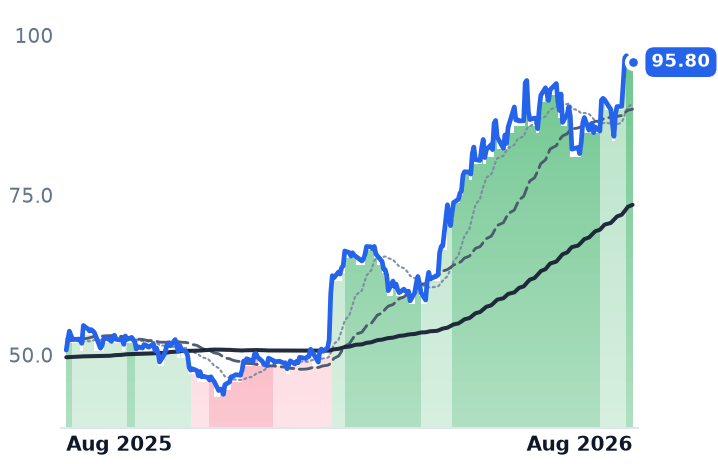
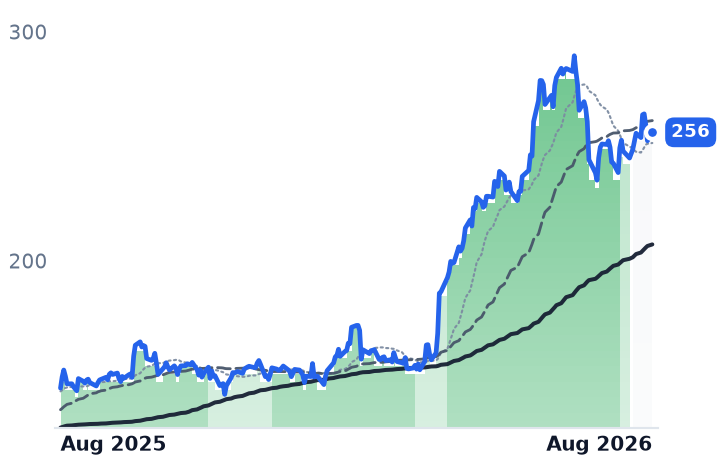
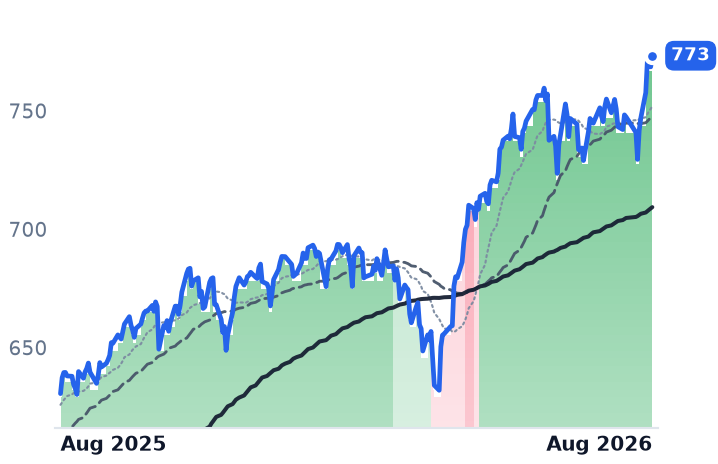
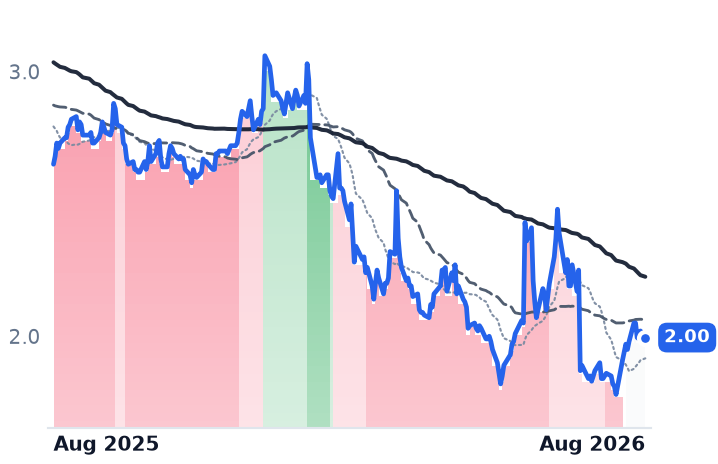
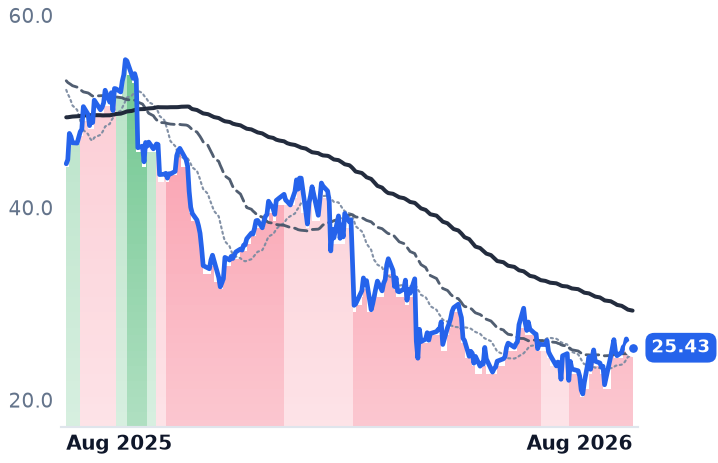
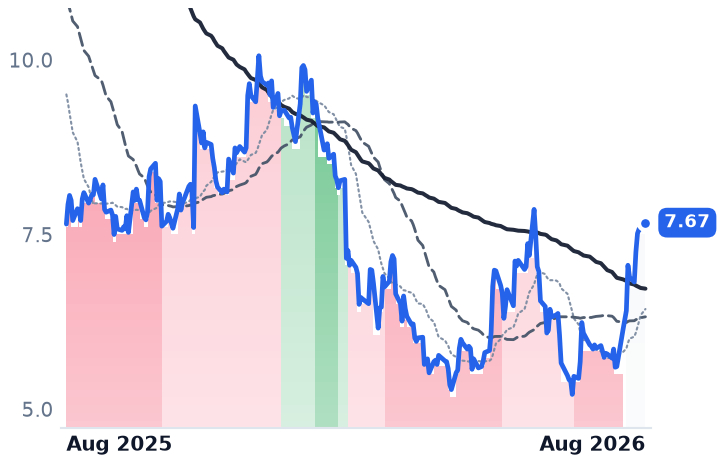
The tape has already moved ahead of the fundamentals in places: DXC, Kyndryl and N-able all climbed out of sustained downtrends into neutral trend structure during July, and CDW's 50-day average pushed further above its 200-day, while IBM alone broke down. Only IBM's chart agrees with its income statement.
The setup
Where it stands — A memory-cost shock is inflating hardware revenue and compressing reseller margins, while IBM and N-able fell for unrelated, company-specific reasons. Would confirm — CDW's next quarter converting adjusted free cash flow back toward 80% of non-GAAP net income as the inventory build unwinds. Would invalidate — CDW gross margin below 20.1% again with full-year gross-profit guidance reduced from mid-single-digit growth. Watch next — CDW and Ingram Micro report third-quarter results in early November 2026; N-able guidance assumes no execution improvement in the second half. Valuation — CDW 12.6x forward versus 16.4x trailing; Ingram 8.3x versus 15.2x; IBM 19.2x forward against roughly 22x in May.