

Cybersecurity Stocks Rallied 9% on Four Sessions and an IBM Miss, Not on Their Own Results
Hypothesis Opus 5 · Research Opus 5 · Writing Opus 5 · Prompt v1.3
A remark from International Business Machines chief executive Arvind Krishna on 14 July — that customers were pausing deals until they knew what artificial-intelligence security would cost — sent seven security and infrastructure software names higher, and a broad software rally on 3-4 August did the rest. Four sessions supplied roughly double the whole month's gain.
The businesses mostly support the story. Fortinet, which sells firewalls, grew revenue 25.6% with billings up 33% and a record 33.7% operating margin. Cloudflare accelerated to 36% growth with net revenue retention at 120%. But Fortinet's reward was 1.9% on the month while Palo Alto's price-to-sales multiple nearly doubled from 14.8x in May to 28.0x, and Okta is growing 11% with consensus modelling 10% next year.
Six of the seven now sit at the top of their twelve-month ranges. Only Zscaler, at 7.0x forward sales, does not — for a documented reason.
| Ticker | Company | Segment | Trend | 30D | 1Y |
|---|---|---|---|---|---|
| The subject · what this brief is about | |||||
CRWD | CrowdStrike | Cybersecurity & Threat Protection | 🔴 Cont. Bear | +14.6% | −49.7% |
PANW | Palo Alto Networks | Cybersecurity & Threat Protection | 🌱 Emerging Bull | +11.6% | +116.4% |
FTNT | Fortinet | Network Security Appliances | 🌱 Emerging Bull | +1.4% | +114.1% |
ZS | Zscaler | AI & Data Intelligence | 🔴 Cont. Bear | +21.1% | −37.8% |
OKTA | Okta | Identity & Access Management | 🌱 Emerging Bull | +7.0% | +67.6% |
NET | Cloudflare | Network & Application Delivery | 🟢 Cont. Bull | +11.9% | +49.3% |
RBRK | Rubrik | Other | 🌱 Emerging Bull | +6.7% | +5.1% |
| Compared against · context, not the story | |||||
IBM | International Business Machines | IT Infrastructure & Operations | ⚠️ Emerging Bear | −17.5% | +2.3% |
SAIL | SailPoint | Identity & Access Management | 🔴 Cont. Bear | +36.1% | +1.7% |
S | SentinelOne | Cybersecurity & Threat Protection | 🌱 Emerging Bull | +19.7% | +35.4% |
QLYS | Qualys | Cybersecurity & Threat Protection | 🔴 Cont. Bear | +20.2% | +43.5% |
TENB | Tenable | Cybersecurity & Threat Protection | 🌱 Emerging Bull | −8.5% | +27.3% |
TEAM | Atlassian | Developer Tools & DevOps | 🔴 Cont. Bear | +67.8% | −6.4% |
PAYC | Paycom Software | HR & Workforce Management | 🔴 Cont. Bear | +54.5% | −2.1% |
WDAY | Workday | Enterprise Resource Planning | 🔴 Cont. Bear | +29.3% | −15.9% |
PLTR | Palantir Technologies | AI & Data Intelligence | ⚠️ Emerging Bear | +35.7% | −5.8% |
SNOW | Snowflake | Data & Analytics Platforms | 🟢 Cont. Bull | +26.4% | +72.3% |
NOW | ServiceNow | Specialized Enterprise Solutions | 🔴 Cont. Bear | +15.9% | −27.1% |
CRM | Salesforce | Customer Experience & CRM | 🔴 Cont. Bear | +18.0% | −16.7% |
NVDA | NVIDIA | AI & Data Center GPUs | 🟢 Cont. Bull | +6.2% | +23.0% |
AVGO | Broadcom | Semiconductor Subsystems | 🟢 Cont. Bull | +6.9% | +41.6% |
MU | Micron Technology | Memory (DRAM/NAND) | 🟢 Cont. Bull | −10.4% | +610.3% |
AMD | Advanced Micro Devices | AI & Data Center GPUs | 🟢 Cont. Bull | −13.4% | +180.6% |
QCOM | QUALCOMM Incorporated | RF & Wireless | 🟢 Cont. Bull | −11.3% | +15.4% |
DDOG | Datadog | Data & Analytics Platforms | 🟢 Cont. Bull | −9.2% | +81.6% |
AKAM | Akamai Technologies | Network & Application Delivery | 🟢 Cont. Bull | −12.4% | +56.6% |
MSFT | Microsoft | Cloud Infrastructure & Platforms | 🔴 Cont. Bear | +29.8% | −3.6% |
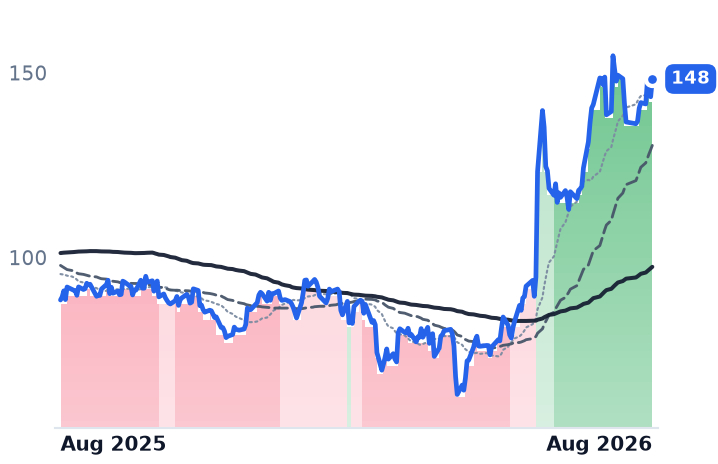
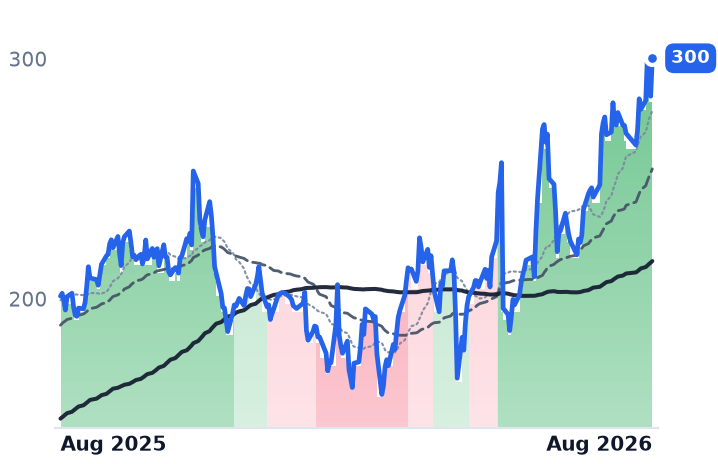
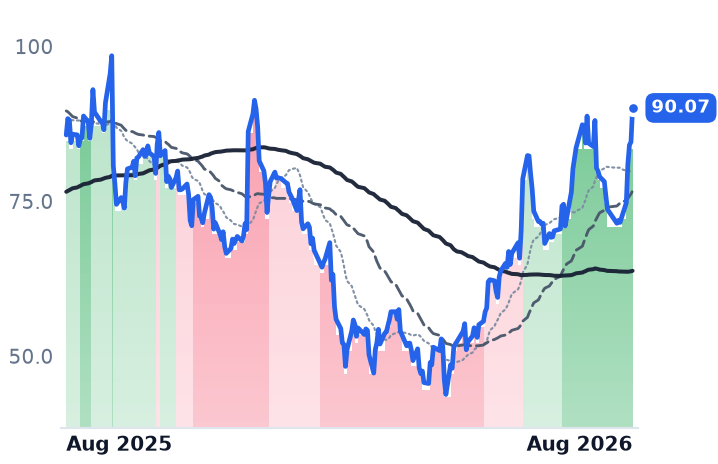
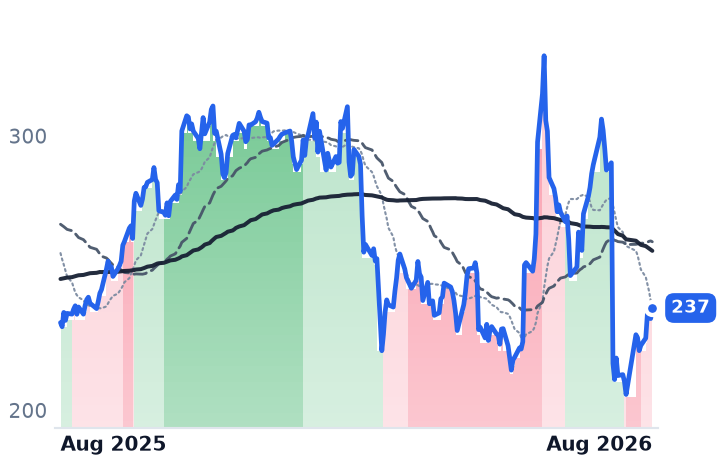
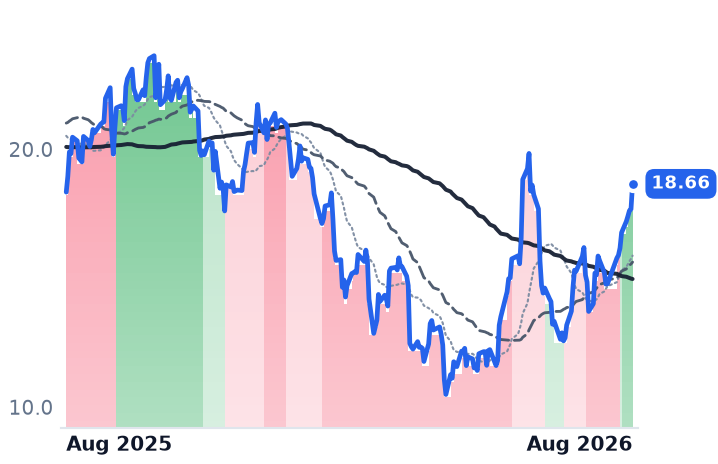
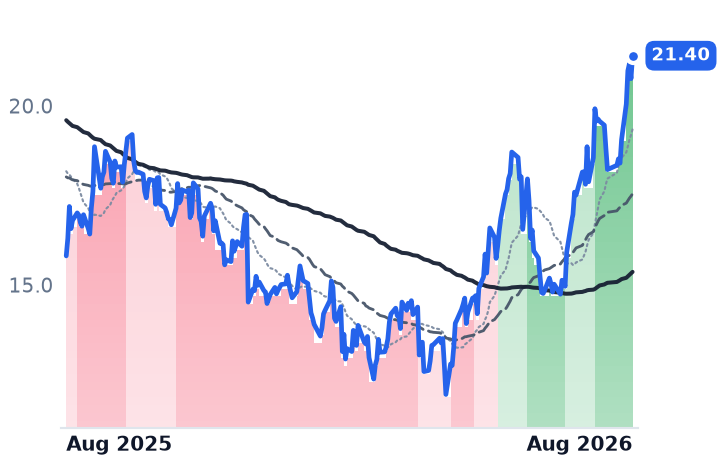
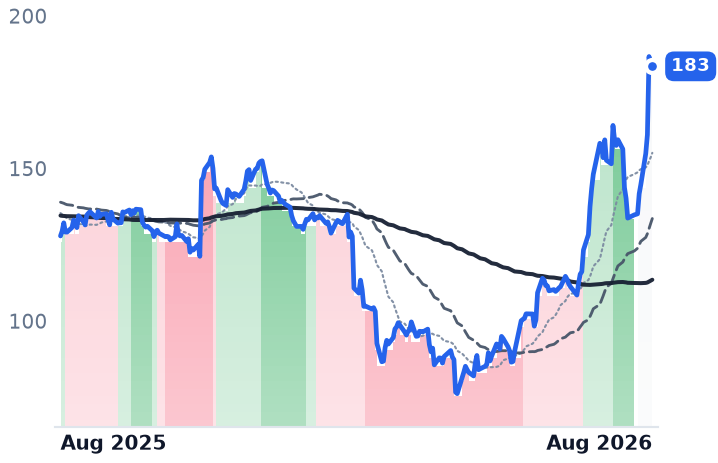
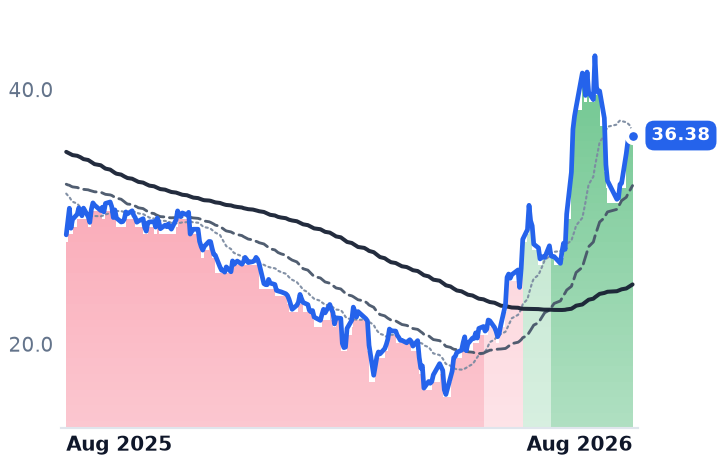
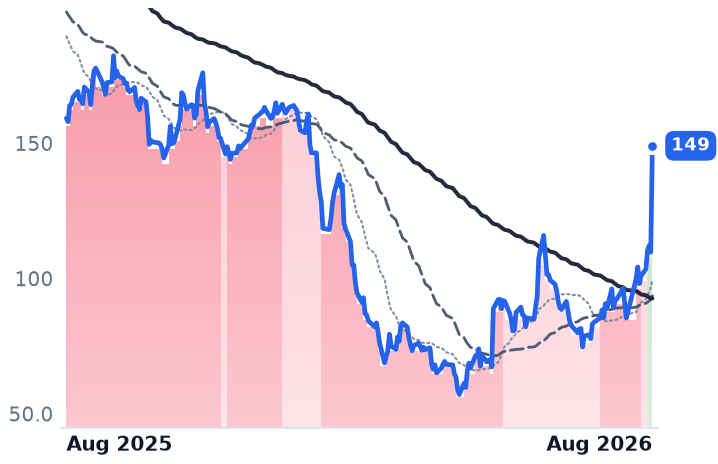
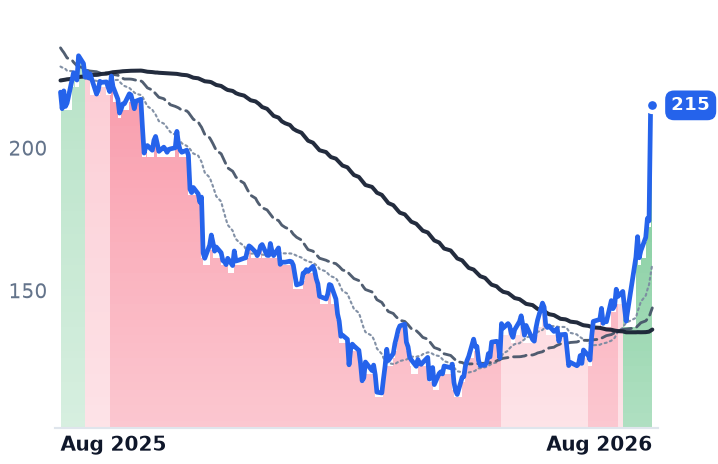
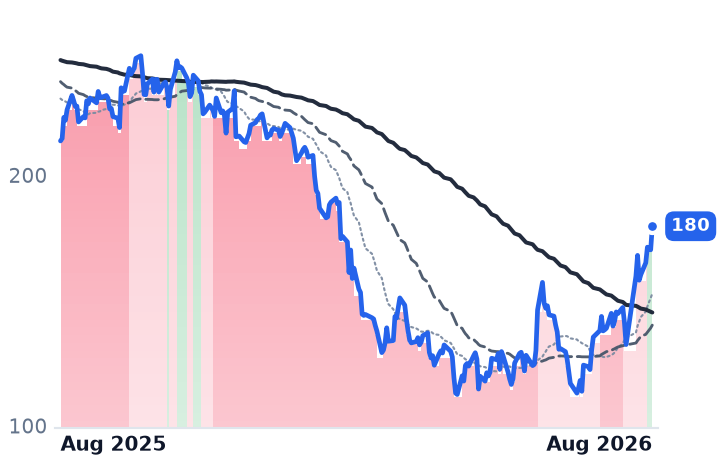
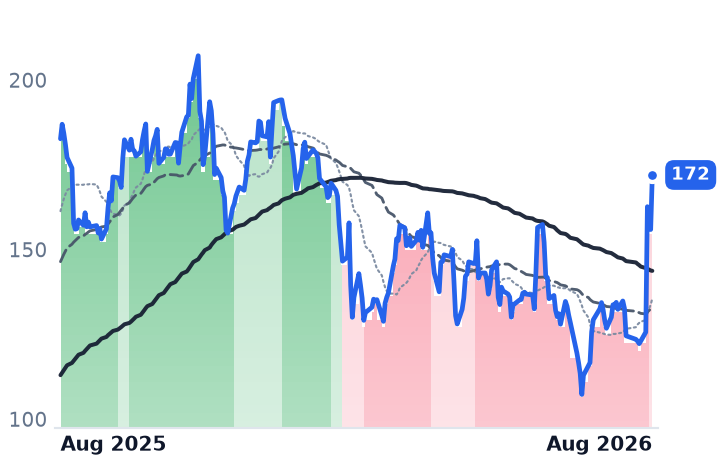
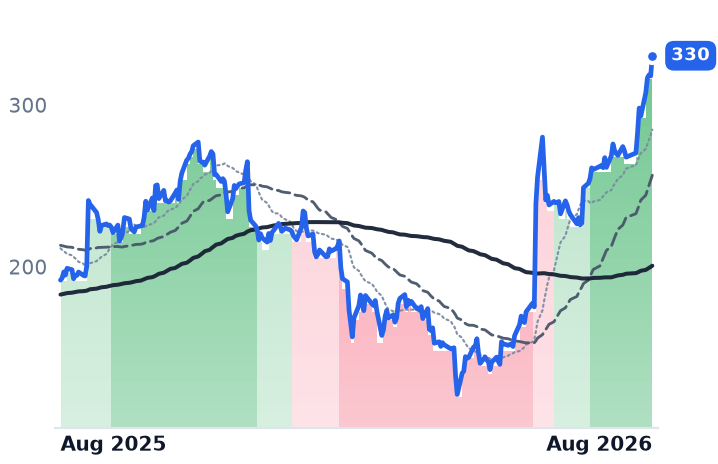
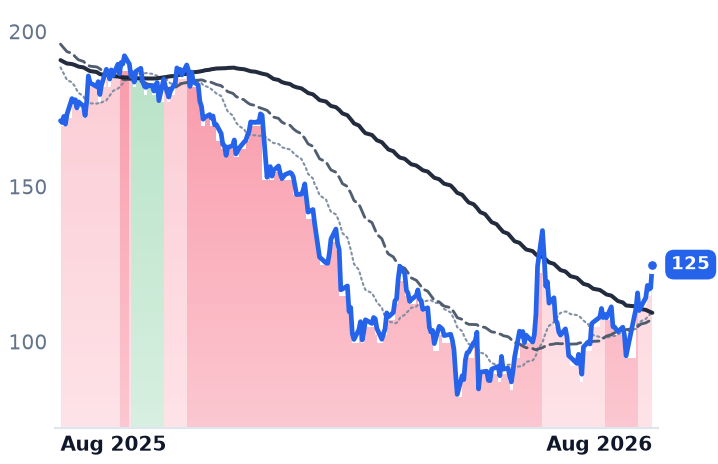
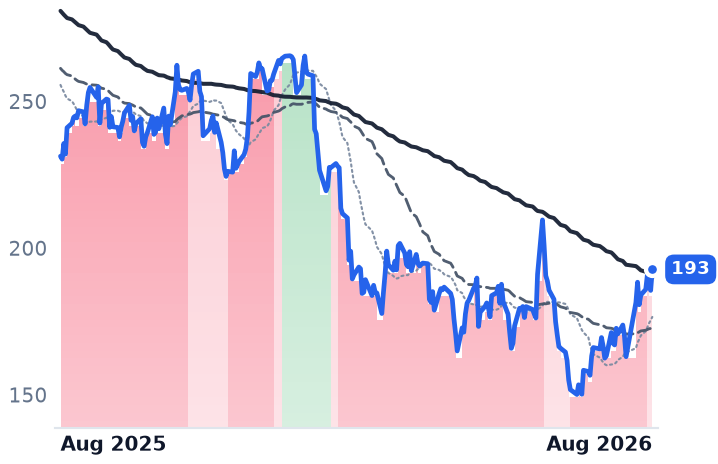
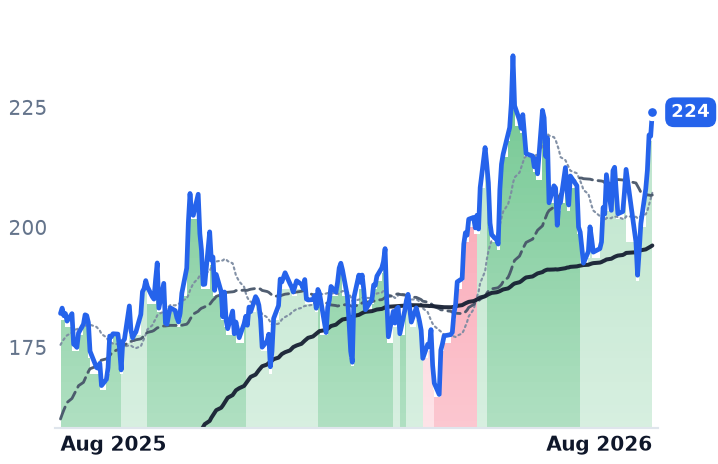
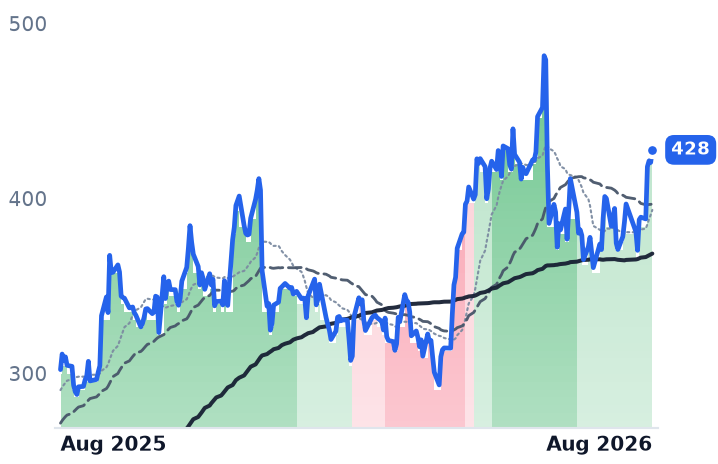
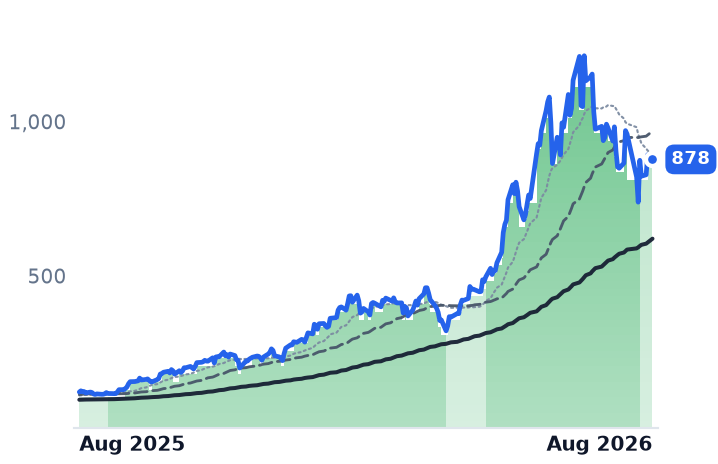
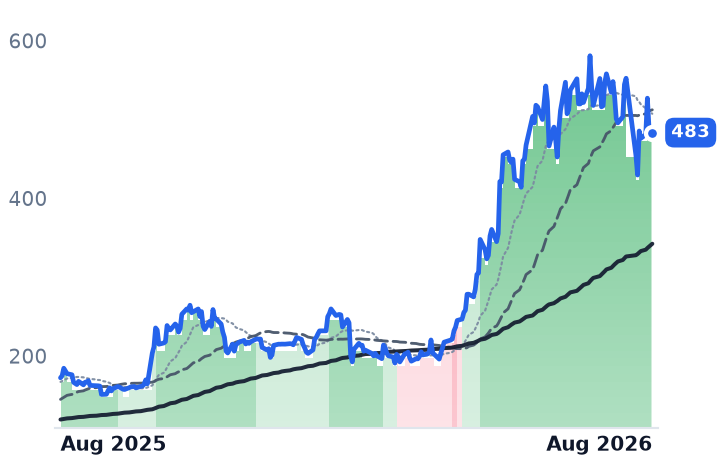
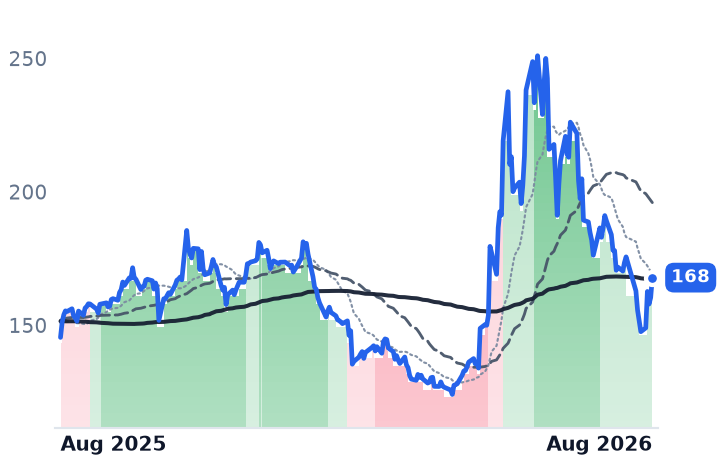
12-month price & trend
| Ticker | Mkt cap | P/E | P/E fwd | P/S | P/S fwd | P/GP | P/GP fwd | EV/EBITDA | FCF yld |
|---|---|---|---|---|---|---|---|---|---|
CRWD | $218.3B | n/m | 174.2x | 42.9x | 36.7x | 57.2x | 48.9x | 641.2x | 0.7% |
PANW | $296.5B | 305.8x | 88.4x | 28.0x | 21.4x | 38.9x | 29.7x | 130.0x | 1.4% |
FTNT | $117.1B | 55.8x | 46.6x | 15.6x | 14.5x | 19.4x | 18.0x | 39.6x | 2.7% |
| Ticker | Mkt cap | P/E | P/E fwd | P/S | P/S fwd | P/GP | P/GP fwd | EV/EBITDA | FCF yld |
|---|---|---|---|---|---|---|---|---|---|
ZS | $27.3B | n/m | 36.8x | 8.6x | 7.0x | 11.2x | 9.1x | 231.2x | 3.5% |
OKTA | $24.6B | 105.9x | 38.6x | 8.2x | 7.7x | 10.6x | 9.9x | 67.5x | 3.7% |
NET | $106.6B | n/m | 250.8x | 42.4x | 37.9x | 58.4x | 52.2x | — | 0.4% |
| Ticker | Mkt cap | P/E | P/E fwd | P/S | P/S fwd | P/GP | P/GP fwd | EV/EBITDA | FCF yld |
|---|---|---|---|---|---|---|---|---|---|
RBRK | $18.5B | n/m | 290.3x | 13.0x | 11.3x | 16.1x | 14.0x | n/m | 1.7% |
IBM | $214.3B | 19.9x | 18.4x | 3.1x | 3.0x | 5.3x | 5.1x | 16.8x | 6.8% |
SAIL | $10.6B | n/m | — | 9.4x | — | 14.2x | — | 809.6x | 1.7% |
| Ticker | Mkt cap | P/E | P/E fwd | P/S | P/S fwd | P/GP | P/GP fwd | EV/EBITDA | FCF yld |
|---|---|---|---|---|---|---|---|---|---|
S | $7.2B | n/m | 61.3x | 6.9x | 6.0x | 9.3x | 8.1x | n/m | 0.6% |
QLYS | $3.2B | 15.9x | 11.9x | 4.6x | 4.4x | 5.5x | 5.3x | 11.4x | 9.2% |
TENB | $2.4B | n/m | 11.0x | 2.3x | 2.2x | 2.9x | 2.8x | 23.3x | 11.1% |
| Ticker | Mkt cap | P/E | P/E fwd | P/S | P/S fwd | P/GP | P/GP fwd | EV/EBITDA | FCF yld |
|---|---|---|---|---|---|---|---|---|---|
TEAM | $39.2B | n/m | 24.5x | 3.4x | 5.3x | 4.0x | 6.3x | 223.1x | 5.5% |
PAYC | $11.7B | 22.8x | 18.0x | 5.5x | 5.3x | 6.9x | 6.6x | 13.9x | 6.4% |
WDAY | $47.1B | 55.8x | 16.7x | 4.8x | 4.4x | 6.3x | 5.8x | 30.0x | 6.3% |
| Ticker | Mkt cap | P/E | P/E fwd | P/S | P/S fwd | P/GP | P/GP fwd | EV/EBITDA | FCF yld |
|---|---|---|---|---|---|---|---|---|---|
PLTR | $394.9B | 136.5x | 108.2x | 64.2x | 48.6x | 75.7x | 57.3x | 126.8x | 0.9% |
SNOW | $114.5B | n/m | 171.1x | 22.8x | 18.8x | 34.0x | 28.0x | n/m | 1.0% |
NOW | $129.1B | 77.6x | 30.7x | 8.8x | 8.0x | 11.8x | 10.7x | 38.7x | 3.5% |
| Ticker | Mkt cap | P/E | P/E fwd | P/S | P/S fwd | P/GP | P/GP fwd | EV/EBITDA | FCF yld |
|---|---|---|---|---|---|---|---|---|---|
CRM | $157.9B | 22.2x | 13.6x | 3.7x | 3.4x | 4.8x | 4.4x | 13.6x | 9.3% |
NVDA | $5.4T | 34.0x | 24.8x | 21.3x | 13.7x | 28.7x | 18.5x | 28.0x | 2.2% |
AVGO | $2.0T | 69.1x | 36.9x | 27.0x | 19.3x | 40.3x | 28.8x | 49.5x | 1.6% |
| Ticker | Mkt cap | P/E | P/E fwd | P/S | P/S fwd | P/GP | P/GP fwd | EV/EBITDA | FCF yld |
|---|---|---|---|---|---|---|---|---|---|
MU | $1.0T | 19.9x | 12.2x | 11.2x | 7.8x | 15.4x | 10.7x | 14.5x | 2.6% |
AMD | $788.2B | 122.7x | 63.6x | 19.1x | 15.4x | 35.9x | 28.9x | 73.5x | 1.1% |
QCOM | $168.4B | 18.3x | 15.1x | 3.8x | 3.9x | 7.0x | 7.2x | 13.3x | 6.2% |
| Ticker | Mkt cap | P/E | P/E fwd | P/S | P/S fwd | P/GP | P/GP fwd | EV/EBITDA | FCF yld |
|---|---|---|---|---|---|---|---|---|---|
DDOG | $83.3B | 470.5x | 95.8x | 21.0x | 19.0x | 26.4x | 23.9x | 319.5x | 1.4% |
AKAM | $16.7B | 38.3x | 17.2x | 3.9x | 3.7x | 6.9x | 6.6x | 16.6x | 4.6% |
MSFT | $3.7T | 27.8x | 25.5x | 11.2x | 9.5x | 16.5x | 14.0x | 18.4x | 1.8% |
Valuation & fundamentals
Consensus projections
| Ticker | FY2026E | FY2027E | FY2028E | |
|---|---|---|---|---|
CRWD | Revenue | +22.2% | +23.7% | +21.8% |
| EPS | −1.2% | +32.6% | +26.5% | |
PANW | Revenue | +24.3% | +21.1% | +14.1% |
| EPS | +15.3% | +9.0% | +17.6% | |
FTNT | Revenue | +19.8% | +11.3% | +10.9% |
| EPS | +27.0% | +9.4% | +13.3% | |
ZS | Revenue | +25.2% | +16.9% | +16.7% |
| EPS | +29.0% | +11.2% | +17.6% | |
OKTA | Revenue | +12.0% | +10.0% | +9.5% |
| EPS | +24.3% | +11.7% | +10.8% | |
NET | Revenue | +31.0% | +27.9% | +27.4% |
| EPS | +31.0% | +32.8% | +38.3% | |
RBRK | Revenue | +48.7% | +28.4% | +21.5% |
| EPS | −90.5% | −278.4% | +106.3% | |
IBM | Revenue | +5.3% | +4.0% | +5.3% |
| EPS | +8.5% | +7.0% | +8.8% | |
S | Revenue | +22.4% | +19.9% | +17.6% |
| EPS | +723.4% | +83.7% | +43.0% | |
QLYS | Revenue | +8.6% | +7.0% | +6.6% |
| EPS | +8.6% | +9.2% | +5.3% | |
TENB | Revenue | +8.4% | +7.1% | +6.9% |
| EPS | +27.0% | +10.5% | +10.1% | |
TEAM | Revenue | +24.7% | +13.4% | +15.9% |
| EPS | +55.5% | +10.5% | +18.0% | |
PAYC | Revenue | +7.6% | +7.1% | +8.5% |
| EPS | +29.5% | +15.1% | +10.5% | |
WDAY | Revenue | +13.4% | +11.8% | +11.0% |
| EPS | +26.5% | +18.5% | +17.3% | |
PLTR | Revenue | +86.1% | +49.3% | +48.2% |
| EPS | +122.1% | +42.4% | +50.3% | |
SNOW | Revenue | +29.4% | +30.9% | +25.7% |
| EPS | +72.3% | +59.4% | +41.1% | |
NOW | Revenue | +22.4% | +18.7% | +18.6% |
| EPS | +17.1% | +23.2% | +21.4% | |
CRM | Revenue | +9.3% | +11.1% | +9.4% |
| EPS | +17.4% | +20.2% | +10.4% | |
NVDA | Revenue | +65.1% | +84.2% | +43.2% |
| EPS | +59.0% | +91.7% | +42.0% | |
AVGO | Revenue | +66.6% | +65.5% | +33.9% |
| EPS | +71.7% | +68.7% | +33.7% | |
MU | Revenue | +248.0% | +92.8% | +11.4% |
| EPS | +804.9% | +111.2% | +7.9% | |
AMD | Revenue | +49.6% | +68.8% | +37.0% |
| EPS | +91.9% | +98.7% | +42.7% | |
QCOM | Revenue | −1.3% | +4.2% | +15.1% |
| EPS | −10.8% | −2.6% | +26.8% | |
DDOG | Revenue | +28.9% | +21.5% | +23.5% |
| EPS | +20.9% | +17.3% | +23.1% | |
AKAM | Revenue | +7.4% | +10.9% | +10.4% |
| EPS | −4.9% | +6.7% | +10.7% | |
MSFT | Revenue | +18.0% | +18.2% | +19.6% |
| EPS | +26.7% | +15.4% | +18.5% |
Forward fiscal years only. Blank means no analyst coverage for that year.
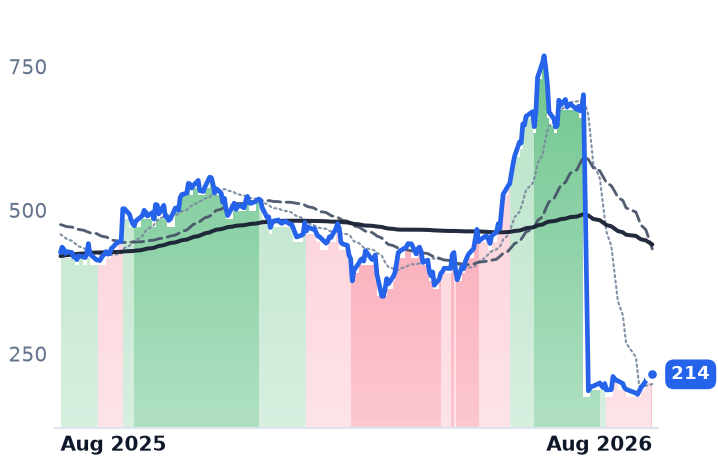
On 14 July, International Business Machines — the mainframe, software and consulting group — pre-announced a quarter that badly missed. Chief executive Arvind Krishna told investors clients "were distracted with rapidly-evolving, industry-wide cybersecurity concerns in the quarter," and named Anthropic's frontier model Mythos as the reason customers would "pause on new deals until they know" how much to spend defending themselves. Preliminary revenue of $17.2bn missed the $17.9bn consensus and IBM fell 25.2%. Investors read it as budget moving out of one line and into another: CrowdStrike rose 12.1% that session, Okta 10.8%, Zscaler 7.2%, Palo Alto Networks 6.8%.
That was the largest single day of the month for this group of seven, and it was genuinely about security. The rest was not. Four sessions — 14 July, and 3, 4 and 7 August — delivered 18.6 percentage points of equal-weighted daily return against a month that finished around 9.0% equal-weighted and 10.6% weighted by market value. Every other session was net negative. The 4 August leg was simply the market: the Nasdaq Composite rose 2.59% and the S&P 500 1.79%, with Palantir up 29% on earnings. Over the same thirty days Atlassian gained 74%, Paycom 55% and Workday 30%, and security vendors outside this group — SailPoint, SentinelOne, Qualys — all rose more than 19%. Cybersecurity followed the software tape; it did not lead it.
A stock split that hid a doubling
Any screen run on unadjusted prices reports CrowdStrike, the endpoint-security vendor whose Falcon platform monitors laptops and cloud workloads, as down 49.6% over twelve months. It is not. The board approved a four-for-one split on 3 June, effective 2 July. Corrected, CrowdStrike is up 101.8%, and the group's equal-weight twelve-month return is roughly 56%, not the 37.8% an uncorrected table produces.
The businesses: four confirm, one contradicts
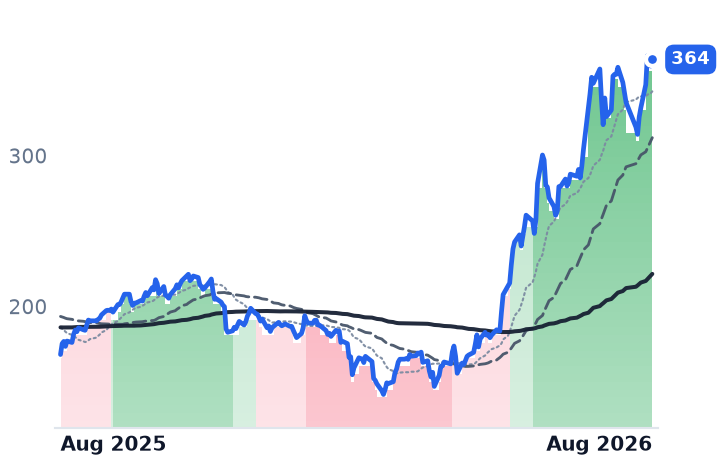
Fortinet, which builds FortiGate firewall appliances and a single in-house security operating system spanning branch networking, endpoint and security operations, had the best quarter of the seven: revenue up 25.6% to $2.048bn, billings up 33% and product revenue up 52%, with GAAP operating margin at a record 33.7% against 28.0% a year earlier and free cash flow more than tripling to $966m. It gained 1.9% on the month and its price-to-sales multiple moved from 15.46x to 15.56x. It is the only member whose advance is earnings rather than re-rating.
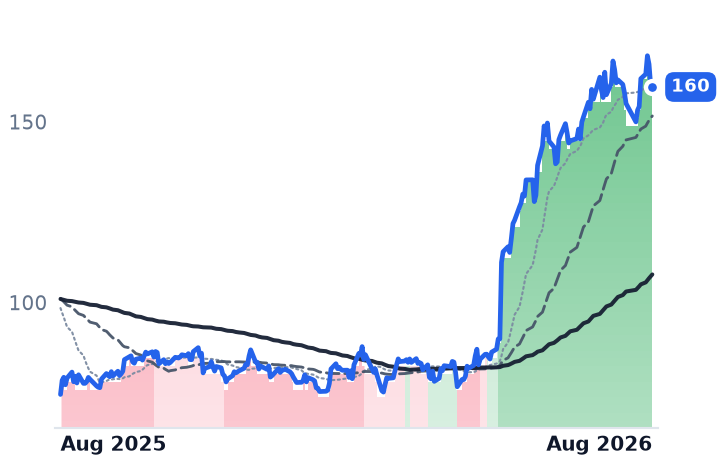
Cloudflare, which runs a global edge network selling content delivery, denial-of-service protection and increasingly serverless developer compute, reported revenue up 36% to $696.1m, a fourth straight acceleration, with dollar-based net retention up six points year over year to 120% and gross margin rising sequentially for the first time in eight quarters. But management's 6 August narrative was the Workers developer platform — two million developers added in one quarter versus 1.5 million in all of 2025 — and agent traffic now exceeding half the network. That is edge compute, not security.
Palo Alto, the largest name here at $296.5bn and a seller of firewalls plus cloud and security-operations subscriptions, grew 31.1% last quarter against 14.9% the quarter before. The step-change is largely bought: of $8.1bn in next-generation security annual recurring revenue, $1.6bn came from acquisitions, principally CyberArk. Gross margin fell to 67.6% from 72.9% and the company posted a GAAP operating loss.
CrowdStrike accelerated for a fourth quarter to 25.6% on record net-new annual recurring revenue of $255.8m, up 32%, as concession packages from its 2024 outage rolled off. Rubrik, the data-backup and ransomware-recovery vendor and the group's only recent listing, grows fastest at 39% — but that is down from 51.2% four quarters ago. Okta, which sells corporate single sign-on and multi-factor authentication, contradicts outright: 11.2% growth, stuck in an 11-13% band for five quarters, with consensus modelling 10.0% next year and 9.5% after that.
Business verdict: CONFIRMS at Fortinet, CrowdStrike and Cloudflare, INCONCLUSIVE at Palo Alto and Rubrik, CONTRADICTS at Okta.
What the prices have already taken
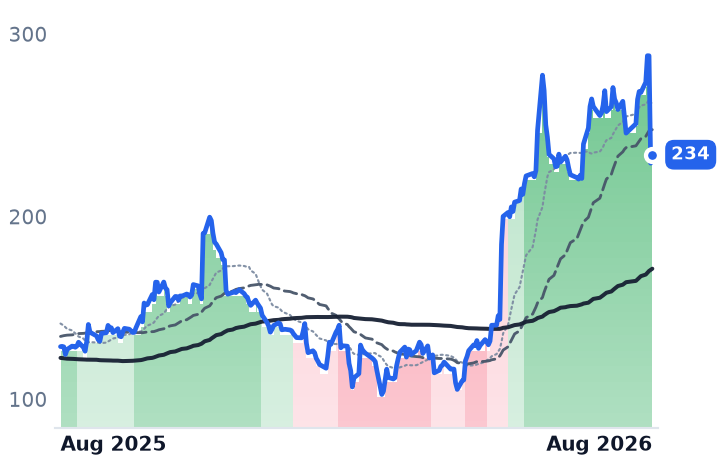
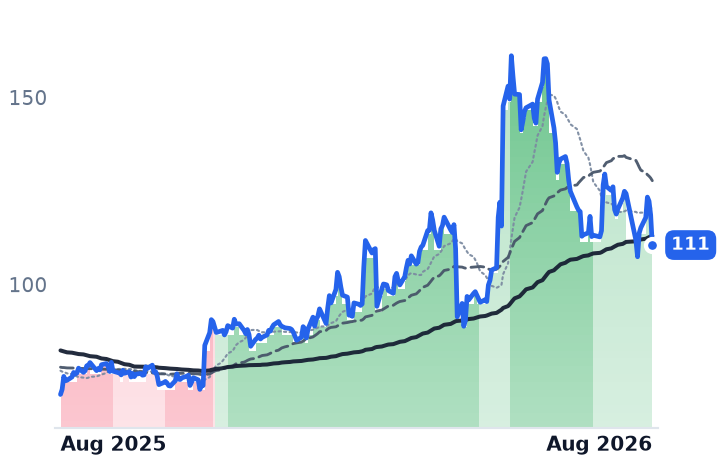
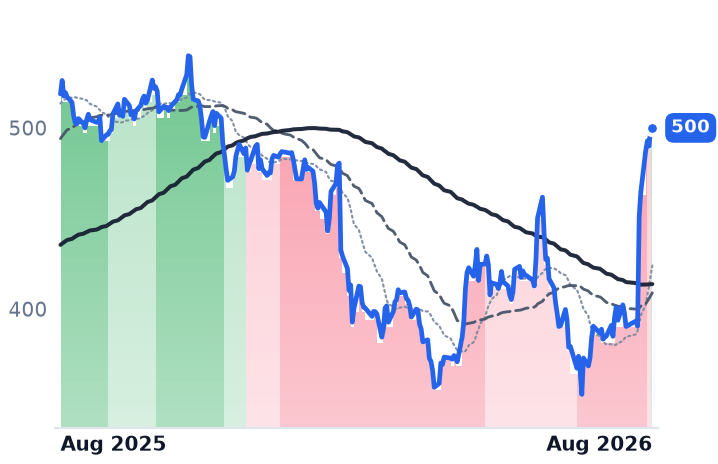
Every one of the seven trades at a higher price-to-sales multiple than nine sessions ago, with no intervening earnings at five of them: Rubrik from 10.32x to 13.01x, CrowdStrike 36.34x to 42.86x, Palo Alto 24.51x to 27.96x. Palo Alto's has gone from 14.8x in May to 28.0x. Six sit at or near the top of their twelve-month ranges — Cloudflare at 99% of its range, Palo Alto 99%, Okta 93%, Fortinet 91%, Rubrik 85%, CrowdStrike at a split-adjusted high. Okta's forward price-to-earnings of 38.6x is roughly four times its expected growth rate.
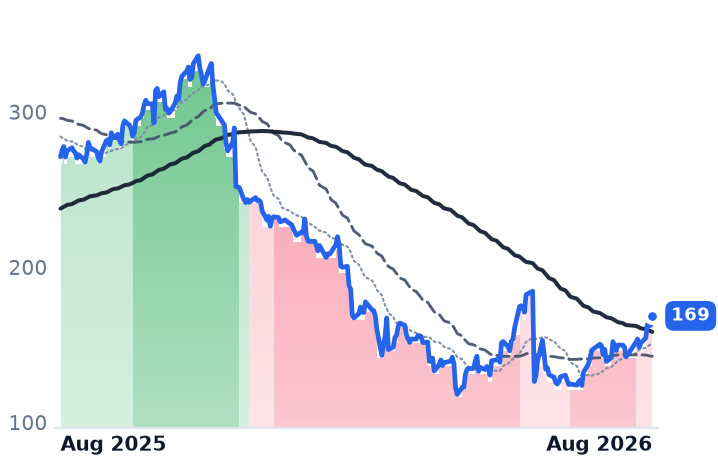
The exception is Zscaler, at 8.6x trailing and 7.0x forward sales on 25.4% growth, sitting at 23% of its own range. That discount is not an oversight: the shares fell 31% in a session in May after management cut fiscal 2027 growth guidance to 16-17% from a Street near 20% and disclosed sales-leadership turnover.
Valuation verdict: CONTRADICTS for six of seven. Fortinet, at 14.5x forward sales, 46.6x forward earnings and a 2.7% free-cash-flow yield, is the one whose multiple has not run ahead of its numbers.
One technical note, because it cuts against the framing: Zscaler led the month at 17.5% while sitting in a downtrend, its 50-day average below its 200-day since June, and CrowdStrike's own trend deteriorated through July even as it rose. Cloudflare's unbroken uptrend since 5 May is matched day-for-day by Fortinet's.
Finally, coherence. Of $33.3bn in combined trailing revenue, 79% comes from four core security vendors. An equal-weighted average of the seven gives 43% of its weight to Cloudflare, Okta and Rubrik — an edge network, an identity seat business and a backup vendor.
The setup
Where it stands — Four sessions and two names carried the month; only Fortinet's advance is backed by fresh, accelerating results. Would confirm — Palo Alto's mid-August quarter showing organic next-generation ARR growth above 30% excluding CyberArk. Would invalidate — CrowdStrike's 2 September net-new ARR falling below $255.8m, breaking the four-quarter acceleration. Watch next — Okta reports 26 August, Rubrik 27 August, CrowdStrike 2 September. Valuation — Group spans Zscaler at 7.0x forward sales to CrowdStrike at 36.7x; Palo Alto's trailing multiple has doubled since May.