

Atlassian Seat Growth Revives, but the Stock Priced a Better Story Than the Guide Tells
Hypothesis Opus 5 · Research Opus 5 · Writing Opus 5 · Prompt v1.2
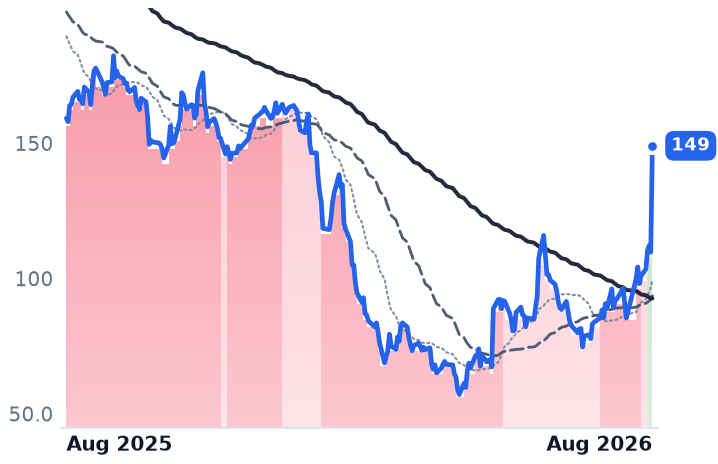
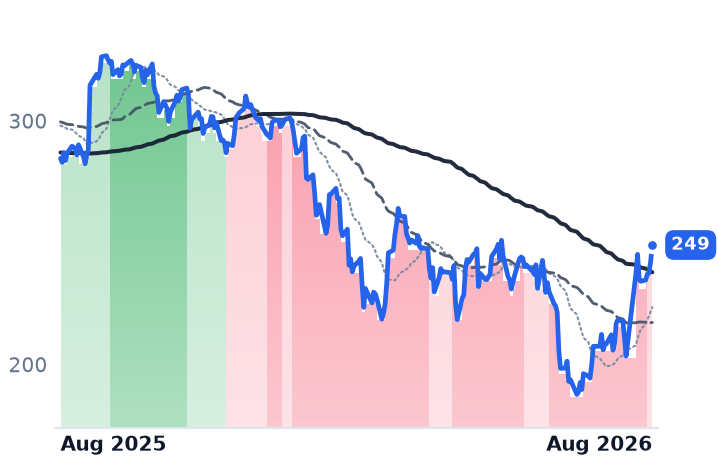
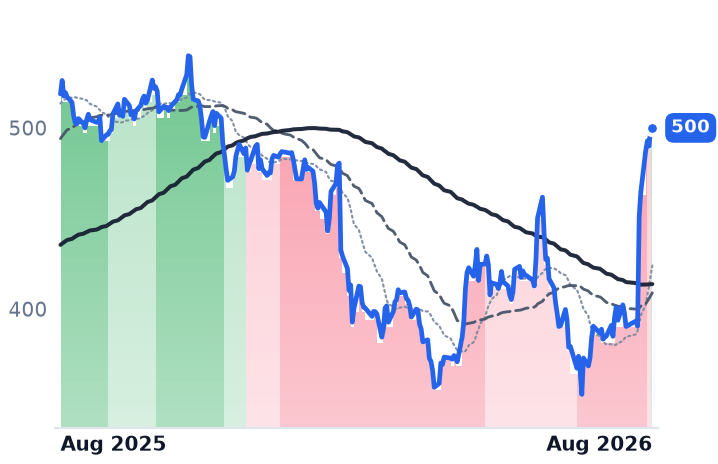
Atlassian, the maker of Jira and Confluence project-tracking software sold by the user seat, told investors on 6 August that seat counts in its core products are expanding again — reversing the first-ever enterprise seat decline it disclosed in May, the single scariest data point for the theory that artificial-intelligence coding agents delete software licences. The stock rose 35.3% the next session on 20.1m shares, against a 2-5m norm.
The business supports the news; the price now runs ahead of it. Fiscal 2026 revenue grew 26% to $6.57bn with the first positive full-year operating income in company history, but management guided fiscal 2027 subscription recurring revenue to 18% growth from 23%, total growth to roughly 13%, and adjusted operating margin down to 25% from 36%. Atlassian re-rated from 4.10x to 5.96x trailing sales in nine sessions.
Seven other design and engineering-software names moved with it — and only two share its economics.
| Ticker | Company | Segment | Trend | 30D | 1Y |
|---|---|---|---|---|---|
| The subject · what this brief is about | |||||
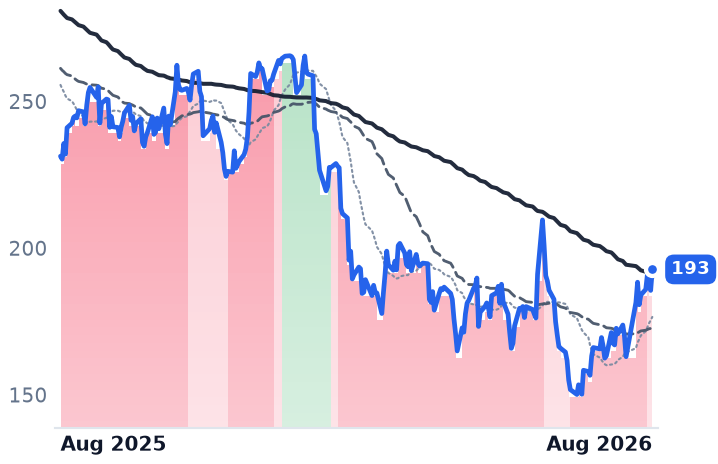
TEAM | Atlassian | Developer Tools & DevOps | 🔴 Cont. Bear | +67.8% | −6.4% |
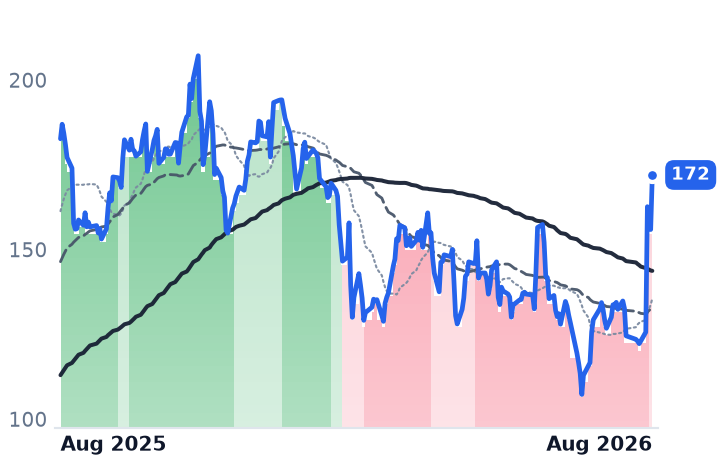
GTLB | GitLab | Developer Tools & DevOps | 🌱 Emerging Bull | +20.2% | +0.4% |
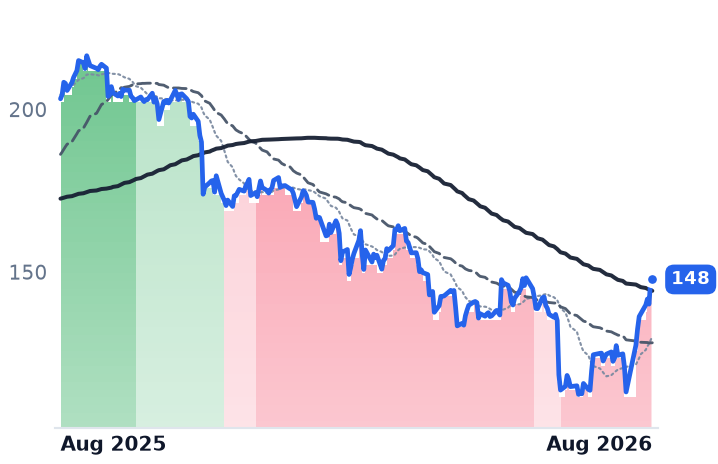
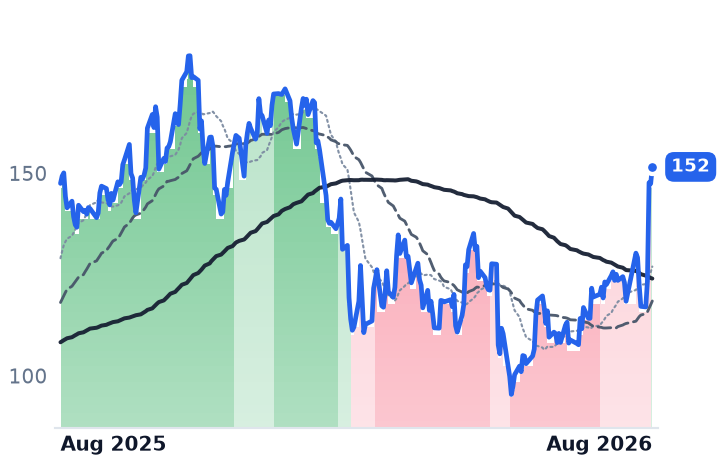
FIG | Figma | Design & Content Creation | 🔴 Cont. Bear | +10.3% | −71.8% |
ADBE | Adobe | Design & Content Creation | 🔴 Cont. Bear | +18.6% | −20.5% |
ADSK | Autodesk | Design & Content Creation | 🔴 Cont. Bear | +19.5% | −12.5% |
PTC | PTC | Specialized Enterprise Solutions | 🔴 Cont. Bear | +18.4% | −27.3% |
CDNS | Cadence Design Systems | Developer Tools & DevOps | 🌱 Emerging Bull | −11.7% | −2.8% |
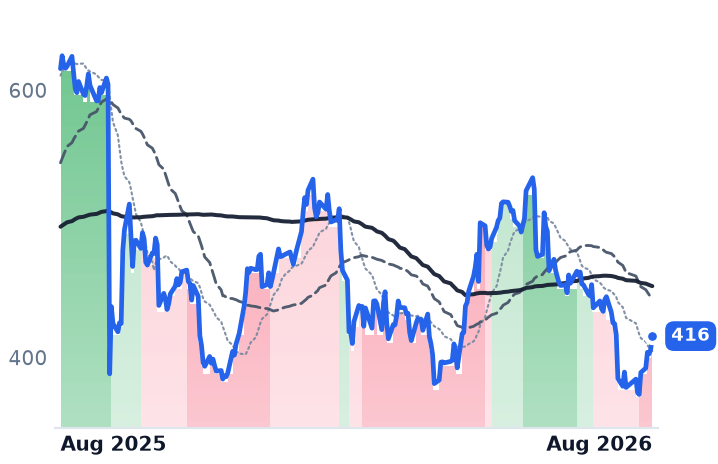
SNPS | Synopsys | EDA & Design Tools | 🔴 Cont. Bear | −6.6% | −32.5% |
| Compared against · context, not the story | |||||
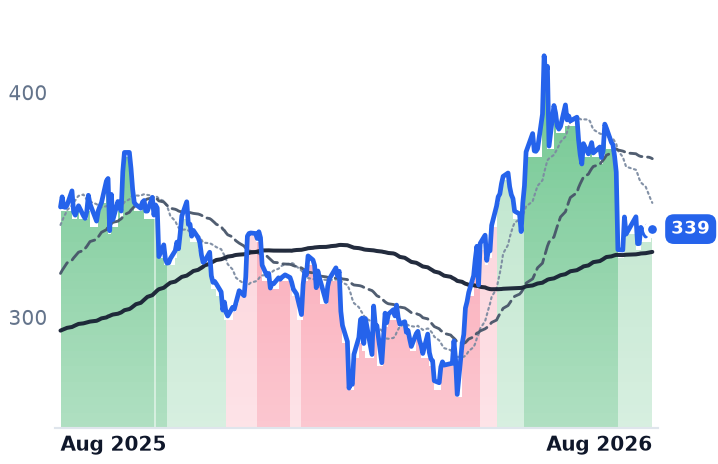
MSFT | Microsoft | Cloud Infrastructure & Platforms | 🔴 Cont. Bear | +29.8% | −3.6% |
WDAY | Workday | Enterprise Resource Planning | 🔴 Cont. Bear | +29.3% | −15.9% |
SNOW | Snowflake | Data & Analytics Platforms | 🟢 Cont. Bull | +26.4% | +72.3% |
NOW | ServiceNow | Specialized Enterprise Solutions | 🔴 Cont. Bear | +15.9% | −27.1% |
CRM | Salesforce | Customer Experience & CRM | 🔴 Cont. Bear | +18.0% | −16.7% |
PLTR | Palantir Technologies | AI & Data Intelligence | ⚠️ Emerging Bear | +35.7% | −5.8% |
SHOP | Shopify | Marketplace & Commerce Platforms | ⚠️ Emerging Bear | +23.7% | +2.8% |
DDOG | Datadog | Data & Analytics Platforms | 🟢 Cont. Bull | −9.2% | +81.6% |
INTU | Intuit | Enterprise Resource Planning | 🔴 Cont. Bear | +18.3% | −53.6% |
APP | AppLovin | Marketing & Advertising Technology | ⚠️ Emerging Bear | −31.6% | −25.5% |
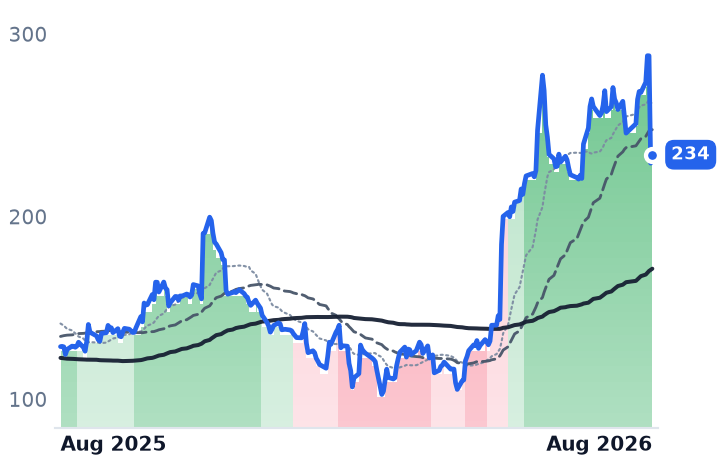
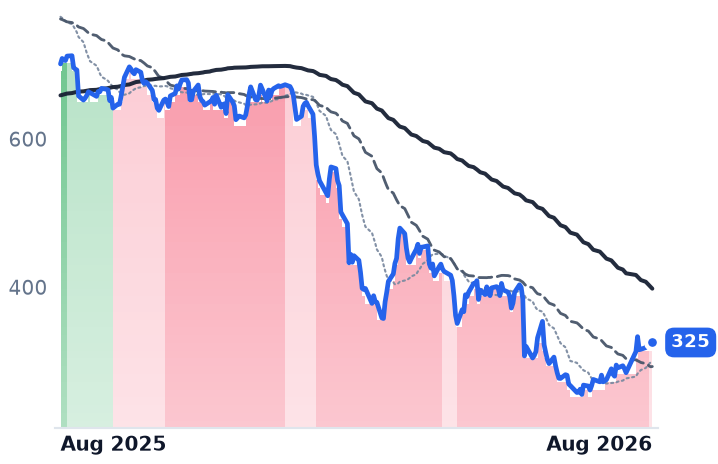
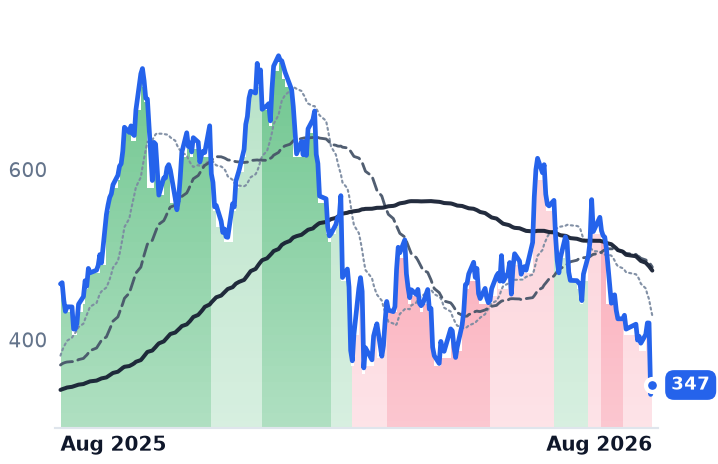
12-month price & trend
| Ticker | Mkt cap | P/E | P/E fwd | P/S | P/S fwd | P/GP | P/GP fwd | EV/EBITDA | FCF yld |
|---|---|---|---|---|---|---|---|---|---|
TEAM | $39.2B | n/m | 24.5x | 3.4x | 5.3x | 4.0x | 6.3x | 223.1x | 5.5% |
GTLB | $6.6B | n/m | 48.0x | 6.6x | 5.9x | 7.6x | 6.8x | n/m | 4.0% |
FIG | $11.4B | n/m | 81.3x | 8.9x | 7.7x | 11.2x | 9.7x | n/m | 2.8% |
| Ticker | Mkt cap | P/E | P/E fwd | P/S | P/S fwd | P/GP | P/GP fwd | EV/EBITDA | FCF yld |
|---|---|---|---|---|---|---|---|---|---|
ADBE | $105.4B | 15.2x | 10.9x | 4.2x | 4.0x | 4.7x | 4.5x | 10.8x | 10.1% |
ADSK | $52.6B | 36.1x | 19.8x | 7.0x | 6.4x | 7.7x | 7.0x | 24.3x | 5.2% |
PTC | $17.1B | 14.2x | 18.1x | 5.8x | 6.3x | 6.9x | 7.5x | 10.9x | 5.5% |
| Ticker | Mkt cap | P/E | P/E fwd | P/S | P/S fwd | P/GP | P/GP fwd | EV/EBITDA | FCF yld |
|---|---|---|---|---|---|---|---|---|---|
CDNS | $93.4B | 67.0x | 41.7x | 16.0x | 14.8x | 18.1x | 16.7x | 43.8x | 1.8% |
SNPS | $79.7B | 94.1x | 28.1x | 9.2x | 8.2x | 12.5x | 11.2x | 32.5x | 3.4% |
MSFT | $3.7T | 27.8x | 25.5x | 11.2x | 9.5x | 16.5x | 14.0x | 18.4x | 1.8% |
| Ticker | Mkt cap | P/E | P/E fwd | P/S | P/S fwd | P/GP | P/GP fwd | EV/EBITDA | FCF yld |
|---|---|---|---|---|---|---|---|---|---|
WDAY | $47.1B | 55.8x | 16.7x | 4.8x | 4.4x | 6.3x | 5.8x | 30.0x | 6.3% |
SNOW | $114.5B | n/m | 171.1x | 22.8x | 18.8x | 34.0x | 28.0x | n/m | 1.0% |
NOW | $129.1B | 77.6x | 30.7x | 8.8x | 8.0x | 11.8x | 10.7x | 38.7x | 3.5% |
| Ticker | Mkt cap | P/E | P/E fwd | P/S | P/S fwd | P/GP | P/GP fwd | EV/EBITDA | FCF yld |
|---|---|---|---|---|---|---|---|---|---|
CRM | $157.9B | 22.2x | 13.6x | 3.7x | 3.4x | 4.8x | 4.4x | 13.6x | 9.3% |
PLTR | $394.9B | 136.5x | 108.2x | 64.2x | 48.6x | 75.7x | 57.3x | 126.8x | 0.9% |
SHOP | $130.1B | 98.1x | 54.7x | 10.5x | 8.8x | 21.9x | 18.3x | 80.5x | 1.6% |
| Ticker | Mkt cap | P/E | P/E fwd | P/S | P/S fwd | P/GP | P/GP fwd | EV/EBITDA | FCF yld |
|---|---|---|---|---|---|---|---|---|---|
DDOG | $83.3B | 470.5x | 95.8x | 21.0x | 19.0x | 26.4x | 23.9x | 319.5x | 1.4% |
INTU | $89.0B | 19.7x | 11.9x | 4.3x | 3.7x | 5.3x | 4.6x | 13.0x | 8.7% |
APP | $168.3B | 42.7x | 31.3x | 27.3x | 20.6x | 30.9x | 23.3x | 35.0x | 2.6% |
Valuation & fundamentals
Consensus projections
| Ticker | FY2026E | FY2027E | FY2028E | |
|---|---|---|---|---|
TEAM | Revenue | +24.7% | +13.4% | +15.9% |
| EPS | +55.5% | +10.5% | +18.0% | |
GTLB | Revenue | +25.6% | +17.8% | +15.3% |
| EPS | +40.9% | −8.9% | +25.2% | |
FIG | Revenue | +40.5% | +23.8% | +24.2% |
| EPS | −24.5% | +26.7% | +34.4% | |
ADBE | Revenue | +12.0% | +9.1% | +8.8% |
| EPS | +17.2% | +12.7% | +14.2% | |
ADSK | Revenue | +17.0% | +14.4% | +10.2% |
| EPS | +23.0% | +23.1% | +12.7% | |
PTC | Revenue | +4.9% | +6.2% | +7.5% |
| EPS | +20.1% | +8.5% | +10.5% | |
CDNS | Revenue | +19.7% | +13.6% | +11.7% |
| EPS | +15.3% | +17.0% | +14.3% | |
SNPS | Revenue | +37.4% | +10.9% | +11.9% |
| EPS | +15.3% | +17.2% | +18.6% | |
MSFT | Revenue | +18.0% | +18.2% | +19.6% |
| EPS | +26.7% | +15.4% | +18.5% | |
WDAY | Revenue | +13.4% | +11.8% | +11.0% |
| EPS | +26.5% | +18.5% | +17.3% | |
SNOW | Revenue | +29.4% | +30.9% | +25.7% |
| EPS | +72.3% | +59.4% | +41.1% | |
NOW | Revenue | +22.4% | +18.7% | +18.6% |
| EPS | +17.1% | +23.2% | +21.4% | |
CRM | Revenue | +9.3% | +11.1% | +9.4% |
| EPS | +17.4% | +20.2% | +10.4% | |
PLTR | Revenue | +86.1% | +49.3% | +48.2% |
| EPS | +122.1% | +42.4% | +50.3% | |
SHOP | Revenue | +27.4% | +24.2% | +26.6% |
| EPS | +25.1% | +28.2% | +34.3% | |
DDOG | Revenue | +28.9% | +21.5% | +23.5% |
| EPS | +20.9% | +17.3% | +23.1% | |
INTU | Revenue | +13.9% | +11.3% | +10.8% |
| EPS | +18.5% | +15.0% | +12.6% | |
APP | Revenue | +44.2% | +30.1% | +25.7% |
| EPS | +70.4% | +32.6% | +28.8% |
Forward fiscal years only. Blank means no analyst coverage for that year.
On 6 August Atlassian, whose Jira and Confluence products track work and store documentation for corporate teams and are billed per user, told investors that seats in those two products are expanding again. That reverses the disclosure it made in May — its first-ever decline in enterprise seat counts, the cleanest evidence anyone had produced that artificial-intelligence coding agents shrink the headcount software vendors bill. Management went further, arguing that AI adoption increases the need for planning and coordination, and is pulling Jira into human-resources, finance, legal and marketing departments.
The quarter backed it. Revenue rose 28% to $1.8bn, cloud revenue accelerated to +31%, remaining performance obligations — contracted revenue not yet recognised — rose 44% to $4.8bn, and free cash flow grew 32% to $475m. Fiscal 2026 revenue of $6.57bn was up 26%, an acceleration from 19.7%, and full-year operating income turned positive at $10.4m after a $130m loss. Adjusted earnings of $1.87 a share beat the $1.50 consensus, and the stock rose 35% after hours.
The half the tape hasn't priced
The same release guided fiscal 2027 subscription recurring revenue growth down to 18% from 23%, and total revenue growth to roughly 13%, as an end-of-life deadline for its self-hosted Data Center product laps and that revenue declines around 17%. Adjusted operating margin is guided to 25%, from 36% in the June quarter — roughly four points of the fiscal 2026 margin came from Data Center revenue timing.
Against that, the multiple moved further than the numbers. On 29 July Atlassian carried a $25.4bn market value at 4.10x trailing sales; on 7 August it was $39.2bn and 5.96x — a 45% expansion in nine sessions, into a guide for 13% growth and 11 points of margin compression. Forward earnings of $6.08 put it at 24.5x; trailing earnings are not usable on a $53.8m net loss. Business verdict: CONFIRMS. Valuation verdict: CONTRADICTS.
One name, not a group
Atlassian contributed 9.3 of the eight-name group's 19.1-point average 30-day gain. Strip it out and the other seven averaged 11.2% — below the 16.0% mean of a 29-stock broad software basket over the identical window, in which Microsoft rose 30.4%, Workday 30.3% and Snowflake 26.5%. This is a sector rotation the dev-tools names lagged, not a trough they led; Salesforce, ServiceNow and Workday each jumped 7-10% in a single late-July session as money left AI hardware.
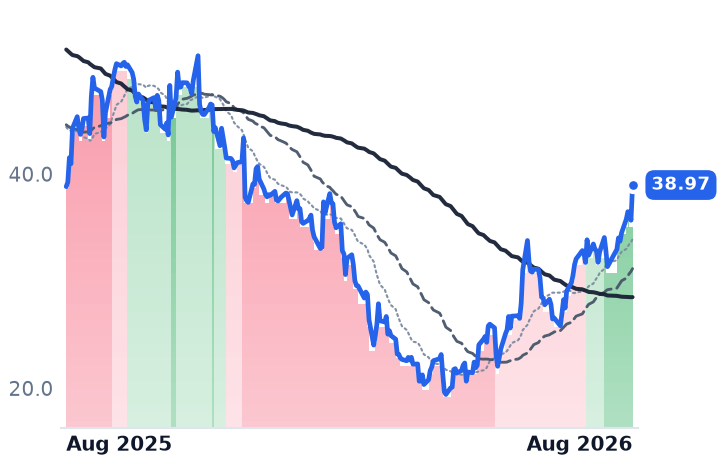
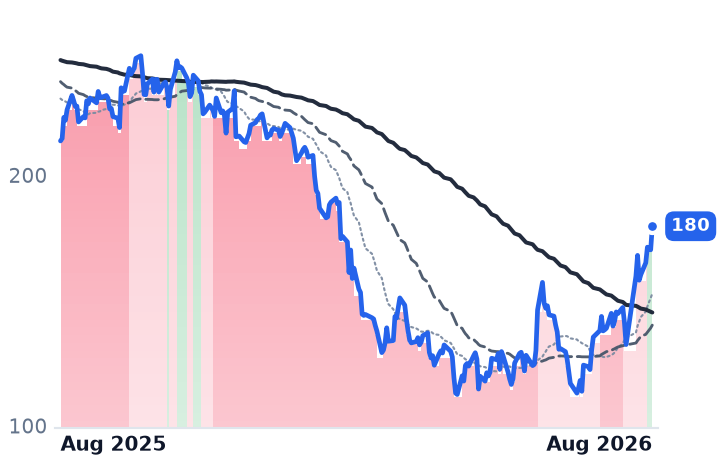
GitLab, which sells a single-application software-development and security platform per developer seat, rose 9.2% on 7 August on triple normal volume with no earnings event — its last report was 2 June. The catalyst is renewed reporting that Datadog is exploring a takeover above $60 a share, unconfirmed by either company. The business is going the other way: revenue growth has slowed from 29.2% to 23.1% across four quarters, gross margin from 87.9% to 85.8%, and consensus expects 17.8% growth this year. At 48x forward earnings and 5.9x forward sales, CONTRADICTS on both counts.
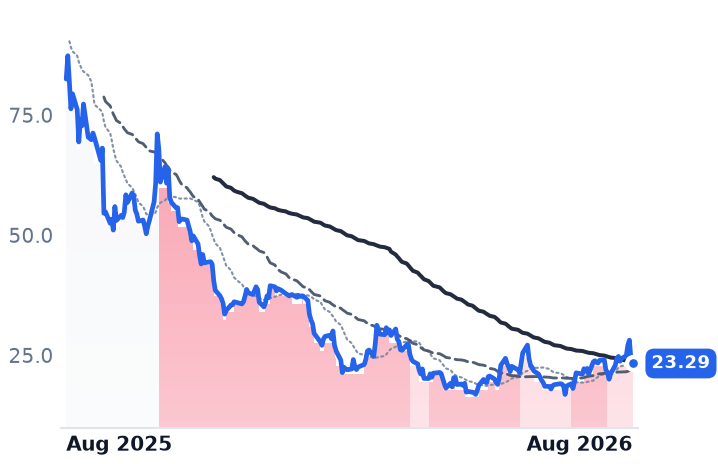
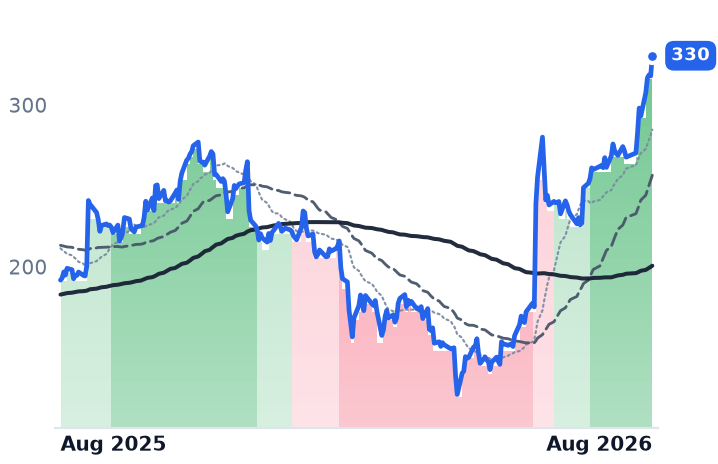
Figma, the browser-based collaborative design tool that listed in July 2025, is the most misread. Revenue growth has accelerated three straight quarters to 48.2%, net dollar retention is 136%, customers above $100,000 of recurring revenue are up 46%, and roughly two-thirds of mid-sized accounts added full seats at renewal — the strongest direct evidence in this group against seat compression. But the shares fell about 16% on the print as AI inference costs swung operating income from +$2.1m to -$117.3m. Figma is down 17% from its 5 August high; the improvement its moving averages registered on 7 August is a lagging artefact, not a repair.
The other five
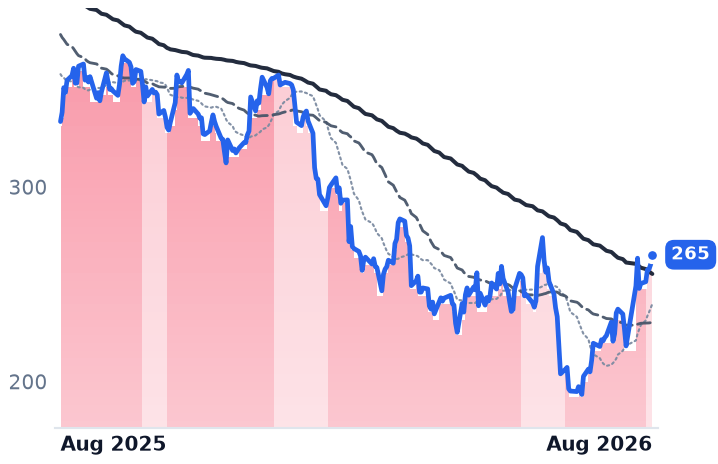
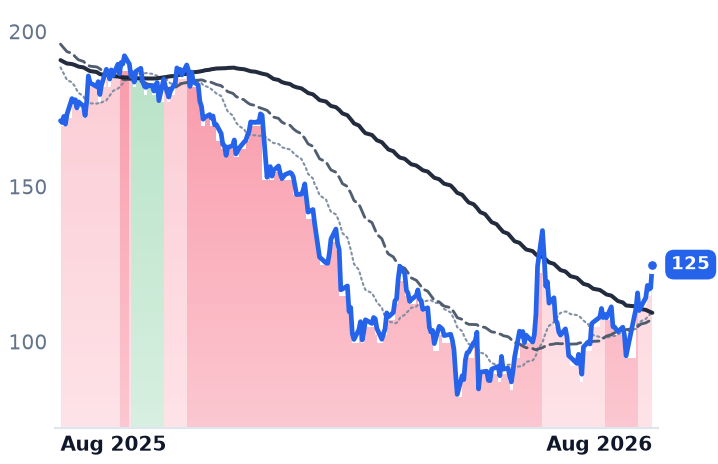
Adobe, which sells Creative Cloud and marketing software on subscription, is the cheapest name here: 10.9x forward earnings against 15.2x trailing, 4.0x forward sales and a 10.1% free-cash-flow yield, with sell-side sentiment at a cautious Hold near 52-week lows. Growth is stable at 12.7%, but operating income grew only 6.1% last quarter — the discount is earned, not free. Autodesk, whose AutoCAD and Revit run architecture and manufacturing design, is the cleanest business: revenue +18.4%, operating margin 20.7%→28.0%, at 19.8x forward against 36.1x trailing. PTC, which sells product-lifecycle software to industrial manufacturers, saw revenue fall 6.8% on a divestiture while recurring revenue grew 9.1% and it bought back $525m of stock in one quarter, citing its own compressed price.
Cadence and Synopsys do not belong in this average at all — they sell chip-design software priced on semiconductor capital spending, not developer headcount. They were the only decliners, subtracting about 1.7 points. Cadence posted 24.2% growth and a record $8.1bn backlog and still fell 9% in a session on China export-control risk baked into guidance; at 67x trailing and 41.7x forward it remains the group's most expensive stock. Synopsys' 41.9% growth is acquisition-driven and margin-destructive — gross margin 80.2%→72.3%, net income down 95% — with design intellectual-property revenue down 8% on China restrictions.
The setup
Where it stands — Atlassian's seat data undercuts the AI-deletes-software thesis, but its multiple expanded 45% into a guide for slower growth and thinner margins. Would confirm — Fiscal 2027 first-quarter cloud revenue growth holding above 28% despite the Data Center decline. Would invalidate — Subscription recurring revenue growth printing below the guided 18%, or adjusted operating margin under 25%. Watch next — Atlassian's next quarterly report, due late October; Adobe's fiscal third quarter in September. Valuation — Atlassian 5.96x trailing sales and 24.5x forward earnings, versus 4.10x sales on 29 July.