

Private-Credit Lenders Jumped 28% on Rate Hopes While Their Earnings Fell
Hypothesis Opus 5 · Research Opus 5 · Writing Opus 5 · Prompt v1.2
American employers unexpectedly cut 23,000 jobs in July and the two prior months were revised down by 103,000, pushing bond yields and rate-hike odds lower. The winners were the publicly traded lending companies that hold private-credit loans on their own books — Main Street Capital, Ares Capital, Golub Capital and Blue Owl — which are up between 15% and 28% in a month. The banks that arrange the debt behind artificial-intelligence data centres went the other way: Goldman Sachs added 1.0% over 30 days, Morgan Stanley fell 0.8%.
The reported numbers do not match the enthusiasm. Ares Capital's core earnings were flat at $0.47 a share with book value down $0.24; Main Street guided next-quarter distributable income to at least $0.97 from $1.08; consensus has Golub's revenue falling 12.1% this fiscal year.
Curiously, the lenders say new-loan terms are getting better, not worse — spreads 20 to 50 basis points wider. Whether that repairs earnings before the bounce runs out is the open question.
| Ticker | Company | Segment | Trend | 30D | 1Y |
|---|---|---|---|---|---|
| The subject · what this brief is about | |||||
ARCC | Ares Capital | Middle Market Credit | 🔴 Cont. Bear | +8.7% | −4.7% |
GBDC | Golub Capital BDC | Other | 🌱 Emerging Bull | +3.5% | −3.7% |
MAIN | Main Street Capital | Middle Market Credit | ⚠️ Emerging Bear | +14.1% | −5.6% |
OWL | Blue Owl Capital | Alternative & Private Capital | 🔴 Cont. Bear | +27.6% | −37.1% |
GS | The Goldman Sachs | Bulge Bracket Investment Banks | 🟢 Cont. Bull | −1.5% | +46.4% |
MS | Morgan Stanley | Bulge Bracket Investment Banks | 🟢 Cont. Bull | −2.6% | +53.7% |
C | Citigroup | Global Investment Banking & Markets | 🟢 Cont. Bull | −3.3% | +47.2% |
JPM | JPMorgan Chase | Global Investment Banking & Markets | 🟢 Cont. Bull | +6.6% | +25.6% |
ARES | Ares Management | Alternative & Private Capital | 🔴 Cont. Bear | +12.5% | −25.4% |
BX | Blackstone | Alternative & Private Capital | 🔴 Cont. Bear | +12.3% | −17.1% |
BAM | Brookfield Asset Management | Real Estate & Infrastructure | 🔴 Cont. Bear | +13.7% | −12.1% |
HASI | HA Sustainable Infrastructure Capital | Financial - Diversified | 🟢 Cont. Bull | +9.0% | +64.3% |
HTGC | Hercules Capital | Middle Market Credit | ⚠️ Emerging Bear | +9.9% | −3.9% |
APO | Apollo Global Management | Alternative & Private Capital | 🔴 Cont. Bear | +6.3% | −9.2% |
BIP | Brookfield Infrastructure Partners | Infrastructure & Transport Conglomerates | 🟢 Cont. Bull | +4.7% | +33.0% |
CG | The Carlyle | Alternative & Private Capital | ⚠️ Emerging Bear | +8.2% | −21.8% |
KKR | KKR | Alternative & Private Capital | 🔴 Cont. Bear | +6.8% | −27.6% |
| Compared against · context, not the story | |||||
BN | Brookfield | Real Estate & Infrastructure | ⚠️ Emerging Bear | +2.3% | +2.6% |
BEP | Brookfield Renewable Partners | Diversified Renewable Generators | 🟢 Cont. Bull | +0.7% | +35.0% |
BEPC | Brookfield Renewable | Diversified Renewable Generators | ⚠️ Emerging Bear | −5.1% | +2.4% |
CRWV | CoreWeave | Cloud GPU Computing | 🔴 Cont. Bear | +1.1% | −30.0% |
OBDC | Blue Owl Capital | Business Development & Specialty Finance | 🔴 Cont. Bear | +8.4% | −9.8% |
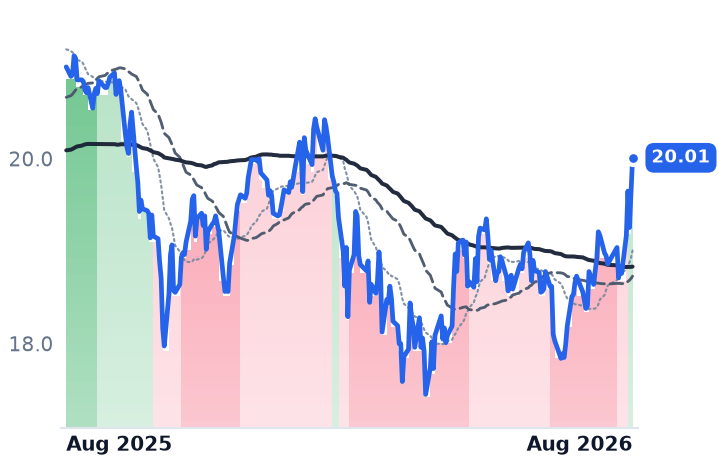
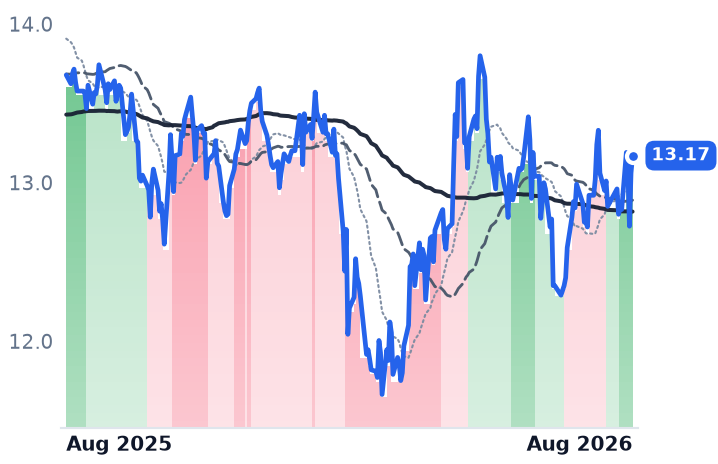
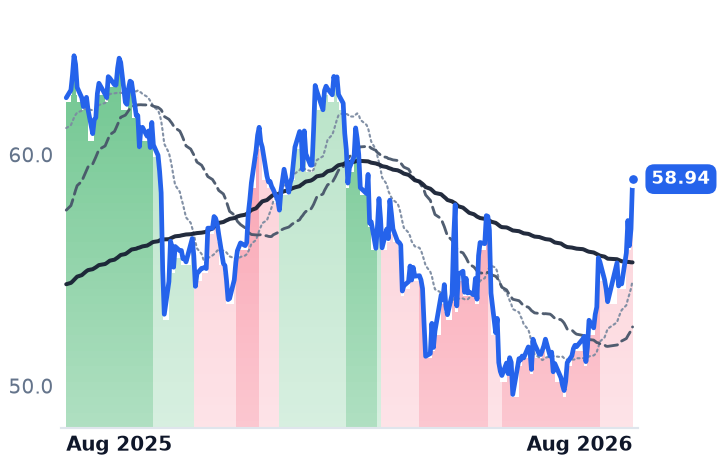
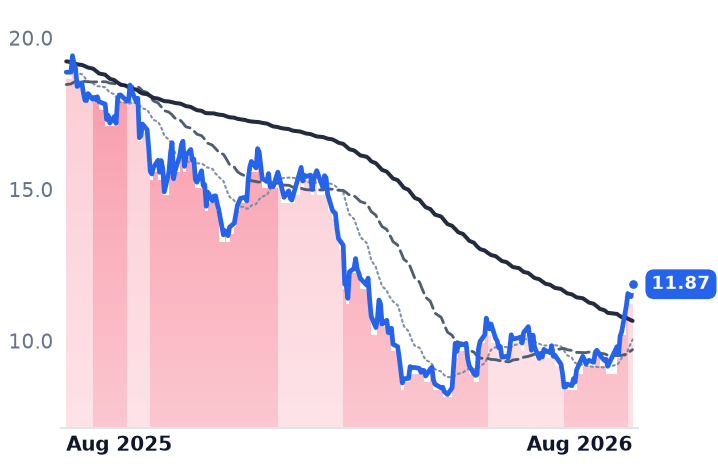
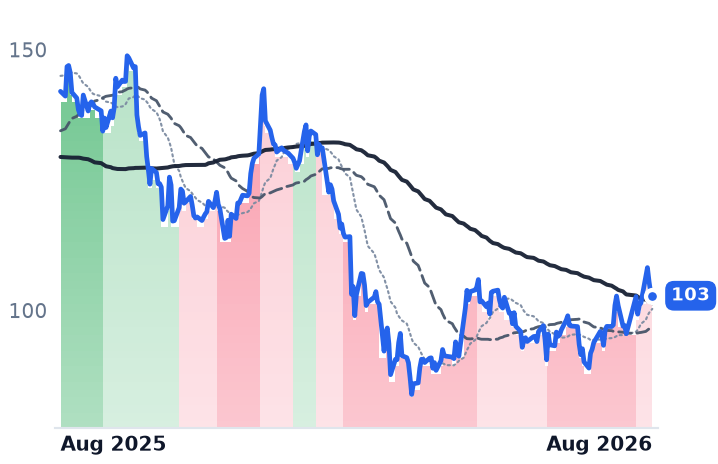
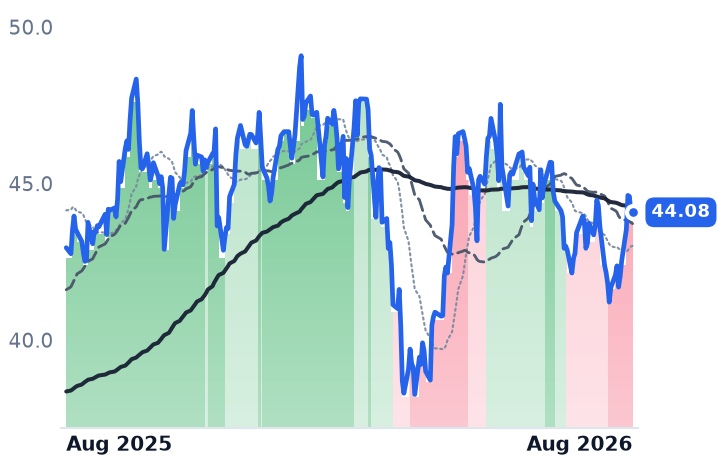
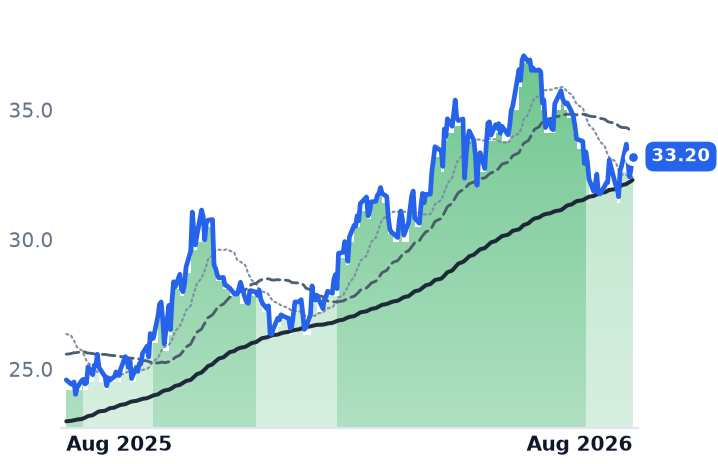
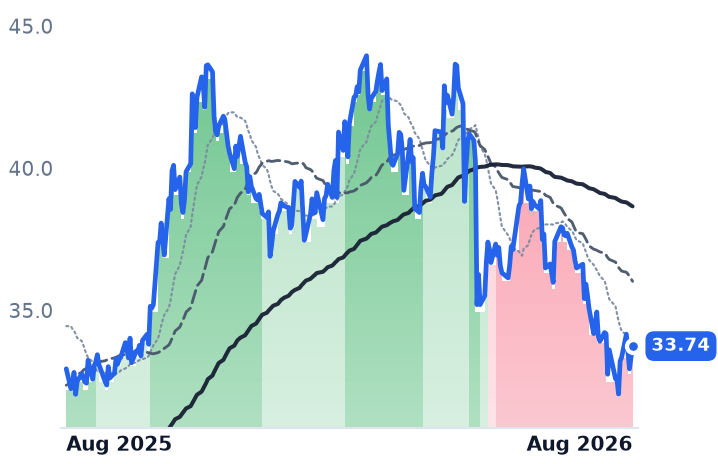
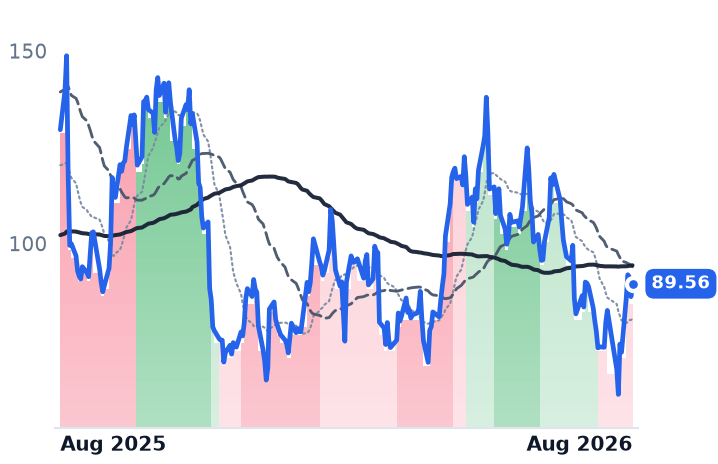
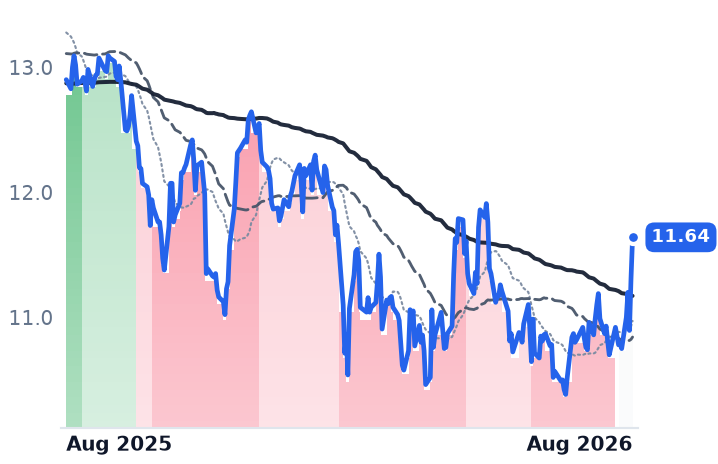
12-month price & trend
| Ticker | Mkt cap | P/E | P/E fwd | P/S | P/S fwd | P/GP | P/GP fwd | EV/EBITDA | FCF yld |
|---|---|---|---|---|---|---|---|---|---|
ARCC | $14.4B | 14.8x | 10.5x | 6.2x | 4.6x | 9.2x | 6.9x | 8.6x | 7.4% |
GBDC | $3.4B | 23.9x | 9.6x | 4.8x | 4.4x | 6.5x | 5.9x | 20.2x | 26.8% |
MAIN | $5.5B | 12.4x | 15.4x | 9.0x | 9.4x | 10.6x | 11.0x | 20.1x | 3.1% |
| Ticker | Mkt cap | P/E | P/E fwd | P/S | P/S fwd | P/GP | P/GP fwd | EV/EBITDA | FCF yld |
|---|---|---|---|---|---|---|---|---|---|
OWL | $18.6B | 99.4x | 13.4x | 6.2x | 6.6x | 10.2x | 10.8x | 23.8x | 7.6% |
GS | $306.7B | 15.8x | 14.9x | 2.6x | 4.3x | 4.5x | 7.5x | 17.8x | -13.5% |
MS | $341.1B | 17.4x | 16.8x | 2.7x | 4.2x | 4.5x | 7.0x | 24.0x | -6.9% |
| Ticker | Mkt cap | P/E | P/E fwd | P/S | P/S fwd | P/GP | P/GP fwd | EV/EBITDA | FCF yld |
|---|---|---|---|---|---|---|---|---|---|
C | $231.5B | 14.3x | 12.1x | 1.5x | 2.4x | 2.7x | 4.4x | 9.5x | -20.6% |
JPM | $958.0B | 15.4x | 14.5x | 3.2x | 4.6x | 5.1x | 7.3x | 20.8x | -13.1% |
ARES | $44.9B | 59.8x | 23.3x | 7.0x | 8.0x | 11.2x | 12.8x | 23.3x | 1.9% |
| Ticker | Mkt cap | P/E | P/E fwd | P/S | P/S fwd | P/GP | P/GP fwd | EV/EBITDA | FCF yld |
|---|---|---|---|---|---|---|---|---|---|
BX | $165.7B | 30.5x | 23.1x | 10.3x | 11.3x | 11.6x | 12.7x | 21.0x | 2.7% |
BAM | $83.8B | 30.2x | 28.5x | 15.4x | 13.8x | 19.2x | 17.2x | 21.0x | 2.8% |
HASI | $5.2B | 61.6x | 13.7x | 0.0x | 11.2x | n/m | 40.5x | 169.7x | 4.6% |
| Ticker | Mkt cap | P/E | P/E fwd | P/S | P/S fwd | P/GP | P/GP fwd | EV/EBITDA | FCF yld |
|---|---|---|---|---|---|---|---|---|---|
HTGC | $3.2B | 8.3x | 8.9x | 5.6x | 5.5x | 6.2x | 6.1x | 12.7x | -4.3% |
APO | $73.4B | 27.6x | 14.5x | 2.2x | 3.2x | 2.5x | 3.6x | 5.3x | 6.5% |
BIP | $18.0B | 54.4x | 36.0x | 0.7x | 1.4x | 2.6x | 5.3x | 6.8x | -3.2% |
| Ticker | Mkt cap | P/E | P/E fwd | P/S | P/S fwd | P/GP | P/GP fwd | EV/EBITDA | FCF yld |
|---|---|---|---|---|---|---|---|---|---|
CG | $17.2B | 47.2x | 13.3x | 4.4x | 4.6x | 6.2x | 6.5x | 35.2x | -5.3% |
KKR | $92.3B | 30.6x | 16.5x | 4.4x | 8.7x | 9.5x | 18.7x | 14.0x | 7.1% |
BN | $98.2B | 83.1x | 16.0x | 1.3x | 12.9x | 3.7x | 36.6x | 10.4x | -7.4% |
| Ticker | Mkt cap | P/E | P/E fwd | P/S | P/S fwd | P/GP | P/GP fwd | EV/EBITDA | FCF yld |
|---|---|---|---|---|---|---|---|---|---|
BEP | $10.5B | 54.3x | — | 1.7x | 1.5x | 7.0x | 6.1x | 9.6x | -48.1% |
BEPC | $5.3B | n/m | — | 1.3x | 0.8x | 2.7x | 1.7x | 44.9x | -13.9% |
CRWV | $46.6B | n/m | — | 7.5x | 3.7x | 10.8x | 5.3x | 25.7x | -22.8% |
| Ticker | Mkt cap | P/E | P/E fwd | P/S | P/S fwd | P/GP | P/GP fwd | EV/EBITDA | FCF yld |
|---|---|---|---|---|---|---|---|---|---|
OBDC | $5.6B | 15.5x | 8.5x | 4.2x | 3.5x | 6.6x | 5.5x | 21.5x | 19.4% |
Valuation & fundamentals
Consensus projections
| Ticker | FY2026E | FY2027E | FY2028E | |
|---|---|---|---|---|
ARCC | Revenue | +1.4% | +3.1% | −1.4% |
| EPS | −4.5% | +1.4% | −3.9% | |
GBDC | Revenue | −12.1% | −3.7% | −0.3% |
| EPS | −11.8% | −6.9% | −5.2% | |
MAIN | Revenue | +3.4% | +7.4% | +9.8% |
| EPS | −4.9% | +3.3% | +4.4% | |
OWL | Revenue | +5.9% | +10.5% | +16.1% |
| EPS | +7.9% | +11.4% | +14.5% | |
GS | Revenue | +20.6% | +2.7% | +1.8% |
| EPS | +42.8% | +4.7% | +5.3% | |
MS | Revenue | +16.6% | +5.5% | +5.6% |
| EPS | +30.4% | +5.9% | +8.1% | |
C | Revenue | +10.9% | +3.7% | +3.6% |
| EPS | +47.4% | +14.3% | +15.3% | |
JPM | Revenue | +12.9% | +2.5% | +4.5% |
| EPS | +22.0% | +1.4% | +8.3% | |
ARES | Revenue | +22.9% | +19.5% | +9.3% |
| EPS | +17.7% | +23.8% | +17.7% | |
BX | Revenue | +15.0% | +24.4% | +4.9% |
| EPS | +10.7% | +25.2% | +10.8% | |
BAM | Revenue | +12.2% | +16.1% | +12.9% |
| EPS | +12.9% | +17.8% | +16.8% | |
HASI | Revenue | +18.8% | +11.2% | +14.0% |
| EPS | +10.5% | +10.9% | +8.9% | |
HTGC | Revenue | +8.5% | +7.1% | +9.9% |
| EPS | +0.2% | +0.9% | −1.4% | |
APO | Revenue | +27.3% | +16.0% | +13.9% |
| EPS | +10.8% | +21.4% | +16.1% | |
BIP | Revenue | +61.2% | −25.6% | +8.1% |
| EPS | +2.1% | +38.8% | −2.9% | |
CG | Revenue | −1.7% | +36.3% | +9.0% |
| EPS | −10.1% | +41.6% | +15.4% | |
KKR | Revenue | +33.9% | +17.8% | +32.9% |
| EPS | +26.0% | +18.0% | +15.7% | |
BN | Revenue | −6.8% | +21.4% | +21.7% |
| EPS | +13.2% | +23.7% | +15.4% | |
BEP | Revenue | +8.3% | +11.0% | +0.9% |
| EPS | +22.8% | −18.4% | −12.6% | |
BEPC | Revenue | +13.3% | +16.7% | +7.6% |
| EPS | −27.1% | −1.1% | −72.0% | |
CRWV | Revenue | +147.1% | +98.0% | +60.2% |
| EPS | +194.1% | −65.7% | −325.8% | |
OBDC | Revenue | −12.9% | −0.6% | −3.1% |
| EPS | −14.6% | +0.4% | −4.4% |
Forward fiscal years only. Blank means no analyst coverage for that year.
American employers cut 23,000 jobs in July and revisions erased another 103,000 from May and June, a report that sent stocks higher on 7 August as traders scaled back bets on a rate rise. The ten-year Treasury yield fell seven basis points to 4.6% and odds of a September Federal Reserve hike dropped to 42% from 58%. Inside the group of seventeen financial firms that fund the artificial-intelligence (AI) data-centre buildout, that single macro print flipped the leadership board.
Over the two sessions to 7 August, the yield-paying lenders rose — Hannon Armstrong, which finances clean-energy and efficiency projects, +6.5%; Main Street Capital +5.1%; Ares Capital +3.9%; Golub Capital +3.5% — while every bank fell: Goldman Sachs -3.1%, Citigroup -2.4%, Morgan Stanley -1.5%, JPMorgan -0.9%. That is a rates trade, not a data-centre trade.
The half that got paid, and the half that got marked down
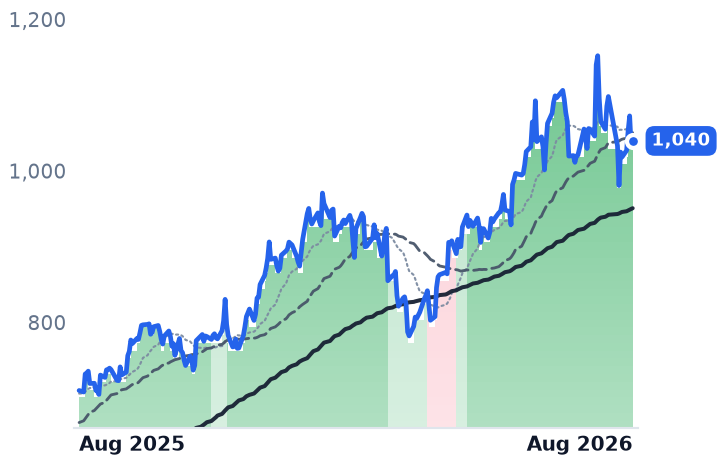
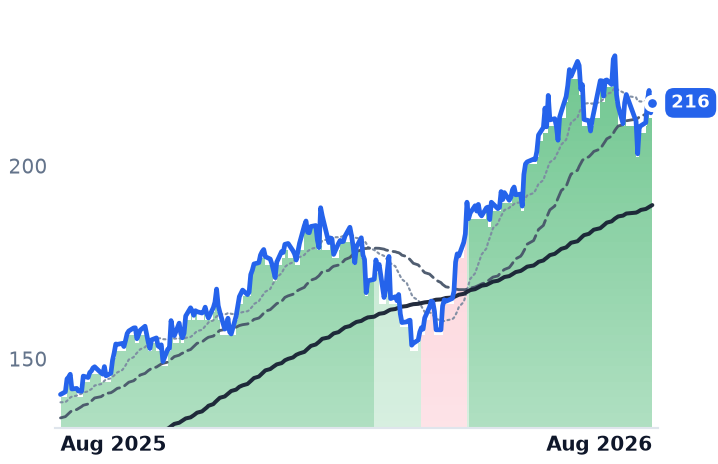
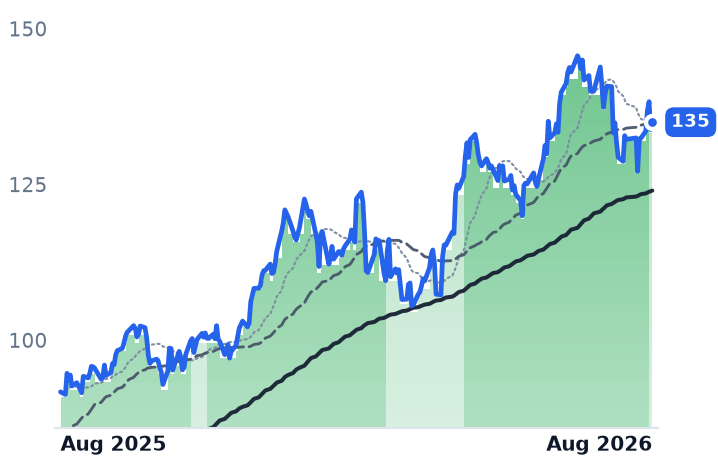
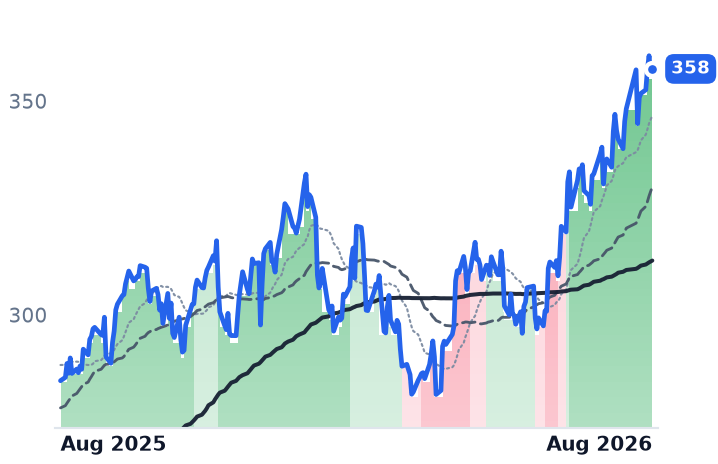
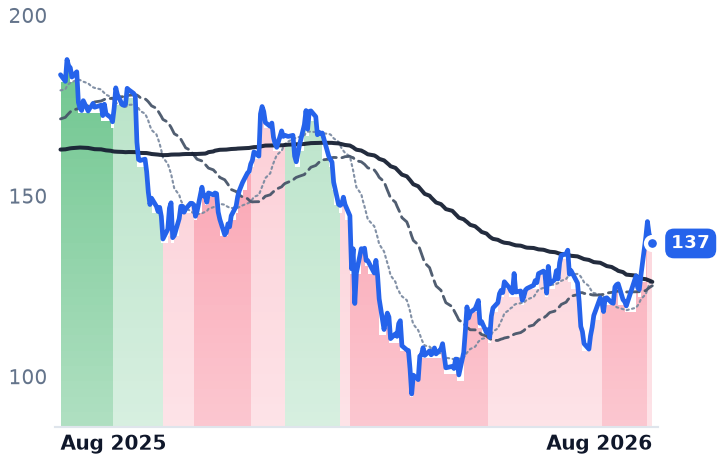
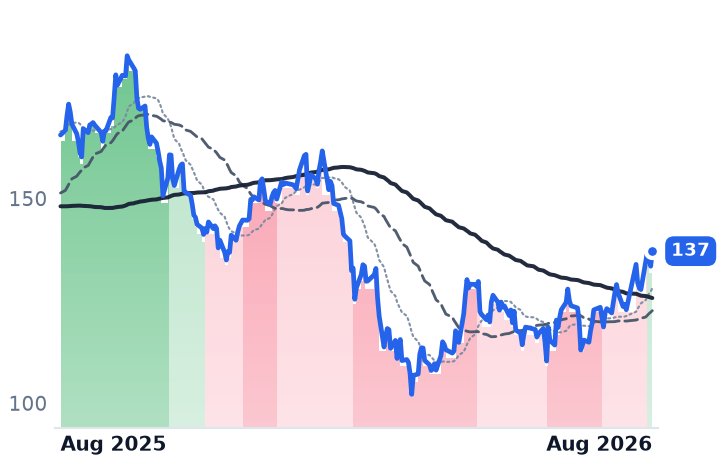
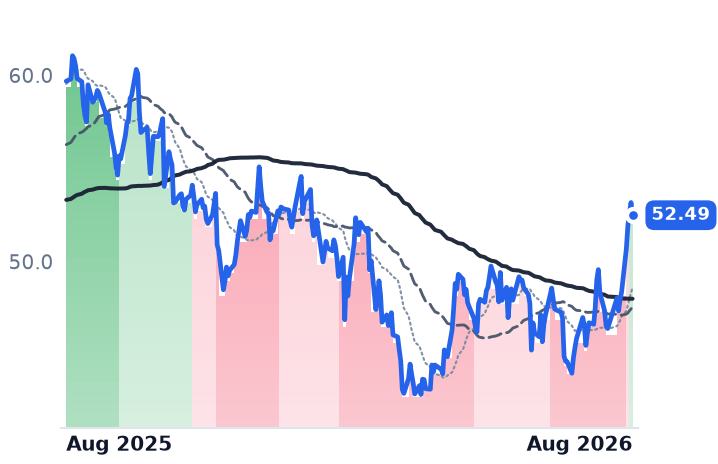
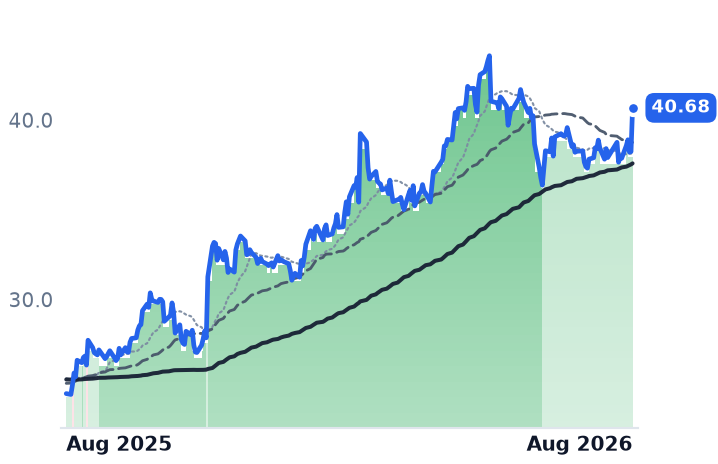
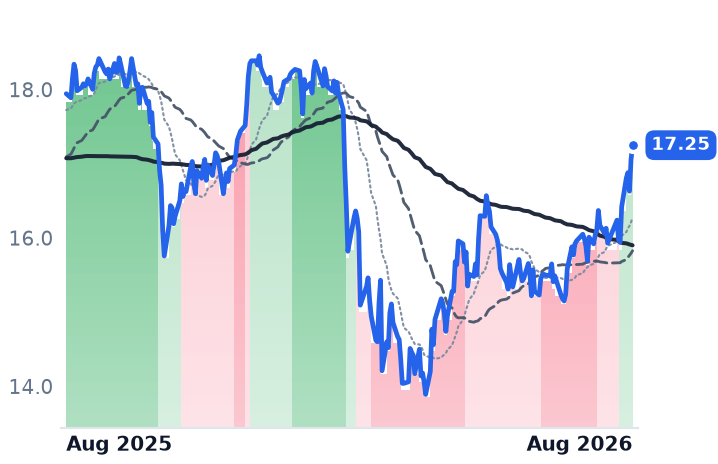
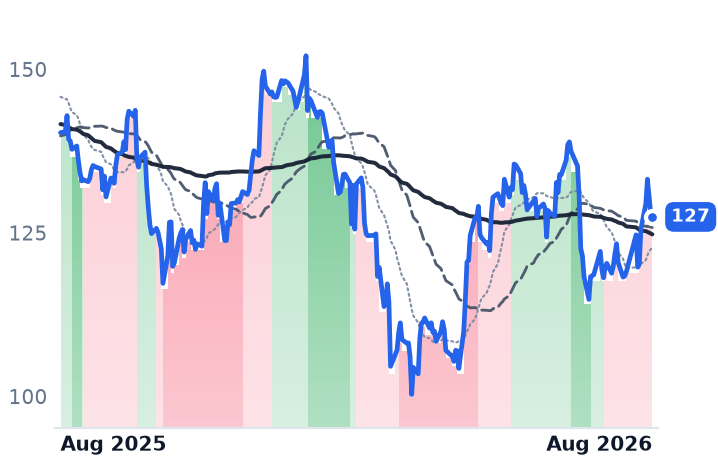
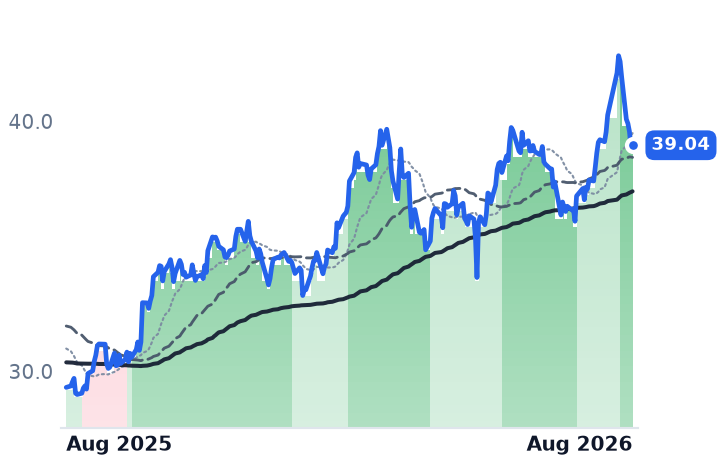
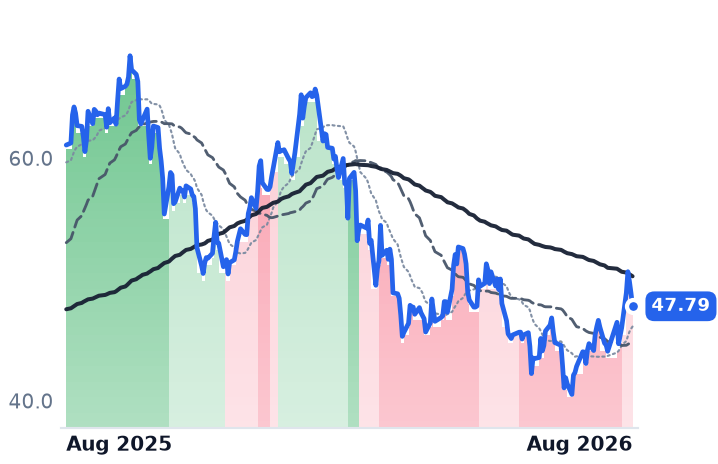
Over twelve months the split was clean. The banks and capital-markets names rose — Hannon Armstrong +66.9%, Morgan Stanley +53.5%, Citigroup +48.0%, Goldman +44.4%, Brookfield Infrastructure +29.0%, JPMorgan +24.6% — while every alternative asset manager and every lender that holds loans on balance sheet fell: Blue Owl -37.3%, KKR -27.7%, Ares Management -26.8%, Blackstone -18.2%, Ares Capital, Golub and Hercules each about -11%.
The past month inverted it. Blue Owl +28.5%, Ares Management +16.0%, Blackstone +15.6%, Main Street +15.5%, Brookfield Asset Management +15.4%, against Goldman +1.0%, Morgan Stanley -0.8% and Citigroup -1.7%. This is the marked-down credit half bouncing off the roughly $265bn drawdown the private-credit complex suffered earlier this year, not the financing story broadening.
What the loan books actually reported
Business development companies are listed lenders to mid-sized private businesses — the layer that literally holds the paper. Ares Capital, a $14.4bn lender writing $10m-$400m loans to companies with up to $250m of operating profit, reported core earnings of $0.47 a share, flat, with net asset value down $0.24 to $19.35 and non-accruing loans at 1.4% of fair value, below its own ten-year 3% average. Golub Capital BDC, a $3.4bn lender making first-lien loans to private-equity-owned businesses, covered its $0.33 distribution with $0.34 of adjusted net investment income and bought back 1.1m shares at about a 10% discount to book — though it also moved five borrowers to non-accrual, including cloud file-management firm Panzura. Main Street Capital, which supplies both debt and equity to smaller companies, posted record book value of $33.92 and a 18.9% return on equity but guided third-quarter distributable income to at least $0.97 from $1.08, citing weaker one-off income and costlier refinancing.
On business momentum the verdict for this half is CONTRADICTS: earnings are flat to down while the shares run. The counterpoint is pricing power. Ares Capital says new senior loan spreads are 20 basis points wider than late 2025 with upfront fees 50 basis points higher; Golub reports 25-50 basis points wider in what it called a shift "from borrower-friendly to lender-friendly." The AI credit strain visible elsewhere — CoreWeave's five-year default-swap spread blew past 855 basis points in late July, forcing 100-125 basis points of extra spread and maintenance covenants on a $2.6bn facility — reaches these books as better terms, not losses. Direct exposure is small and disclosed: under 50 basis points of Ares Capital's portfolio in higher-risk software, under 3% of Golub's software book flagged by an outside re-underwrite.
Valuation: three different situations
Golub is the only member below book at 0.93x, on 9.6x forward earnings against 23.9x trailing — but consensus has revenue down 12.1% this year and 3.7% next. Ares Capital sits at 1.03x book and 10.5x forward, with consensus earnings down 4.5% to $1.91 this year. Main Street trades at 1.71x book with a forward multiple (15.4x) above its trailing (12.4x) — consensus models earnings falling 4.9%. Blue Owl, the alternative manager whose direct-lending and sale-leaseback funds saw $4.7bn of redemption requests in the second quarter, trades at 4.09x book and 99x trailing earnings with revenue growth decelerating to 7.1% from 21.2%. Verdict on valuation: INCONCLUSIVE — the discounts are real but so are the falling estimates, and the sector-wide roughly 20% average discount to net asset value reflects redemption pressure separate from loan performance.
The banks are the opposite case, and there the verdict is CONFIRMS. Goldman grew June-quarter revenue 22.9% with operating income up 132%, and trades at 14.9x forward against 15.8x trailing — last year's advance was earnings, not repricing. Management flagged its supplementary leverage ratio at 4.3%, lowest among peers, as the constraint on carrying more financing, with client demand outstripping its willingness to deploy. Morgan Stanley has overtaken Goldman as the top arranger of AI debt in 2026, on more than $40bn of deals and $2.3bn of fees, and data-centre securitisation outstanding has grown from $4bn in 2020 to $61bn so far this year. The funding channel is open.
On the tape, Goldman has held its uptrend on 112 sessions this year and Morgan Stanley on 106, while Main Street, Ares Capital and Hercules all sat in outright downtrends for four to eight weeks through midsummer — the base this month's bounce comes off.
The setup
Where it stands — Lenders holding private-credit loans bounced 15-28% in a month on rate expectations while their reported earnings were flat to lower. Would confirm — Ares Capital core earnings rising above $0.47 and Main Street's third-quarter distributable income printing above the $0.97 guided floor. Would invalidate — Non-accruals rising above the 3% ten-year average at Ares Capital, or Golub's book value falling again next quarter. Watch next — Third-quarter results from all four lenders in late October and early November 2026. Valuation — Golub 0.93x book and 9.6x forward vs 23.9x trailing; Main Street 1.71x book, forward 15.4x above trailing 12.4x.