

Gas Producers Held Flat as Prices Fell 17%—Only Range's Business Earned the Calm
Hypothesis Opus 5 · Research Opus 5 · Writing Opus 5 · Prompt v1.2
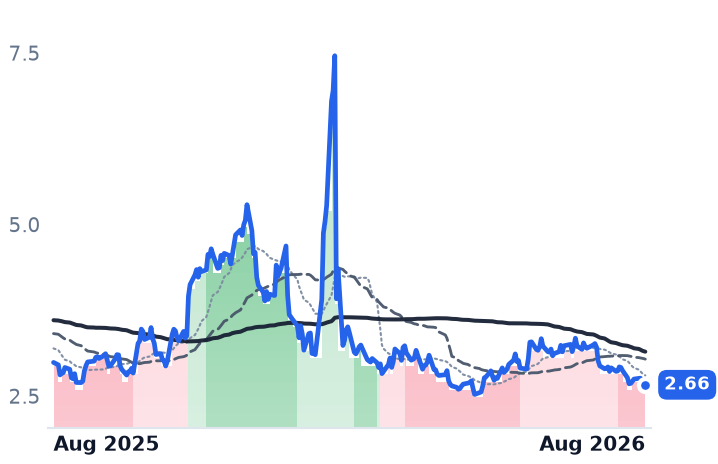
The US benchmark natural gas price fell about 17% over the past month to $2.66 per million British thermal units, dragged down by record output near 111 billion cubic feet a day, storage roughly 6.5% above the five-year average and a July dip in export-terminal demand. Four gas producers the desk tracks barely moved — which is the only genuinely bullish fact in the file.
Underneath, the businesses split. Range Resources, an Appalachian driller, grew second-quarter revenue 19% with operating margin widening to 39.1% from 26.8%, and trades at 9.3x forward earnings against 10.5x trailing. The other three shrank: Expand Energy's revenue fell 20%, Comstock's 25% with earnings of three cents a share and a negative 18.7% free-cash-flow yield, and Tourmaline deliberately produced below its own guidance.
The structural shortage thesis behind these names is dated to 2028. The forward curve says $3.41 next year.
| Ticker | Company | Segment | Trend | 30D | 1Y |
|---|---|---|---|---|---|
| The subject · what this brief is about | |||||
EXE | Expand Energy | Appalachian Shale Gas | 🔴 Cont. Bear | +4.3% | −3.3% |
RRC | Range Resources | Appalachian Shale Gas | ⚠️ Emerging Bear | +4.2% | +11.5% |
CRK | Comstock Resources | Diversified Onshore & Conventional | 🔴 Cont. Bear | −2.0% | −15.9% |
TOU.TO | Tourmaline Oil | Oil & Gas Exploration & Production | ⚠️ Emerging Bear | −3.5% | +5.8% |
| Compared against · context, not the story | |||||
EQT | EQT | Appalachian Shale Gas | ⚠️ Emerging Bear | +3.1% | +1.4% |
AR | Antero Resources | Appalachian Shale Gas | 🔴 Cont. Bear | +0.6% | +5.8% |
CNX | CNX Resources | Appalachian Shale Gas | ⚠️ Emerging Bear | +7.7% | +21.0% |
GPOR | Gulfport Energy | Appalachian Shale Gas | ⚠️ Emerging Bear | +1.5% | −2.3% |
ARX.TO | ARX.TO | — | 🌱 Emerging Bull | +5.1% | +23.3% |
NG=F | NG=F | — | 🔴 Cont. Bear | −11.6% | −11.0% |
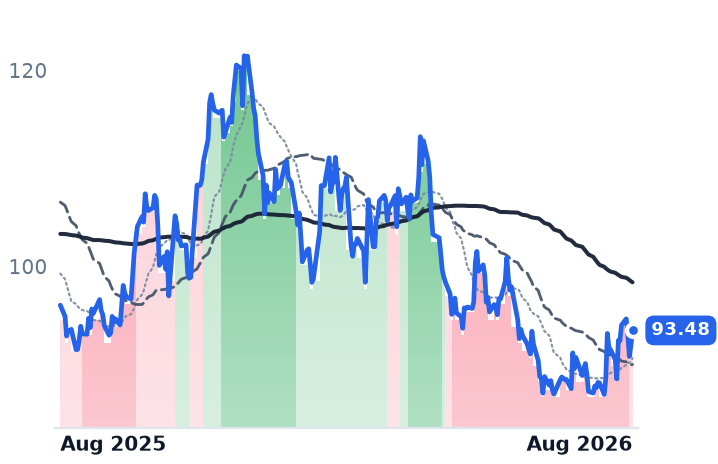
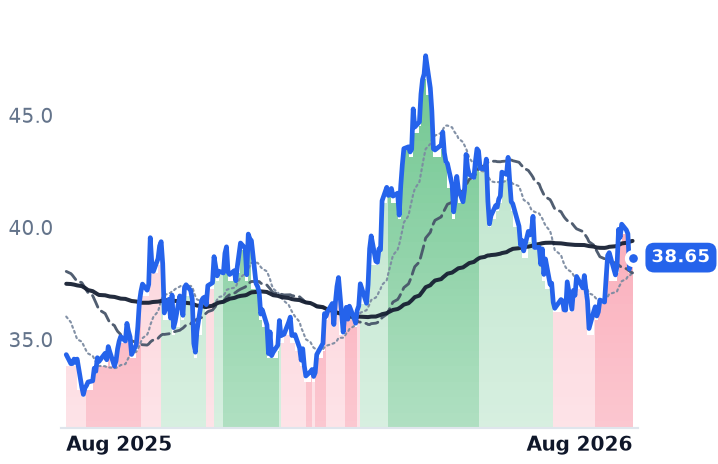
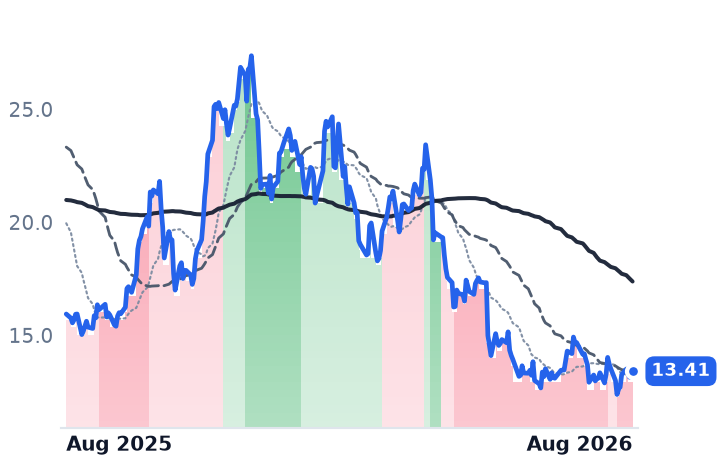
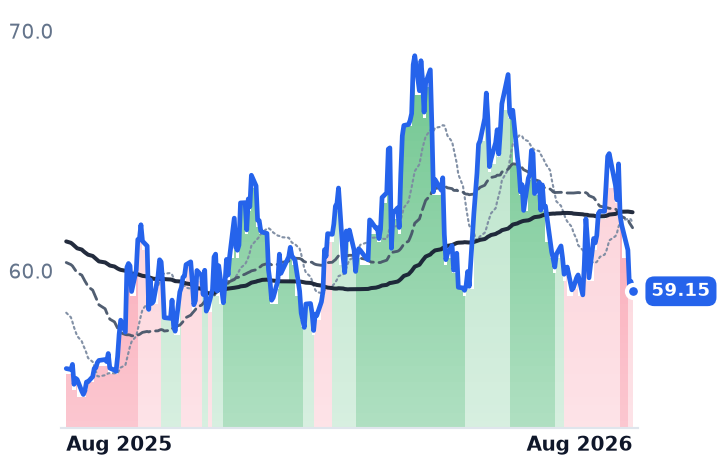
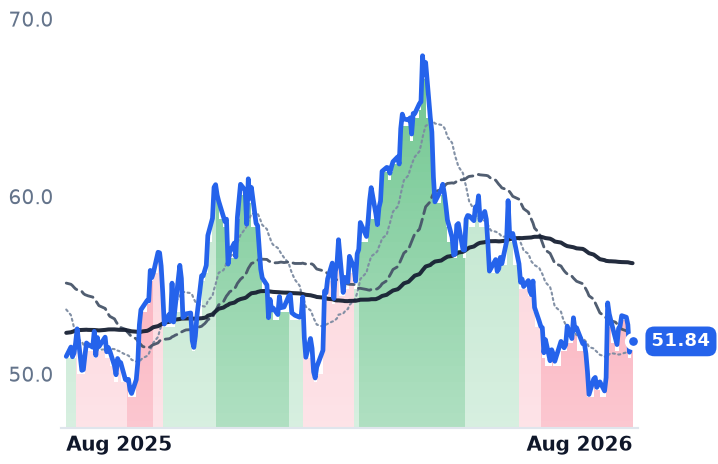
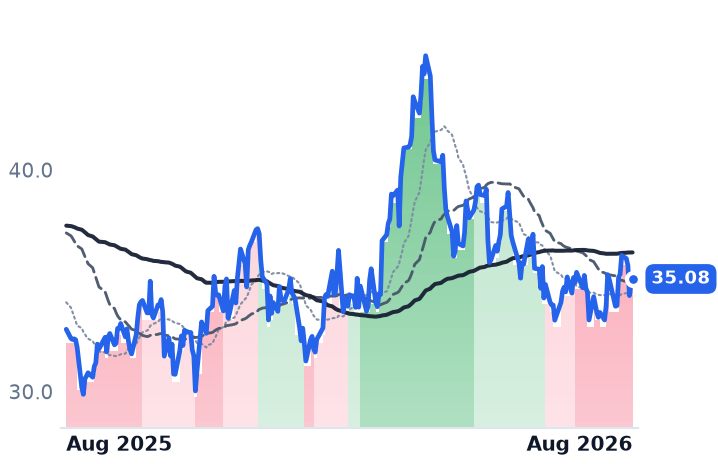
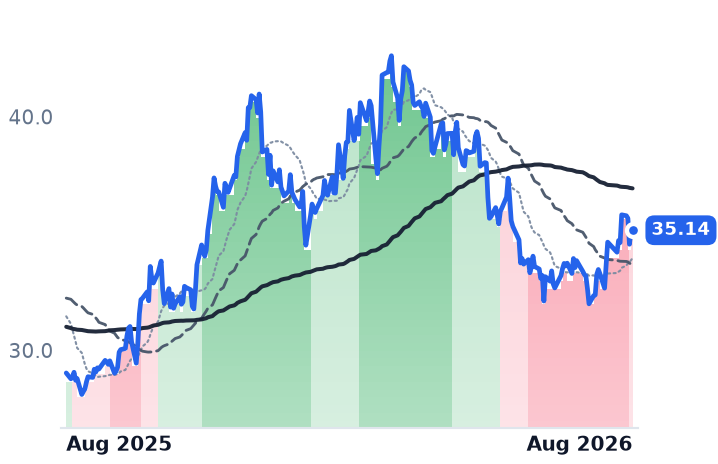
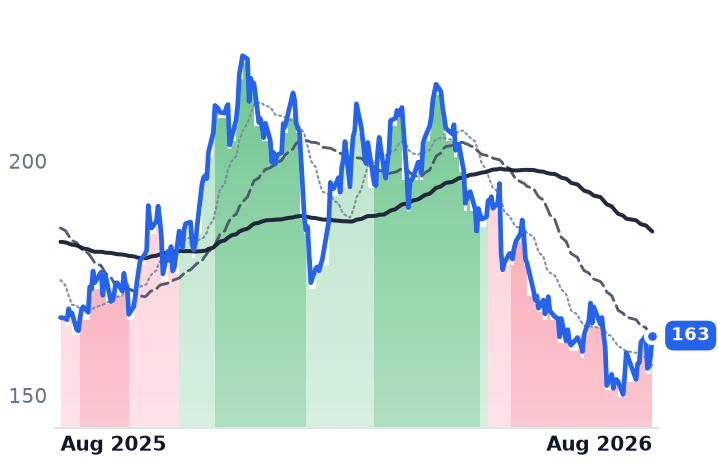
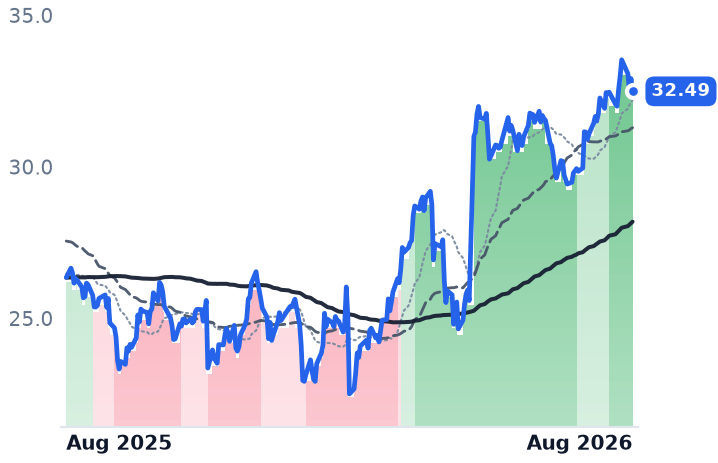
12-month price & trend
| Ticker | Mkt cap | P/E | P/E fwd | P/S | P/S fwd | P/GP | P/GP fwd | EV/EBITDA | FCF yld |
|---|---|---|---|---|---|---|---|---|---|
EXE | $21.5B | 7.9x | 10.1x | 1.6x | 1.6x | 2.5x | 2.5x | 3.7x | 11.8% |
RRC | $8.9B | 10.5x | 9.3x | 2.7x | 2.5x | 5.6x | 5.2x | 7.0x | 13.1% |
CRK | $3.9B | 7.6x | 32.0x | 2.1x | 2.0x | 3.1x | 3.0x | 5.2x | -18.7% |
| Ticker | Mkt cap | P/E | P/E fwd | P/S | P/S fwd | P/GP | P/GP fwd | EV/EBITDA | FCF yld |
|---|---|---|---|---|---|---|---|---|---|
TOU.TO | $23.0B | 61.0x | 13.1x | 4.0x | 3.4x | 76.5x | 65.0x | 6.7x | 0.9% |
EQT | $32.0B | 11.3x | 12.1x | 3.5x | 3.4x | 5.1x | 5.0x | 6.1x | 11.8% |
AR | $10.6B | 9.8x | 8.2x | 1.8x | 1.6x | 4.0x | 3.5x | 6.4x | 13.4% |
| Ticker | Mkt cap | P/E | P/E fwd | P/S | P/S fwd | P/GP | P/GP fwd | EV/EBITDA | FCF yld |
|---|---|---|---|---|---|---|---|---|---|
CNX | $5.1B | 5.0x | 11.1x | 2.1x | 2.3x | 4.2x | 4.6x | 4.0x | 10.3% |
GPOR | $2.8B | 6.2x | 6.6x | 1.9x | 1.9x | 3.2x | 3.2x | 4.0x | 8.9% |
ARX.TO | — | — | — | — | — | — | — | — | — |
| Ticker | Mkt cap | P/E | P/E fwd | P/S | P/S fwd | P/GP | P/GP fwd | EV/EBITDA | FCF yld |
|---|---|---|---|---|---|---|---|---|---|
NG=F | — | — | — | — | — | — | — | — | — |
Valuation & fundamentals
Consensus projections
| Ticker | FY2026E | FY2027E | FY2028E | |
|---|---|---|---|---|
EXE | Revenue | +17.6% | −3.0% | +4.6% |
| EPS | +52.6% | −4.4% | +15.1% | |
RRC | Revenue | +17.7% | +2.8% | +7.2% |
| EPS | +41.8% | −3.5% | +16.8% | |
CRK | Revenue | +2.5% | +16.5% | +12.5% |
| EPS | −20.6% | +71.4% | +79.2% | |
TOU.TO | Revenue | +10.2% | +8.9% | −1.3% |
| EPS | +44.6% | +7.4% | +6.3% | |
EQT | Revenue | +12.9% | −0.5% | +9.5% |
| EPS | +43.8% | −5.2% | +31.6% | |
AR | Revenue | +30.3% | +0.3% | +7.0% |
| EPS | +130.9% | +1.8% | +26.1% | |
CNX | Revenue | +6.9% | +0.7% | +5.8% |
| EPS | +42.1% | +37.2% | +18.2% | |
GPOR | Revenue | +8.3% | +4.2% | +5.3% |
| EPS | +10.8% | +18.4% | +28.6% |
Forward fiscal years only. Blank means no analyst coverage for that year.
Natural gas in the United States is cheap again, and for entirely physical reasons. Producers pumped an average 110.6 billion cubic feet a day in July, matching the record set last December and running 4.3% above year-ago levels, with working storage at 3,117 billion cubic feet, 6.7% above the five-year average. Demand did not keep up: flows to export terminals averaged 17.2 Bcf/d in July, down from 17.4 in June on scheduled maintenance at the Freeport plant in Texas, and cooler-than-normal August forecasts cut expected air-conditioning load. The front-month contract closed at $2.66.
The four producers held roughly flat through that. Their peers did much the same — CNX rose 5.9% over the month, EQT 1.0%, Antero Resources 0.1%, Gulfport slightly negative — so this is a sector-wide refusal to follow the commodity down, not something specific to these four names. The interesting question is whether the underlying businesses justify the composure.
One company is growing
Range Resources, an Appalachian driller with about 794,000 net acres in Pennsylvania and only 564 employees, is the outlier. Second-quarter revenue of $834m rose 19.1% year on year while operating income rose 73.9% — operating margin widened to 39.1% from 26.8%. It reported record production of 2.3 billion cubic feet equivalent per day, tracking to 2.5 by year-end and 2.6 by end-2027, with 2027 capital spending held flat at roughly $700m. It returned $489m in the first half through buybacks, dividends and debt repayment, about 5.5% of its market value, and has signed a 10-year, 75 million cubic feet a day supply deal for a Midwest power plant — contracted demand that does not wait on new pipeline capacity. Verdict A: CONTRADICTS. The business accelerated; the stock did not.
On valuation Range is the quality name rather than the cheap one: 9.3x forward against 10.5x trailing earnings, on consensus 2026 earnings of $4.11 a share versus $2.74 actual in 2025, with the cohort's highest trailing enterprise-value-to-EBITDA at 7.0x and a 13.1% free-cash-flow yield. INCONCLUSIVE — growth is priced, discount is not.
Three companies are shrinking
Expand Energy, the $21.5bn producer formed when Chesapeake Energy renamed itself in 2024 and now the largest US gas driller, saw revenue fall 19.7% to $2.96bn and operating income fall 47.9%. Its balance sheet did the opposite: total debt cut to $3.7bn, leverage near 0.5x, $850m of stock repurchased year to date and another $1bn authorised. It trades at 3.7x trailing EV/EBITDA, cheapest here, on an 11.8% free-cash-flow yield — but its forward price/earnings of 10.1x sits above its 7.9x trailing, because consensus expects earnings to fall. It has also had no permanent chief executive since the board replaced Domenic Dell'Osso with chairman Michael Wichterich in February.
Comstock Resources, a $3.9bn Haynesville shale pure-play in Louisiana and East Texas run by 252 people, is the broken one. Revenue fell 24.9% to $353m, operating income 74.8%, and diluted earnings were three cents a share. Realised gas of $2.93 only beat the $2.54 unhedged price because 63% of volume was hedged. Free cash flow is negative 18.7% of market value, leverage 3x, and forward earnings multiple 32.0x against 7.6x trailing — the cheap trailing figure is an artefact. Management said 2027 activity is undecided pending higher prices. The one bright spot is external: Sixth Street paid $600m for 27% of its Pinnacle midstream arm, implying a $2.2bn value. Verdict B: JUSTIFIED DE-RATING.
Tourmaline Oil, Canada's largest gas producer at C$23bn, grew revenue 25.5% but lost 55.8% of operating income as gross margin fell to 28.0% from 44.7%. It produced 594,000 barrels of oil equivalent a day against guidance of 595,000-605,000 — deliberately, injecting gas into storage to sell later — cut 2026 capital spending by C$350m and set 2027 at C$2.3bn. Realised gas was C$3.12; its hedge book at C$4.97 is carrying results. At 13.1x forward earnings and a 0.9% free-cash-flow yield it is the most expensive name here on forward numbers.
The catalyst is not in this quarter
The shortage argument is genuine: Plaquemines feedgas has passed 4.1 Bcf/d, and the combined ramp of Plaquemines, Golden Pass, Corpus Christi Stage 3 and Calcasieu Pass Phase 2 should add roughly 8 Bcf/d over 30 months. But the timetable is long. The Energy Information Administration expects Henry Hub near $3.70 in 2026, and the forward curve is flat at $3.41 for 2026 and $3.51 for 2027 — a level at which Tourmaline says cash flow only just covers maintenance, growth and the dividend. The deficit thesis these four names sit inside is dated to the second half of 2028.
The setup
Where it stands — Four gas producers held flat while the commodity fell 17%; only Range's second quarter improved. Would confirm — Storage surplus narrowing toward Range's projected 38 days of supply by year-end, from 40. Would invalidate — Dry gas production holding above 111 Bcf/d into winter while the 2027 strip stays below $3.60. Watch next — Third-quarter results in late October, and whether Expand names a permanent chief executive. Valuation — Expand 3.7x trailing EV/EBITDA but 10.1x forward earnings vs 7.9x trailing; Comstock 32.0x forward vs 7.6x trailing.