

Pipeline Giants Beat Earnings and Fell Anyway — Rates Did What Gas Couldn't
Hypothesis Opus 5 · Research Opus 5 · Writing Opus 5 · Prompt v1.2
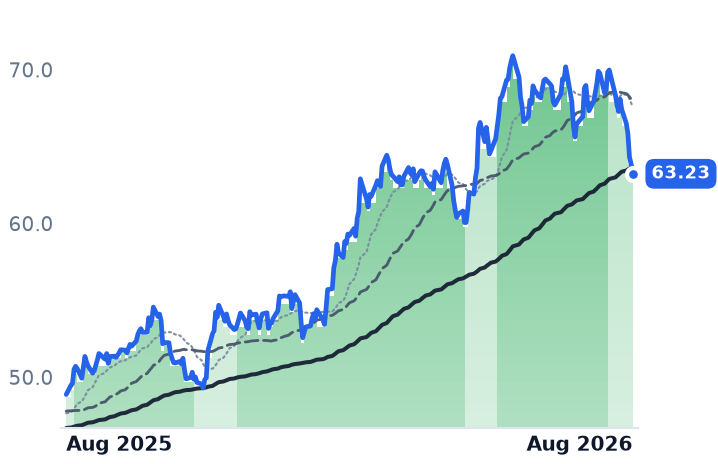
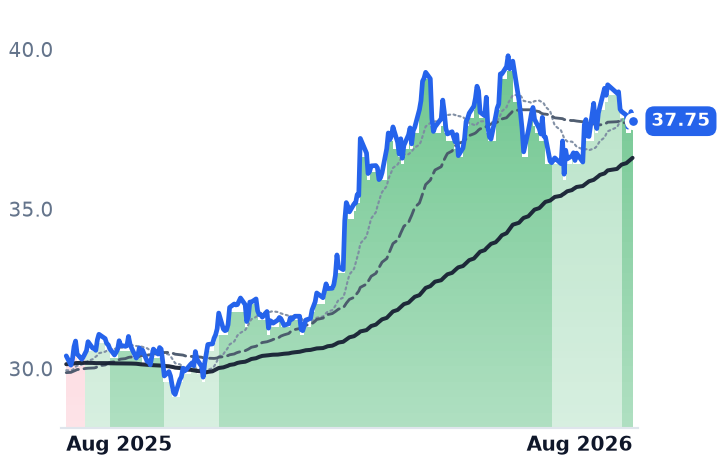
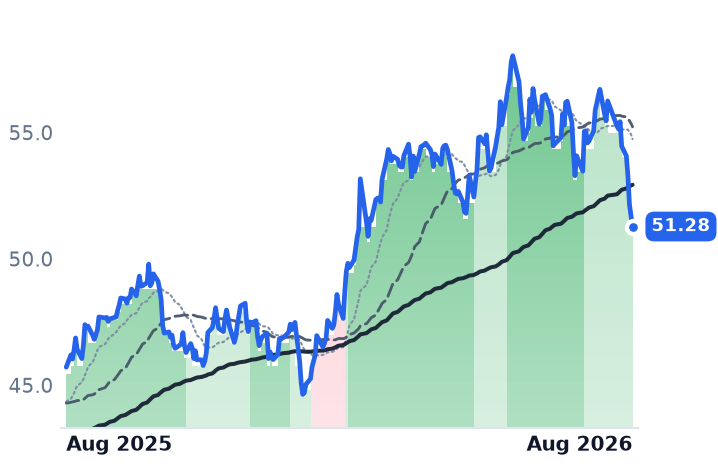
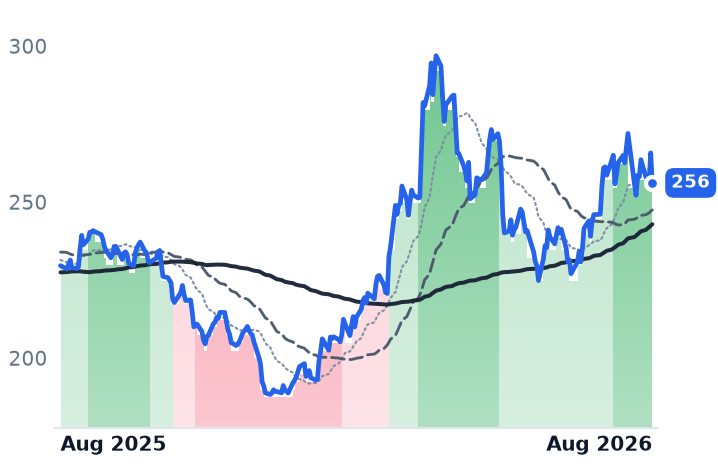
Four of the five biggest North American natural-gas pipeline owners raised or reaffirmed profit guidance in the three weeks to 3 August — Williams lifted full-year earnings before interest, tax, depreciation and amortisation (EBITDA) to $8.3–8.5bn and its five-year growth target to 11%-plus, Kinder Morgan guided at least 5% above budget while cutting net debt to 3.6 times EBITDA — and the shares fell anyway, an average of about 6% in a month.
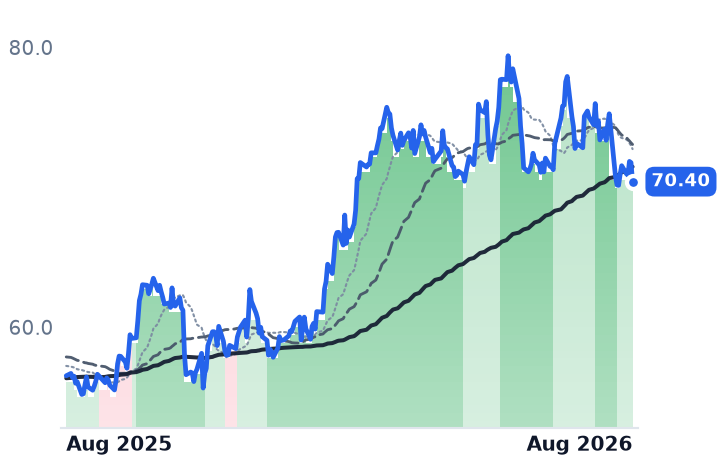
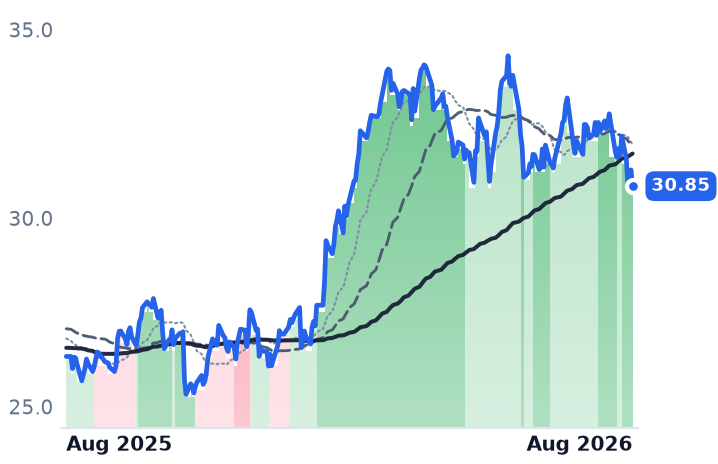
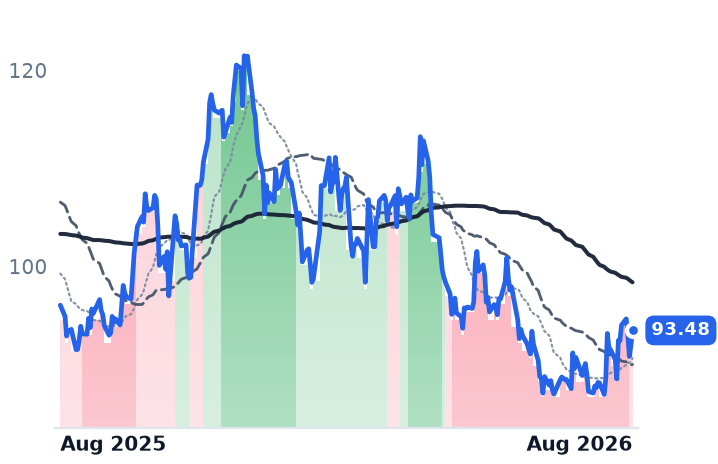
The business explains the twelve-month run, not the give-back. Every one of the five grew revenue and operating profit year over year, and each is cheaper today than when this desk last logged their multiples on 3 May: Williams' trailing price-to-earnings ratio fell from 34x to 28x, Energy Transfer's from 16x to 12.5x. Yields did the damage — the ten-year Treasury touched 4.74% in late July.
The unresolved part: roughly half the year's gain came from multiple expansion, not EBITDA.
| Ticker | Company | Segment | Trend | 30D | 1Y |
|---|---|---|---|---|---|
| The subject · what this brief is about | |||||
WMB | The Williams Companies | Natural Gas Pipelines & Transmission | 🟢 Cont. Bull | −6.7% | +24.5% |
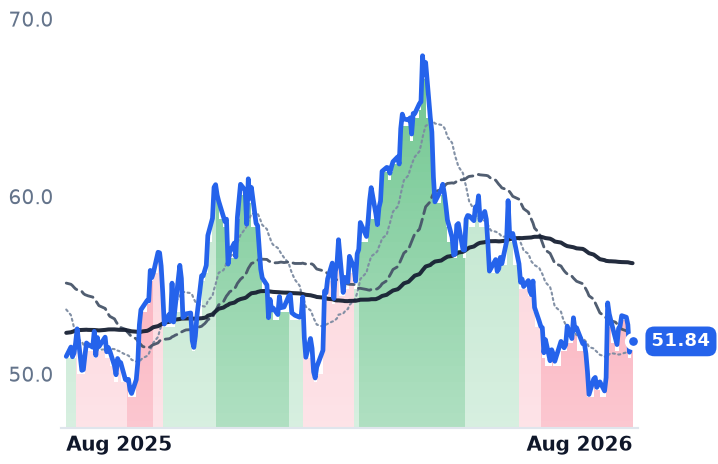
KMI | Kinder Morgan | Natural Gas Pipelines & Transmission | 🟢 Cont. Bull | −4.8% | +17.2% |
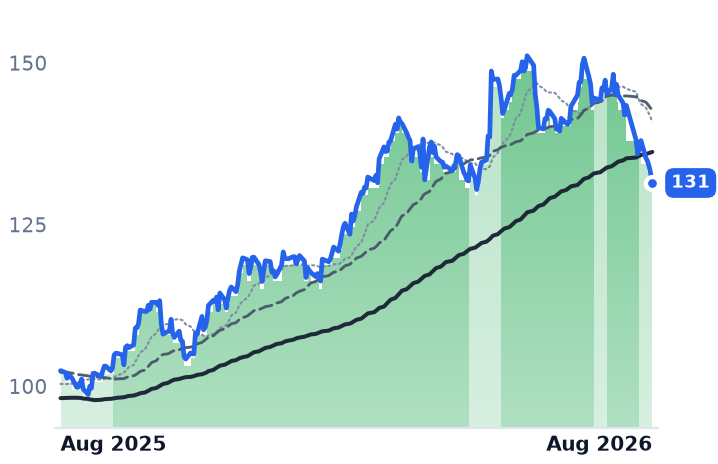
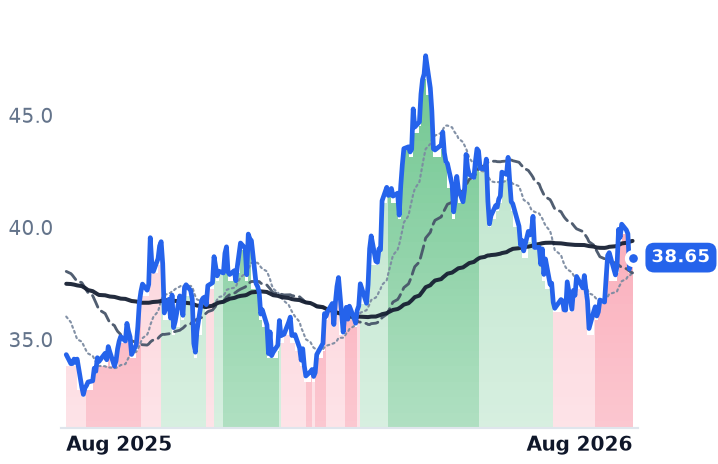
DTM | DT Midstream | Natural Gas Pipelines & Transmission | 🟢 Cont. Bull | −10.8% | +28.3% |
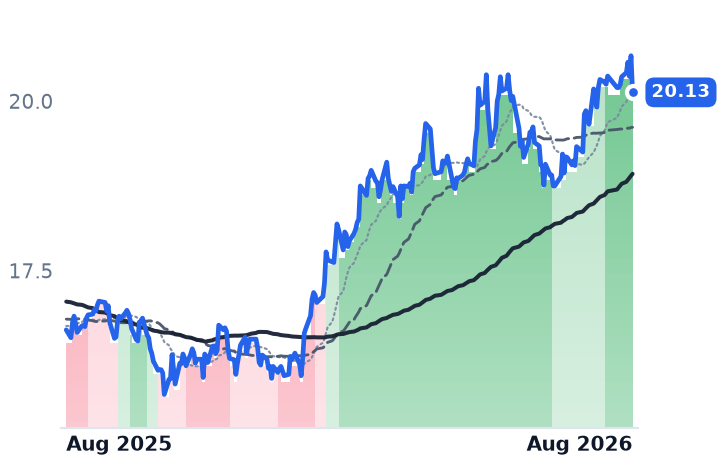
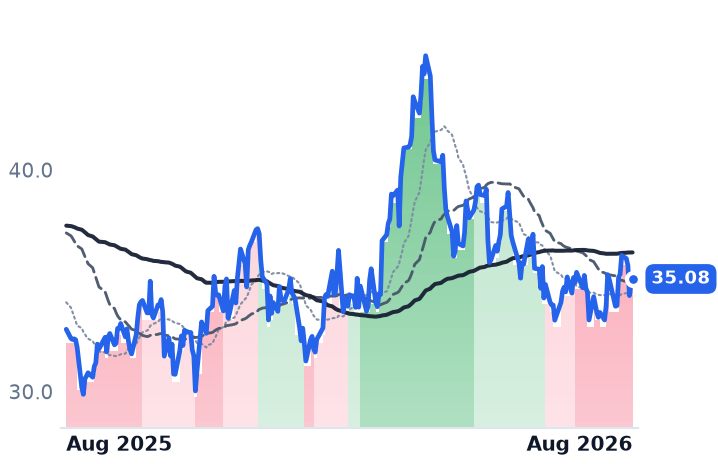
ET | Energy Transfer | Natural Gas Pipelines & Transmission | 🌱 Emerging Bull | +1.7% | +21.1% |
TRP | TC Energy | Natural Gas Pipelines & Transmission | 🟢 Cont. Bull | −7.0% | +29.4% |
| Compared against · context, not the story | |||||
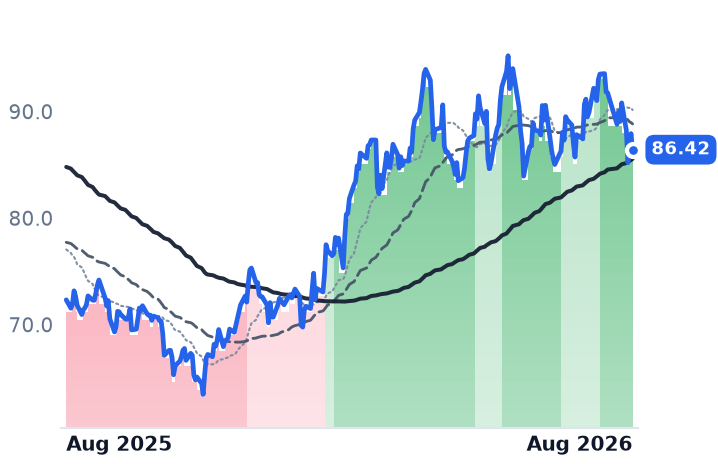
EQT | EQT | Appalachian Shale Gas | ⚠️ Emerging Bear | +3.1% | +1.4% |
AR | Antero Resources | Appalachian Shale Gas | 🔴 Cont. Bear | +0.6% | +5.8% |
RRC | Range Resources | Appalachian Shale Gas | ⚠️ Emerging Bear | +4.2% | +11.5% |
EXE | Expand Energy | Appalachian Shale Gas | 🔴 Cont. Bear | +4.3% | −3.3% |
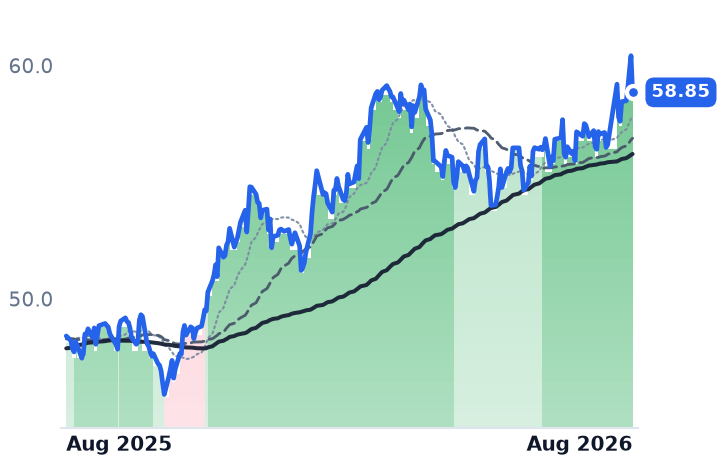
OKE | ONEOK | Natural Gas Gathering & Processing | 🌱 Emerging Bull | −3.4% | +19.5% |
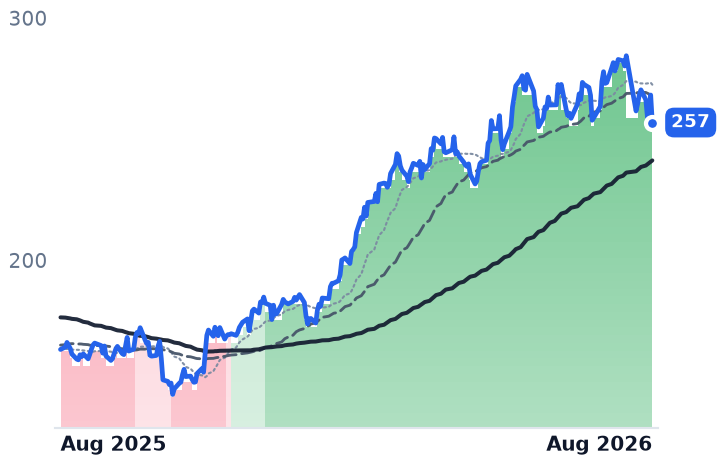
TRGP | Targa Resources | Natural Gas Gathering & Processing | 🟢 Cont. Bull | −5.9% | +57.4% |
MPLX | MPLX | Natural Gas Gathering & Processing | 🟢 Cont. Bull | +2.9% | +21.6% |
EPD | Enterprise Products Partners | Crude Oil & NGL Pipelines | 🟢 Cont. Bull | +1.2% | +24.2% |
ENB | Enbridge | Natural Gas Pipelines & Transmission | 🟢 Cont. Bull | −6.1% | +12.2% |
LNG | Cheniere Energy | LNG Export & Infrastructure | 🌱 Emerging Bull | −2.0% | +11.6% |
12-month price & trend
| Ticker | Mkt cap | P/E | P/E fwd | P/S | P/S fwd | P/GP | P/GP fwd | EV/EBITDA | FCF yld |
|---|---|---|---|---|---|---|---|---|---|
WMB | $86.1B | 27.9x | 29.1x | 7.1x | 7.0x | 9.6x | 9.5x | 15.7x | -0.2% |
KMI | $68.7B | 19.8x | 20.4x | 3.8x | 3.8x | 6.9x | 6.9x | 12.5x | 5.6% |
DTM | $13.4B | 28.6x | 27.3x | 10.2x | 10.0x | 16.1x | 15.8x | 15.2x | 3.6% |
| Ticker | Mkt cap | P/E | P/E fwd | P/S | P/S fwd | P/GP | P/GP fwd | EV/EBITDA | FCF yld |
|---|---|---|---|---|---|---|---|---|---|
ET | $69.3B | 12.5x | 12.9x | 0.7x | 0.6x | 2.9x | 2.5x | 9.5x | 9.7% |
TRP | $65.8B | 26.5x | 16.8x | 5.7x | 4.1x | 11.1x | 8.0x | 13.7x | 4.4% |
EQT | $32.0B | 11.3x | 12.1x | 3.5x | 3.4x | 5.1x | 5.0x | 6.1x | 11.8% |
| Ticker | Mkt cap | P/E | P/E fwd | P/S | P/S fwd | P/GP | P/GP fwd | EV/EBITDA | FCF yld |
|---|---|---|---|---|---|---|---|---|---|
AR | $10.6B | 9.8x | 8.2x | 1.8x | 1.6x | 4.0x | 3.5x | 6.4x | 13.4% |
RRC | $8.9B | 10.5x | 9.3x | 2.7x | 2.5x | 5.6x | 5.2x | 7.0x | 13.1% |
EXE | $21.5B | 7.9x | 10.1x | 1.6x | 1.6x | 2.5x | 2.5x | 3.7x | 11.8% |
| Ticker | Mkt cap | P/E | P/E fwd | P/S | P/S fwd | P/GP | P/GP fwd | EV/EBITDA | FCF yld |
|---|---|---|---|---|---|---|---|---|---|
OKE | $54.5B | 14.9x | 15.1x | 1.4x | 1.3x | 6.4x | 6.0x | 11.0x | 5.3% |
TRGP | $55.1B | 24.4x | 23.6x | 3.3x | 2.8x | 9.0x | 7.7x | 15.5x | 1.1% |
MPLX | $59.7B | 12.6x | 13.6x | 4.6x | 4.7x | 8.8x | 9.0x | 11.5x | 7.4% |
| Ticker | Mkt cap | P/E | P/E fwd | P/S | P/S fwd | P/GP | P/GP fwd | EV/EBITDA | FCF yld |
|---|---|---|---|---|---|---|---|---|---|
EPD | $81.7B | 13.1x | 13.0x | 1.4x | 1.4x | 10.6x | 10.6x | 7.9x | 1.8% |
ENB | $112.0B | 23.8x | 17.4x | 1.6x | 1.5x | 5.7x | 5.3x | 12.6x | 1.5% |
LNG | $54.1B | 42.0x | — | 2.6x | 2.4x | 7.2x | 6.6x | 12.0x | 8.4% |
Valuation & fundamentals
Consensus projections
| Ticker | FY2026E | FY2027E | FY2028E | |
|---|---|---|---|---|
WMB | Revenue | +7.4% | +9.9% | +12.7% |
| EPS | +14.1% | +4.5% | +18.3% | |
KMI | Revenue | +8.2% | +1.9% | +5.8% |
| EPS | +18.1% | +0.8% | +8.6% | |
DTM | Revenue | +7.4% | +5.4% | +10.1% |
| EPS | +9.7% | +5.9% | +12.0% | |
ET | Revenue | +35.3% | +1.9% | +4.9% |
| EPS | +16.7% | +3.6% | +7.4% | |
TRP | Revenue | +6.7% | +4.4% | +5.3% |
| EPS | +7.3% | +5.4% | +6.2% | |
EQT | Revenue | +12.9% | −0.5% | +9.5% |
| EPS | +43.8% | −5.2% | +31.6% | |
AR | Revenue | +30.3% | +0.3% | +7.0% |
| EPS | +130.9% | +1.8% | +26.1% | |
RRC | Revenue | +17.7% | +2.8% | +7.2% |
| EPS | +41.8% | −3.5% | +16.8% | |
EXE | Revenue | +17.6% | −3.0% | +4.6% |
| EPS | +52.6% | −4.4% | +15.1% | |
OKE | Revenue | +25.2% | −5.2% | +2.7% |
| EPS | +6.0% | +9.1% | +10.8% | |
TRGP | Revenue | +16.8% | +16.2% | +10.1% |
| EPS | +27.5% | +14.5% | +17.8% | |
MPLX | Revenue | −1.0% | +6.7% | +5.0% |
| EPS | −6.7% | +11.9% | +6.5% | |
EPD | Revenue | +12.8% | +5.4% | +5.7% |
| EPS | +11.6% | +9.6% | +8.3% | |
ENB | Revenue | +21.8% | −7.4% | +3.6% |
| EPS | +0.5% | +11.8% | +10.3% | |
LNG | Revenue | +11.3% | +6.7% | +3.2% |
| EPS | −141.4% | −349.0% | −9.4% |
Forward fiscal years only. Blank means no analyst coverage for that year.
Between 22 July and 3 August, the companies that own the pipes carrying natural gas across North America reported second-quarter results, and almost all of them told shareholders the year was running ahead of plan. Williams Companies, which owns Transco — the largest US gas pipeline by volume — raised full-year adjusted EBITDA guidance to $8.3–8.5bn and lifted its 2025–30 annual growth target to 11%-plus from 10%-plus, having guided 9% in May. Kinder Morgan, which moves roughly 40% of all US gas across some 83,000 miles of pipeline, guided full-year EBITDA at least 5% above budget, about $430m of extra cash profit, and raised its dividend 2%. TC Energy, the Calgary group with 93,300 km of gas pipe and about 4,300 megawatts of power generation, reported comparable EBITDA up 12% to C$2.95bn and earnings of C$0.94 a share against C$0.83 expected. DT Midstream, a $13.4bn pure-play with 588 employees whose LEAP pipeline gathers gas in the Haynesville shale of Louisiana, reaffirmed 2026 EBITDA of $1.155–1.225bn.
The shares went the other way. Every one of the five grew revenue and operating income year over year — revenue up 10.2% at Williams, 10.8% at Kinder Morgan, 6.7% at TC Energy, 11.0% at DT Midstream, and 78.4% at Energy Transfer, the partnership whose marketing arm inflates the top line but whose operating income still rose 47%.
The contracts are mostly signed, with dates on them
The re-rating of this group over the past year rests on gas-fired power for data centres, so the quality of the contracts matters. Most are executed and capacity-specified. Williams closed a $5.34bn investment from Blackstone Credit & Insurance, with Apollo and KKR vehicles, for 49% of five named behind-the-meter power projects, keeping control; the first, Socrates, delivers 200MW to a Meta campus in Ohio, and the largest, Neo at 682MW, is due in the second half of 2028. Energy Transfer's Oasis pipeline committed up to 450,000 million British thermal units a day of firm gas — about 1.2 gigawatts of power — for at least ten years to a Texas data-centre campus. DT Midstream's LEAP Phase 5 adds 200 million cubic feet a day for 2028 under long-term contracts with two producers. Kinder Morgan's sanctioned backlog stands at $9.6bn, down only because $650m of projects entered service, with federal certificates expected on a $3.5bn Southeast expansion and a $1.7bn Mississippi line.
Two softer edges: Kinder Morgan's Project 219 South rests on a non-binding open season, and TC Energy's flagship Crossroads expansion has precedent agreements but no final investment decision until the fourth quarter — the least-executed marquee project in the group, run against the highest leverage target, 4.75 times EBITDA.
Cheaper than in May, on higher earnings
Against this desk's own recorded multiples from 3 May, all four corporates have de-rated while earning more. Williams' trailing price-to-earnings ratio went from 34.1x to 27.9x, Kinder Morgan's from 21.3x to 19.8x, Energy Transfer's from 16.0x to 12.5x, DT Midstream's from 32.5x to 28.6x. Energy Transfer is cheapest on every lens — 9.5x enterprise value to EBITDA, a 9.7% free-cash-flow yield — and the only one that rose over the month. DT Midstream is dearest at 15.2x and fell hardest, with net income up just 4.7% and margins slipping. TC Energy compresses from 26.5x trailing to 16.8x forward, the widest gap here. Fundamentals CONFIRM the year; valuation is INCONCLUSIVE on the month — nothing in the multiples explains why guidance raises met selling.
Rates, not gas
The tape points elsewhere. Most of Williams' and Kinder Morgan's monthly loss landed in a single session, 27 July, and long-dated Treasury yields set fresh 2026 highs that week after a hawkish Federal Reserve hold drew three dissents for a hike, the ten-year printing about 4.74%, its highest since January 2025, before easing to 4.65% on 7 August. Long-duration, yield-paying infrastructure trades against that line. All five remain in uptrends, with Energy Transfer and Kinder Morgan strongest and DT Midstream downgraded a notch on 30 July.
The feared contagion from upstream has not arrived. Henry Hub futures fell nearly 15% in July and Appalachian producers EQT, Antero, Range and Expand sit in deep downtrends — yet Kinder Morgan's gathering volumes rose 26%, with its Haynesville system up 54% and transport up 7%. Fee-based contracts do not care much about the commodity price.
The one number that cuts against the group: guided 2026 EBITDA growth of roughly 6–12% sits well below twelve-month share gains of 15–28%. Multiple expansion did about half the work.
The setup
Where it stands — Guidance rose across four of five names in late July; the shares fell on rates, not disclosure. Would confirm — Third-quarter volumes and reaffirmed or raised full-year EBITDA at Williams and Kinder Morgan. Would invalidate — A guidance cut, or gathering volumes turning negative year over year as Appalachian output falls. Watch next — TC Energy's Crossroads final investment decision, expected in the fourth quarter of 2026. Valuation — Williams 27.9x trailing and 29.1x forward earnings, against 34.1x trailing on 3 May.