

Corning's Optical Business Grew 32% and the Stock Still Fell 51%
Hypothesis Opus 5 · Research Opus 5 · Writing Opus 5 · Prompt v1.2
A report that Washington is drafting a ban on imports of Chinese optical transceivers — the plug-in modules that turn electrical signals into light inside data centres — sent American optics suppliers sharply higher in the first week of August, six sessions after the group's worst selloff of the year.
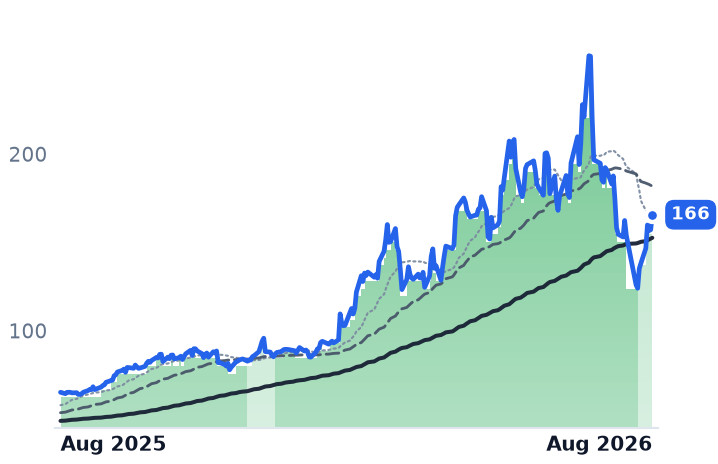
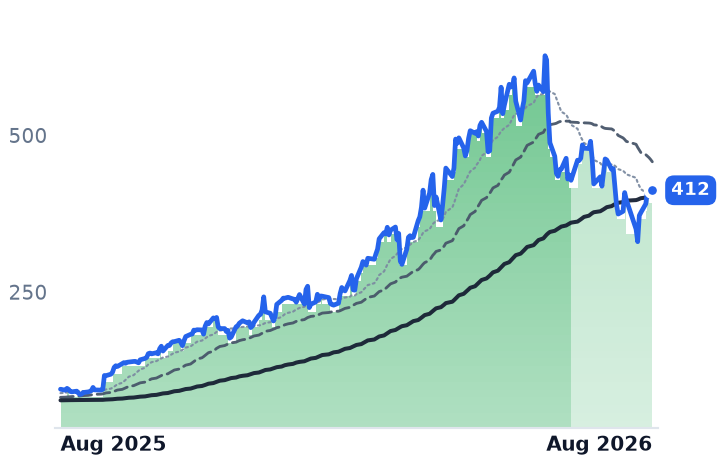
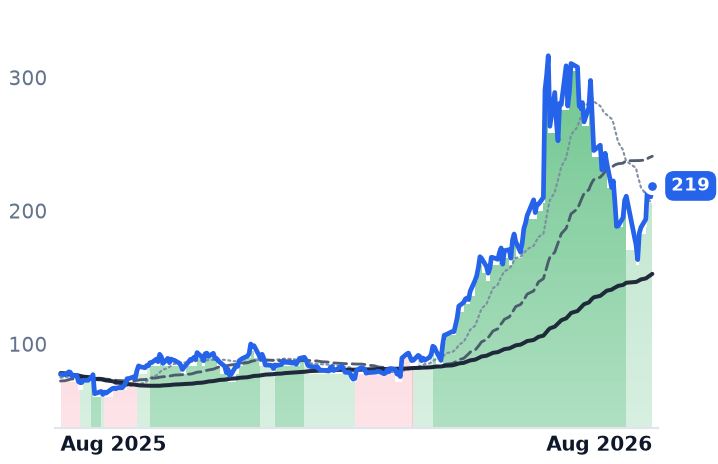
Corning, the largest US maker of optical fibre and connectors, is the test case, and its business is not the problem. June-quarter optical sales rose 32% to $2.07bn, enterprise and data-centre revenue rose 65%, and management guided the current quarter to 16% sales growth and 28% earnings growth. The shares still fell 51% from their June peak, because that guidance landed at or below a $5bn consensus.
Alongside it sit two unrelated businesses: LightPath, an infrared-lens maker with backlog up 196%, and Universal Display, whose revenue is falling 11% with no data-centre exposure. Corning trades at 50.7x forward earnings.
| Ticker | Company | Segment | Trend | 30D | 1Y |
|---|---|---|---|---|---|
| The subject · what this brief is about | |||||
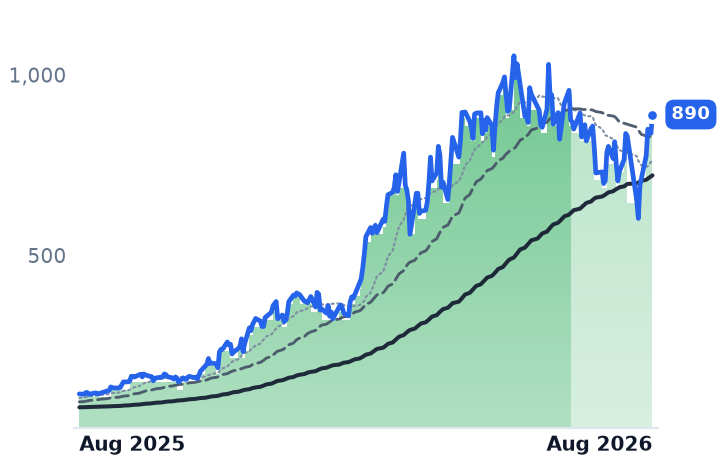
GLW | Corning | Display & Optical Materials | 🟢 Cont. Bull | −13.9% | +154.3% |
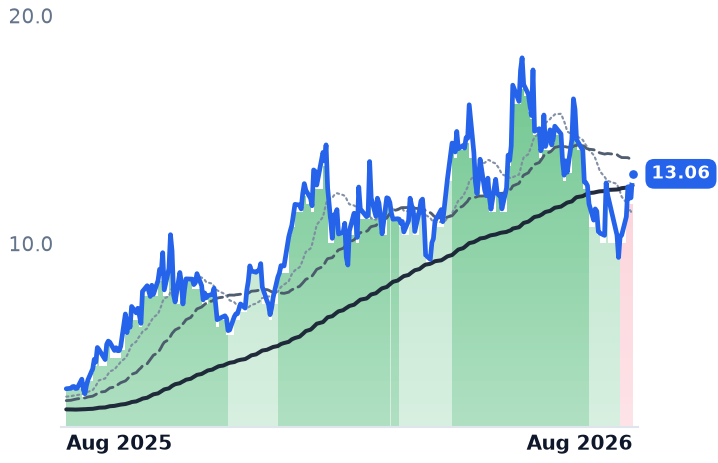
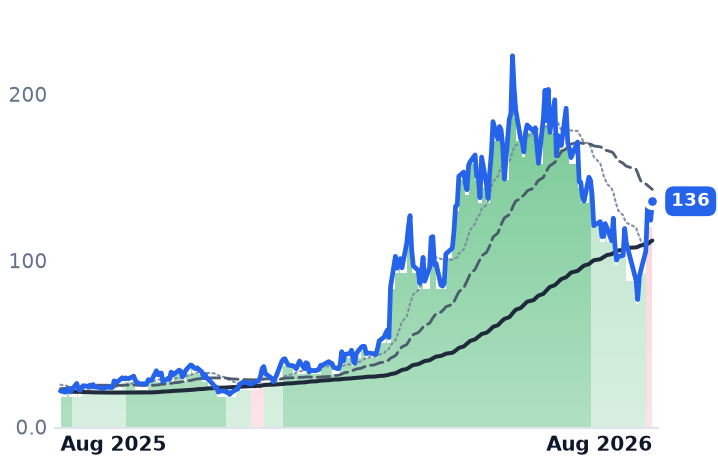
LPTH | LightPath Technologies | Display & Optical Materials | 🟢 Cont. Bull | +4.1% | +259.8% |
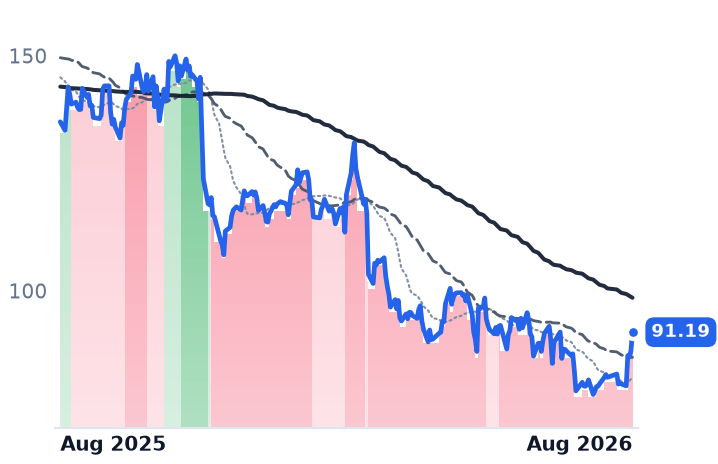
OLED | Universal Display | Display & Optical Materials | 🔴 Cont. Bear | +13.8% | −32.9% |
| Compared against · context, not the story | |||||
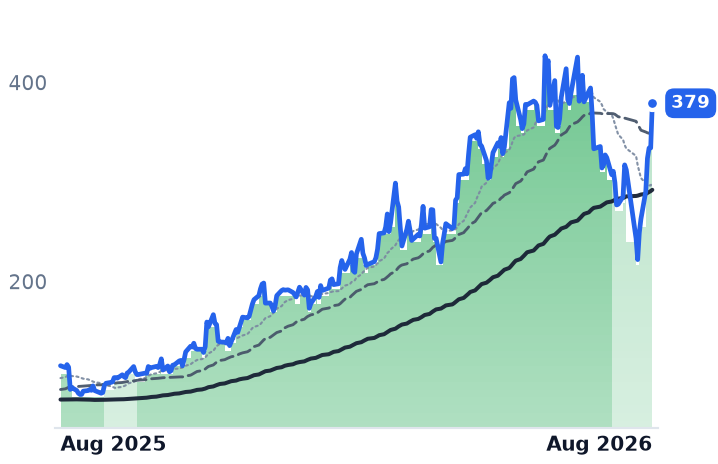
COHR | Coherent | Instrumentation & Test Equipment | 🟢 Cont. Bull | +15.9% | +228.4% |
LITE | Lumentum | Optical Transport & Switching | 🟢 Cont. Bull | +13.3% | +665.6% |
AAOI | Applied Optoelectronics | RF & Wireless | 🟢 Cont. Bull | +11.0% | +528.2% |
FN | Fabrinet | Specialty Manufacturing & Components | ⚠️ Emerging Bear | +16.5% | +63.5% |
CRDO | Credo Technology | Optical Transport & Switching | 🟢 Cont. Bull | −5.9% | +107.5% |
CIEN | Ciena | Optical Transport & Switching | 🟢 Cont. Bull | −10.8% | +333.8% |
APH | Amphenol | Connectors & Interconnect Systems | 🟢 Cont. Bull | +4.3% | +54.6% |
ANET | Arista Networks | Cloud Networking | 🟢 Cont. Bull | +2.2% | +35.6% |
NVDA | NVIDIA | AI & Data Center GPUs | 🟢 Cont. Bull | +10.4% | +22.6% |
MRVL | Marvell Technology | Specialty Semiconductors | 🟢 Cont. Bull | −10.1% | +183.3% |
SPY | State Street SPDR S&P 500 ETF Trust | Asset Management | 🟢 Cont. Bull | +2.9% | +22.4% |
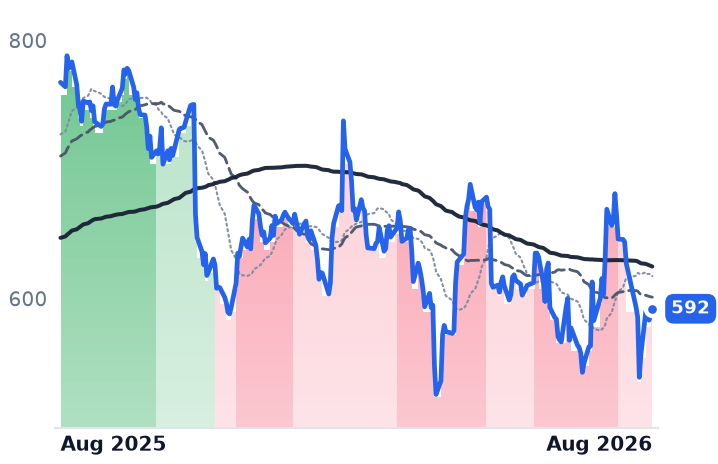
META | Meta Platforms | Social Media & Messaging | 🔴 Cont. Bear | −6.2% | −22.9% |
AMZN | Amazon.com | Online Marketplaces | 🟢 Cont. Bull | +11.1% | +23.3% |
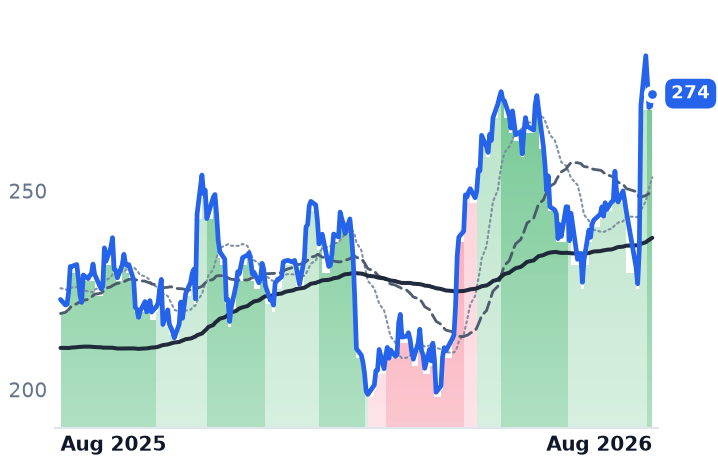
GOOGL | Alphabet | Search & Advertising | 🟢 Cont. Bull | −1.3% | +75.9% |
MSFT | Microsoft | Cloud Infrastructure & Platforms | 🔴 Cont. Bear | +30.1% | −3.7% |
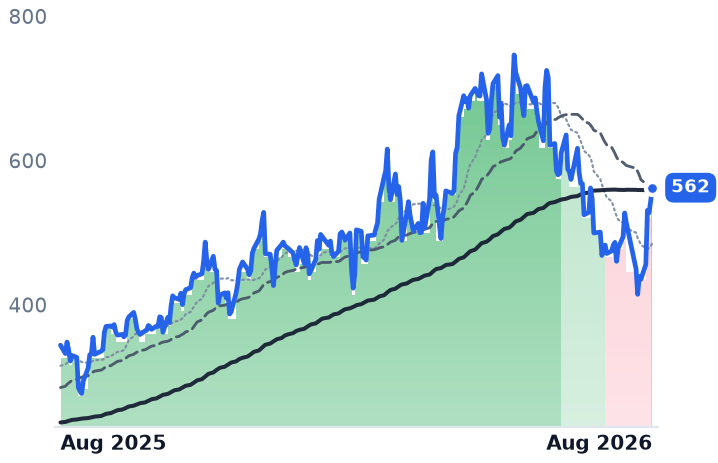
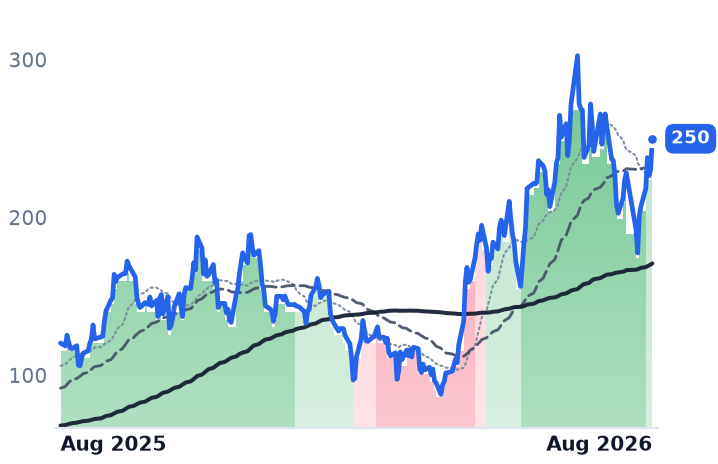
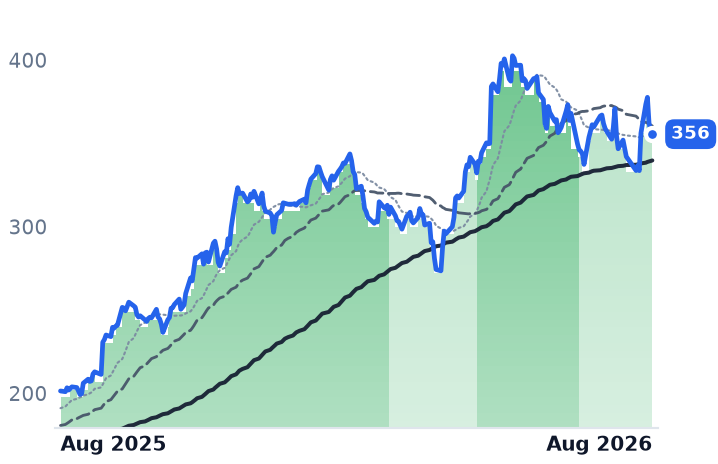
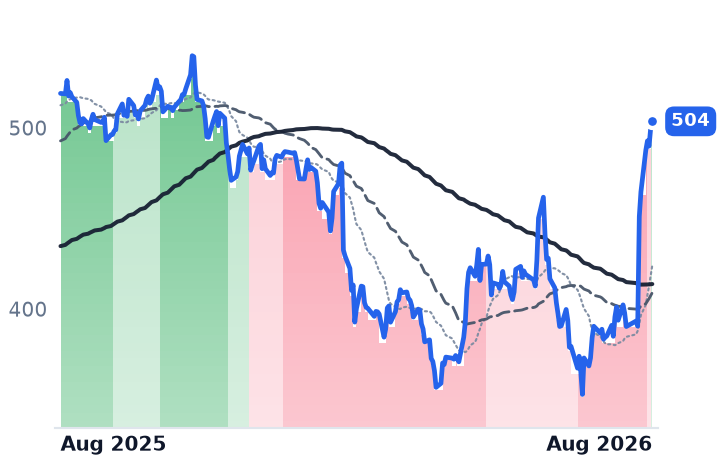
12-month price & trend
| Ticker | Mkt cap | P/E | P/E fwd | P/S | P/S fwd | P/GP | P/GP fwd | EV/EBITDA | FCF yld |
|---|---|---|---|---|---|---|---|---|---|
GLW | $142.7B | 75.0x | 50.7x | 8.4x | 7.4x | 23.1x | 20.4x | 42.6x | 1.7% |
LPTH | $820.0M | n/m | 474.9x | 13.1x | 7.8x | 40.8x | 24.3x | n/m | -1.3% |
OLED | $4.2B | 22.0x | 21.7x | 6.9x | 6.6x | 9.2x | 8.8x | 15.9x | 4.1% |
| Ticker | Mkt cap | P/E | P/E fwd | P/S | P/S fwd | P/GP | P/GP fwd | EV/EBITDA | FCF yld |
|---|---|---|---|---|---|---|---|---|---|
COHR | $56.9B | 127.0x | 34.7x | 8.6x | 5.9x | 23.2x | 16.0x | 50.6x | -0.9% |
LITE | $60.3B | 124.8x | 41.7x | 24.2x | 10.6x | 64.2x | 28.1x | 110.5x | 0.5% |
AAOI | $10.0B | n/m | 120.2x | 16.7x | 9.6x | 57.8x | 33.2x | n/m | -5.6% |
| Ticker | Mkt cap | P/E | P/E fwd | P/S | P/S fwd | P/GP | P/GP fwd | EV/EBITDA | FCF yld |
|---|---|---|---|---|---|---|---|---|---|
FN | $25.9B | 61.9x | 52.3x | 6.1x | 5.6x | 51.0x | 46.8x | 51.8x | 0.2% |
CRDO | $31.8B | 89.4x | 33.0x | 29.7x | 14.3x | 43.8x | 21.1x | 87.3x | 0.9% |
CIEN | $78.4B | 343.0x | 90.0x | 15.3x | 12.7x | 37.6x | 31.2x | 159.0x | 0.9% |
| Ticker | Mkt cap | P/E | P/E fwd | P/S | P/S fwd | P/GP | P/GP fwd | EV/EBITDA | FCF yld |
|---|---|---|---|---|---|---|---|---|---|
APH | $153.8B | 34.3x | 26.3x | 5.9x | 4.6x | 15.3x | 11.9x | 21.2x | 3.0% |
ANET | $237.6B | 58.8x | 46.9x | 22.5x | 19.1x | 35.7x | 30.3x | 46.1x | 2.2% |
NVDA | $5.4T | 34.0x | 24.8x | 21.3x | 13.7x | 28.7x | 18.5x | 28.0x | 2.2% |
| Ticker | Mkt cap | P/E | P/E fwd | P/S | P/S fwd | P/GP | P/GP fwd | EV/EBITDA | FCF yld |
|---|---|---|---|---|---|---|---|---|---|
MRVL | $230.5B | 92.0x | 65.3x | 26.4x | 20.1x | 52.1x | 39.7x | 50.5x | 0.7% |
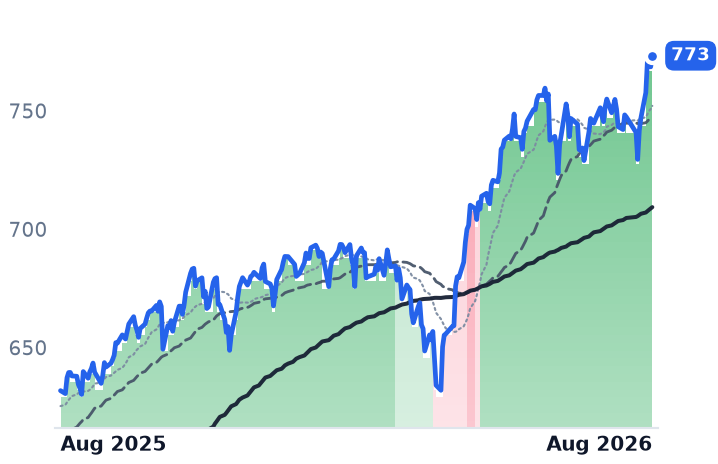
SPY | $773.0B | — | — | — | — | — | — | — | — |
META | $1.5T | 21.9x | 18.4x | 6.6x | 5.9x | 8.1x | 7.2x | 14.9x | 2.7% |
| Ticker | Mkt cap | P/E | P/E fwd | P/S | P/S fwd | P/GP | P/GP fwd | EV/EBITDA | FCF yld |
|---|---|---|---|---|---|---|---|---|---|
AMZN | $2.9T | 21.6x | 23.3x | 3.8x | 3.5x | 7.5x | 6.9x | 12.1x | -0.4% |
GOOGL | $4.3T | 17.8x | 17.7x | 9.7x | 8.7x | 15.9x | 14.3x | 13.5x | 1.2% |
MSFT | $3.7T | 27.8x | 25.5x | 11.2x | 9.5x | 16.5x | 14.0x | 18.4x | 1.8% |
Valuation & fundamentals
Consensus projections
| Ticker | FY2026E | FY2027E | FY2028E | |
|---|---|---|---|---|
GLW | Revenue | +17.5% | +18.7% | +21.0% |
| EPS | +29.6% | +31.7% | +36.5% | |
LPTH | Revenue | +91.2% | +47.8% | +32.5% |
| EPS | −7.6% | −113.3% | +1754.5% | |
OLED | Revenue | −2.7% | +7.4% | +11.7% |
| EPS | −14.8% | +12.9% | +21.0% | |
COHR | Revenue | +21.9% | +37.7% | +38.2% |
| EPS | +55.9% | +53.4% | +58.4% | |
LITE | Revenue | +83.9% | +89.0% | +54.6% |
| EPS | +314.0% | +125.9% | +58.9% | |
AAOI | Revenue | +129.8% | +169.3% | +48.7% |
| EPS | −417.3% | +454.2% | +102.6% | |
FN | Revenue | +35.4% | +22.8% | +21.3% |
| EPS | +35.9% | +24.4% | +23.2% | |
CRDO | Revenue | +211.9% | +67.5% | +37.6% |
| EPS | +423.2% | +57.8% | +34.3% | |
CIEN | Revenue | +31.1% | +22.0% | +27.0% |
| EPS | +145.3% | +39.8% | +47.3% | |
APH | Revenue | +45.2% | +13.5% | +10.5% |
| EPS | +43.5% | +17.1% | +12.4% | |
ANET | Revenue | +40.0% | +27.7% | +21.9% |
| EPS | +39.6% | +25.5% | +23.9% | |
NVDA | Revenue | +65.1% | +84.2% | +43.2% |
| EPS | +59.0% | +91.7% | +42.0% | |
MRVL | Revenue | +42.4% | +40.1% | +44.0% |
| EPS | +82.6% | +41.9% | +51.9% | |
META | Revenue | +27.3% | +19.9% | +17.9% |
| EPS | +39.6% | +7.2% | +15.8% | |
AMZN | Revenue | +15.7% | +14.0% | +15.9% |
| EPS | +63.6% | −10.9% | +30.2% | |
GOOGL | Revenue | +23.7% | +22.3% | +19.1% |
| EPS | +90.5% | −26.0% | +18.1% | |
MSFT | Revenue | +18.0% | +18.2% | +19.6% |
| EPS | +26.7% | +15.4% | +18.5% |
Forward fiscal years only. Blank means no analyst coverage for that year.
A regulatory catalyst, not an earnings one
The optical layer of the artificial-intelligence build-out — the fibre, connectors and laser modules that move data between server racks — got a policy jolt in early August. Bloomberg reported on 5 August that the US is drafting a ban on imports of some Chinese data-centre components, knocking Zhongji Innolight down as much as 14% in Shenzhen and Eoptolink 11%. American suppliers moved the other way: on 4 August, Applied Optoelectronics closed up 17%, Coherent 10% and Lumentum 9% on expectations that cloud operators would shift procurement home. Corning was named among the beneficiaries. The research firm Counterpoint countered that a ban would worsen a supply bottleneck US firms cannot currently relieve — the tension the trade now rests on.
It landed on a group that had just been broken. Corning, which makes optical fibre, cable and connectors for telecom and data-centre customers alongside display glass, Gorilla Glass and ceramic auto substrates, reported June-quarter core earnings of $0.78 against $0.76 expected — and fell 18% on 28 July, its worst day since 2002, because September-quarter revenue guidance of $4.9–5.0bn sat at or below the $5bn consensus. Marvell, Lumentum, AXT and Coherent all fell more than 10% the same day, and Alphabet's capital-spending disclosure that afternoon triggered a broader sell-off in AI infrastructure names. Peak to trough, Corning lost 51.5% in a month; it has since recovered a third of the way back.
Corning: the business improved while the price fell
CONFIRMS. Group revenue rose 16.6% to $4.505bn with operating income up 21.8% — operating leverage, not just volume. Optical Communications sales rose 32% to $2.07bn, enterprise revenue 65% to $1.27bn, and AI data-centre sales nearly doubled; segment net income rose 77% to a record 21% margin. Management has named its customers: roughly $6bn of multi-year Meta business, a commercial partnership with Nvidia, and a multi-billion-dollar Amazon agreement. Its long-range "Springboard" plan was raised to $20bn annualised sales by end-2026, $30bn by 2028 and $40bn by 2030. The drag is the consumer side — glass innovations grew 1%, with handset units expected down mid-teens on rising memory prices. The demand pool is real: the four largest cloud buyers plan roughly $725bn of 2026 capital spending, up about 77%.
Valuation: INCONCLUSIVE. The de-rating did rational work without making the stock cheap. Corning trades at 75.0x trailing and 50.7x forward earnings, 42.6x enterprise value to EBITDA and 23.2x gross profit — below this desk's own May anchor of 87.7x earnings, but only on 2027 consensus of $4.30 a share does it reach 38.5x.
The other two are not in the same business
LightPath Technologies, an Orlando maker of moulded glass and infrared lenses for defence and industrial customers, is the cohort's genuine growth story and its riskiest. March-quarter revenue doubled to $19.15m, gross margin went from 29.1% to 36.3%, and the operating loss narrowed to 4.5% of sales from 36.3%. Backlog reached about $110.6m, up 196%, with roughly 70% of the $103m defence portion shipping this calendar year; China's germanium export curbs have pushed customers toward its in-house chalcogenide glass, worth up to $40m of added bookings. But it still loses money, diluted shares are up 48% since September 2024, and it raised about $47m net at $14.00 a share on 1 June — the stock now sits 6.7% below that price at 13.1x trailing sales. CONFIRMS the business, CONTRADICTS the drawdown.
Universal Display, which licenses organic light-emitting-diode patents and sells the emitter chemicals that colour phone and tablet screens, has no data-centre exposure whatsoever. June-quarter revenue fell 11.4% to $152.2m, materials sales fell 26%, operating margin compressed to 35.3% from 39.9%, and full-year revenue was guided to the low end of $630–670m on weak smartphone units and Chinese panel-maker pressure. At 22.0x trailing and 21.7x forward earnings — essentially no gap, meaning no growth is priced — with $855m of cash equal to 20.4% of its market value, its de-rating is far advanced and entirely deserved. Grouping it with fibre is measuring two different cycles.
What the tape did
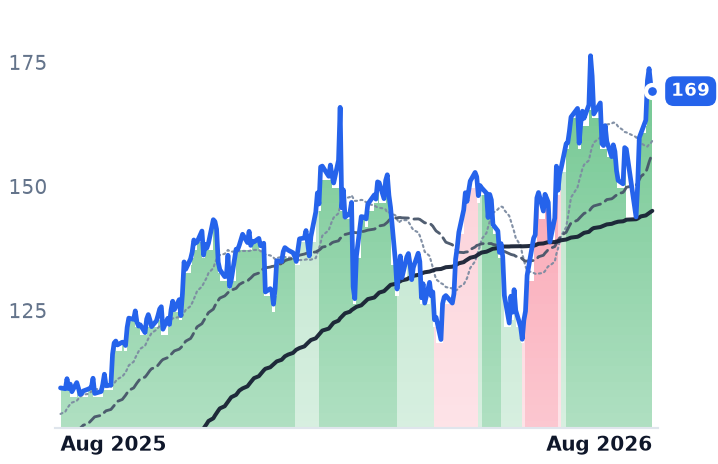
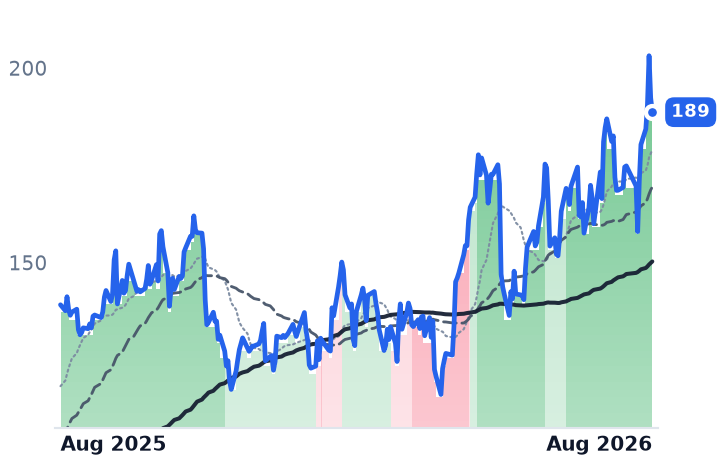
The trend labels that turned negative in late July were stamped at the bottom: Corning's moving-average trend flipped down on 29 July and LightPath's on 30 July, the two lowest closes of the year, after which both rallied 33–39%. The same downgrade hit Applied Optoelectronics, Ciena, Credo and Fabrinet in the same window — a group event, not a company one.
The setup
Where it stands — Corning's optical business is compounding above 30% while the shares sit 35% below their June high. Would confirm — September-quarter core sales landing at or above the guided $4.9–5.0bn with optical growth held above 25%. Would invalidate — Optical Communications growth decelerating below the mid-teens, or hyperscaler capital-spending plans being trimmed. Watch next — Corning's third-quarter report in late October; any formal rulemaking on Chinese transceiver imports before then. Valuation — 75.0x trailing and 50.7x forward earnings, against this desk's 87.7x May anchor and 38.5x on 2027 consensus.