

Applied Digital's Contracted Revenue Doubled. Its Anchor Tenant Now Prices at Coin-Flip Default.
Hypothesis Opus 5 · Research Opus 5 · Writing Opus 5 · Prompt v1.2
Six companies that own or lease the buildings where artificial-intelligence computing runs have sold off over the past month, on worries about how the buildout is financed rather than whether tenants want the space. Alphabet's 22 July results lifted 2026 capital-spending guidance to $195-205bn and were punished anyway.
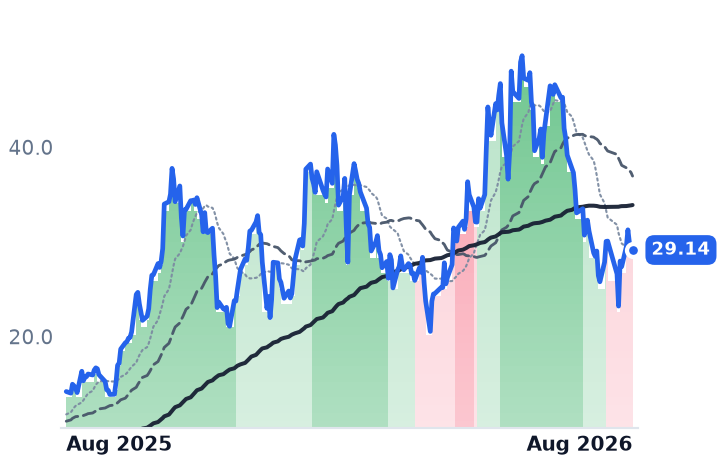
The group average is misleading. Equal-weighted the six fell about 17% in 30 days; weighted by size they fell 9%, because two micro-caps worth 7% of the group's roughly $20.6bn of combined value supply about two-thirds of the arithmetic. Applied Digital, the largest, is the real divergence: fiscal-2026 revenue grew 183.7% to $611.3m, contracted lease revenue roughly doubled to $31bn after a 15-year, $7.5bn hyperscaler lease, and its price-to-sales multiple halved from 28.7x in May to 14.4x.
The catch is who pays the rent: its anchor tenant's credit-default swaps blew past 855 basis points in late July.
| Ticker | Company | Segment | Trend | 30D | 1Y |
|---|---|---|---|---|---|
| The subject · what this brief is about | |||||
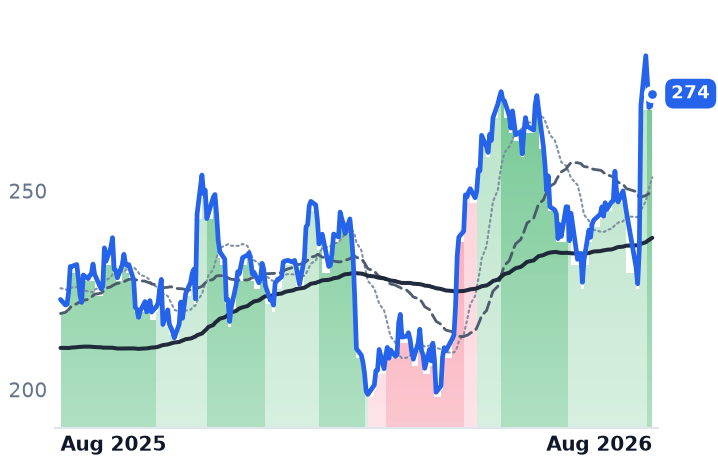
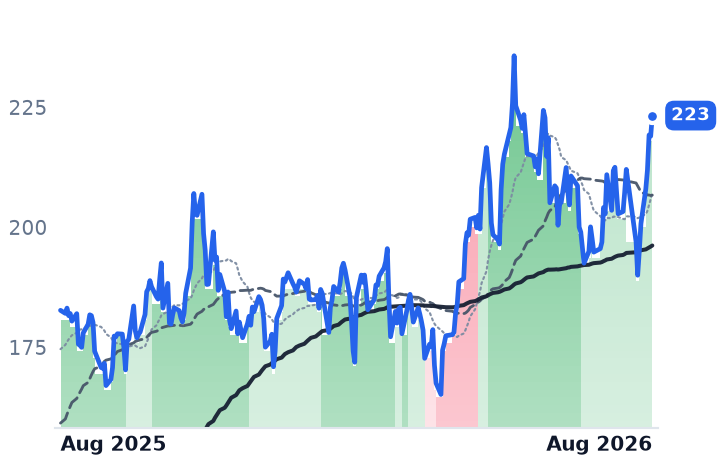
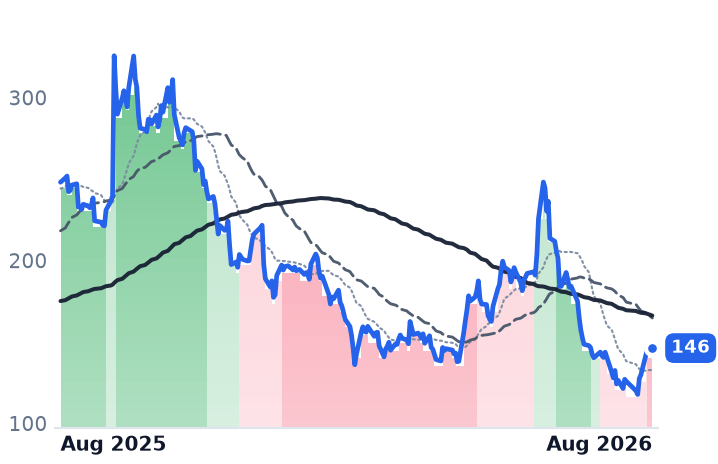
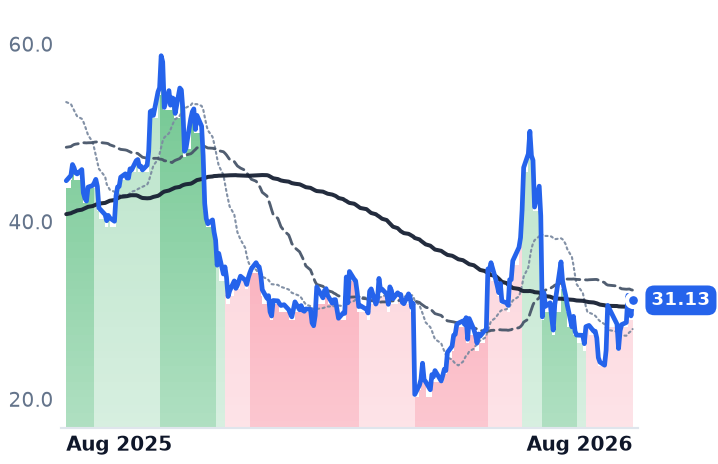
APLD | Applied Digital | Data Center & Cloud Infrastructure | 🟢 Cont. Bull | −9.5% | +105.8% |
GDS | GDS | Data Center & Cloud Infrastructure | ⚠️ Emerging Bear | −2.5% | −12.1% |
VNET | VNET | Data Center & Cloud Infrastructure | ⚠️ Emerging Bear | −8.9% | −8.1% |
KEEL | Keel Infrastructure | Data Center & Cloud Infrastructure | 🟢 Cont. Bull | −19.8% | +212.9% |
SHAZ | SharonAI | Data Center & Cloud Infrastructure | 🌱 Emerging Bull | −37.8% | +57.1% |
WYFI | WhiteFiber, Inc. Ordinary Shares | Data Center & Cloud Infrastructure | 🌱 Emerging Bull | −36.6% | +61.0% |
| Compared against · context, not the story | |||||
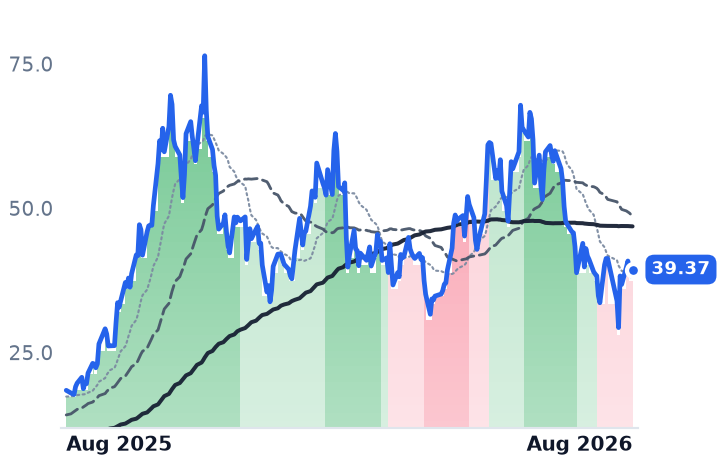
CRWV | CoreWeave | Cloud GPU Computing | 🔴 Cont. Bear | +1.1% | −30.0% |
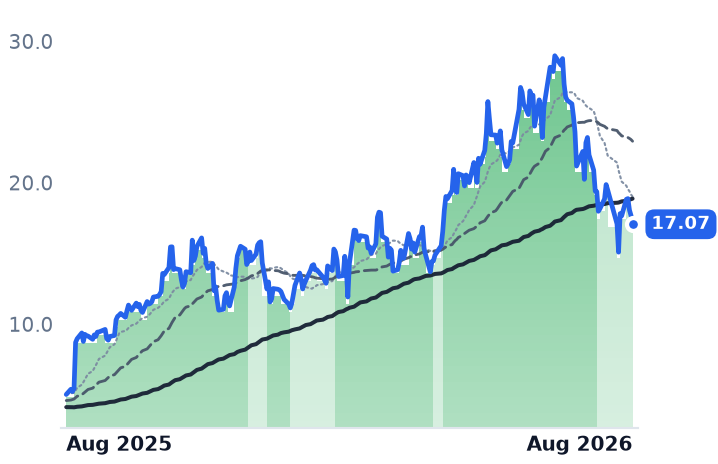
NBIS | Nebius | Cloud Infrastructure & AI | 🟢 Cont. Bull | −13.1% | +173.3% |
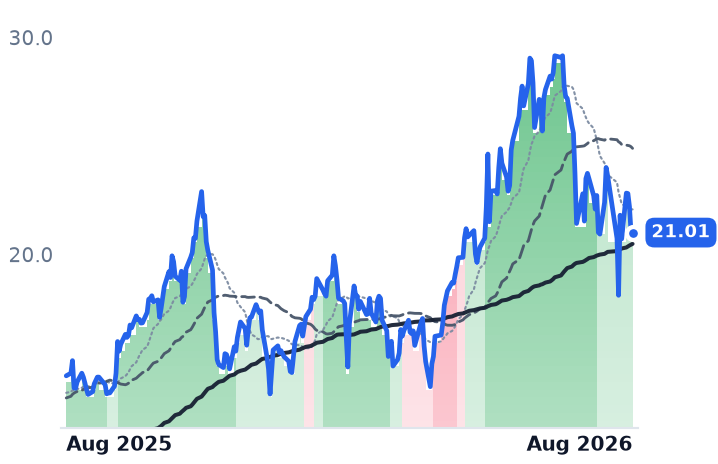
IREN | IREN | Digital Assets & Blockchain | 🟢 Cont. Bull | −1.2% | +123.5% |
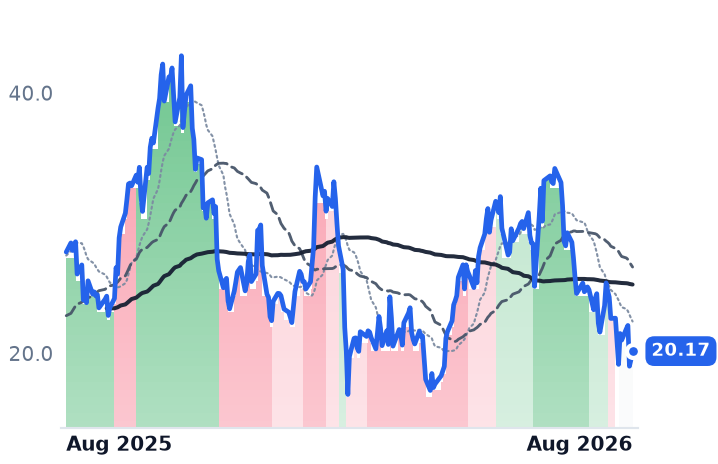
WULF | TeraWulf | Bitcoin Mining | 🟢 Cont. Bull | −26.4% | +239.6% |
CORZ | Core Scientific | Blockchain & Crypto | 🟢 Cont. Bull | −11.5% | +45.8% |
GLXY | Galaxy Digital | Diversified Financial Services | 🌱 Emerging Bull | −19.6% | −27.4% |
VRT | Vertiv | Data Center Power & Thermal | 🟢 Cont. Bull | −15.9% | +94.8% |
EQIX | Equinix | Data Center & Colocation | 🌱 Emerging Bull | +0.7% | +36.7% |
DLR | Digital Realty Trust | Data Center & Colocation | 🟢 Cont. Bull | +8.1% | +16.6% |
MSFT | Microsoft | Cloud Infrastructure & Platforms | 🔴 Cont. Bear | +30.1% | −3.7% |
AMZN | Amazon.com | Online Marketplaces | 🟢 Cont. Bull | +11.1% | +23.3% |
NVDA | NVIDIA | AI & Data Center GPUs | 🟢 Cont. Bull | +10.4% | +22.6% |
ORCL | Oracle | Cloud Infrastructure & Platforms | 🔴 Cont. Bear | +2.3% | −40.7% |
SMCI | Super Micro Computer | Server & Infrastructure Systems | 🔴 Cont. Bear | +10.2% | −30.2% |
GOOGL | Alphabet | Search & Advertising | 🟢 Cont. Bull | −1.3% | +75.9% |
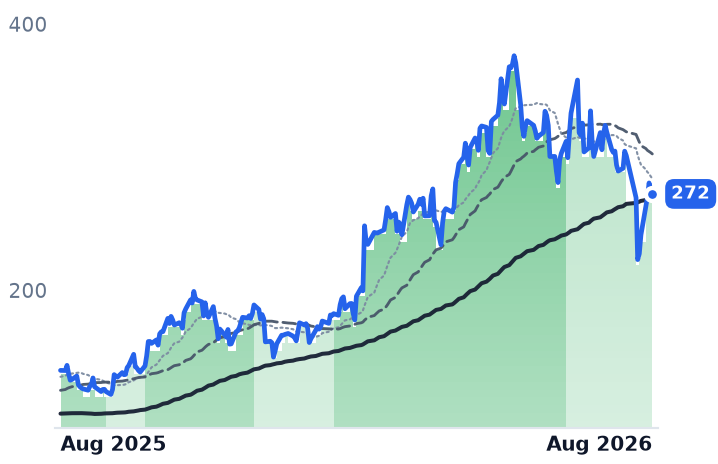
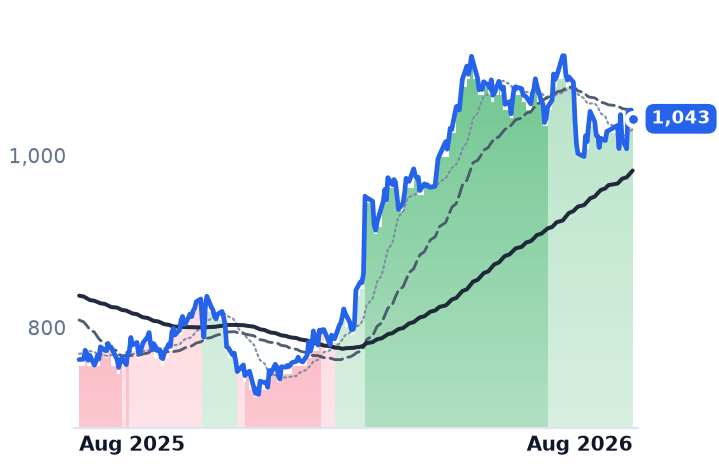
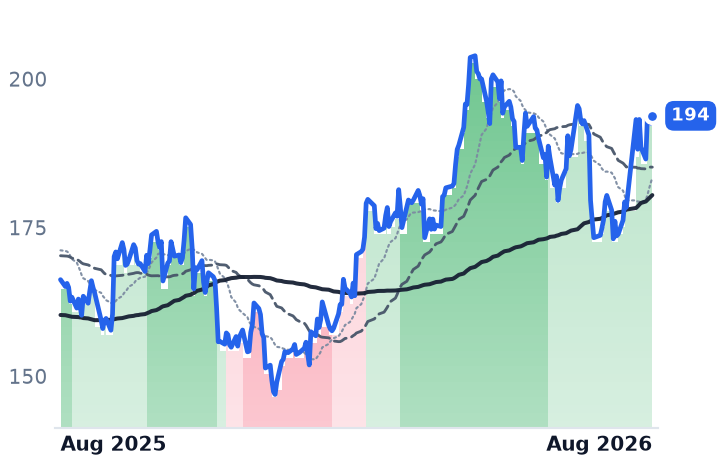
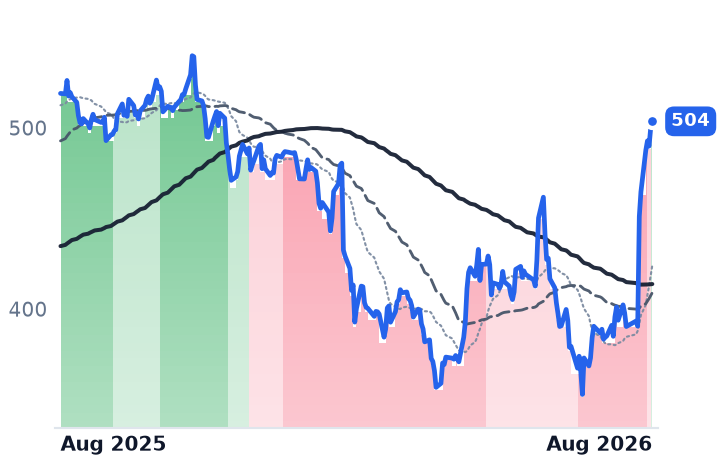
12-month price & trend
| Ticker | Mkt cap | P/E | P/E fwd | P/S | P/S fwd | P/GP | P/GP fwd | EV/EBITDA | FCF yld |
|---|---|---|---|---|---|---|---|---|---|
APLD | $8.3B | n/m | — | 14.4x | 10.1x | 64.3x | 45.1x | n/m | -33.4% |
GDS | $6.3B | 15.6x | 4.7x | 3.6x | 0.5x | 14.2x | 2.0x | 13.8x | -3.1% |
VNET | $1.9B | n/m | — | 1.3x | 0.2x | 6.0x | 0.9x | 9.6x | -45.5% |
| Ticker | Mkt cap | P/E | P/E fwd | P/S | P/S fwd | P/GP | P/GP fwd | EV/EBITDA | FCF yld |
|---|---|---|---|---|---|---|---|---|---|
KEEL | $2.5B | n/m | — | 12.7x | 22.5x | — | — | n/m | -13.2% |
SHAZ | $512.9M | n/m | — | 334.0x | 3.4x | — | 52.8x | n/m | -12.0% |
WYFI | $1.0B | n/m | — | 11.9x | 7.9x | 27.6x | 18.3x | n/m | 6.0% |
| Ticker | Mkt cap | P/E | P/E fwd | P/S | P/S fwd | P/GP | P/GP fwd | EV/EBITDA | FCF yld |
|---|---|---|---|---|---|---|---|---|---|
CRWV | $46.6B | n/m | — | 7.5x | 3.7x | 10.8x | 5.3x | 25.7x | -22.8% |
NBIS | $45.6B | 56.0x | — | 51.9x | 13.5x | 108.3x | 28.2x | 32.8x | -5.4% |
IREN | $13.5B | 948.3x | — | 17.9x | 4.8x | 33.4x | 9.0x | 32.1x | -13.4% |
| Ticker | Mkt cap | P/E | P/E fwd | P/S | P/S fwd | P/GP | P/GP fwd | EV/EBITDA | FCF yld |
|---|---|---|---|---|---|---|---|---|---|
WULF | $8.7B | n/m | — | 52.8x | 28.4x | 93.6x | 50.4x | n/m | -34.9% |
CORZ | $7.7B | n/m | — | 21.7x | 11.7x | 129.5x | 69.8x | 98.3x | -6.1% |
GLXY | $9.8B | n/m | — | 0.2x | 0.2x | 8.1x | 8.1x | 12.8x | -20.1% |
| Ticker | Mkt cap | P/E | P/E fwd | P/S | P/S fwd | P/GP | P/GP fwd | EV/EBITDA | FCF yld |
|---|---|---|---|---|---|---|---|---|---|
VRT | $142.5B | 91.1x | 57.7x | 13.1x | 10.3x | 36.2x | 28.5x | 61.1x | 1.6% |
EQIX | $102.9B | 66.8x | 60.6x | 10.5x | 10.0x | 20.3x | 19.4x | 27.9x | 1.3% |
DLR | $71.7B | 89.3x | 74.1x | 10.5x | 10.2x | 76.3x | 74.1x | 25.8x | 1.9% |
| Ticker | Mkt cap | P/E | P/E fwd | P/S | P/S fwd | P/GP | P/GP fwd | EV/EBITDA | FCF yld |
|---|---|---|---|---|---|---|---|---|---|
MSFT | $3.7T | 27.8x | 25.5x | 11.2x | 9.5x | 16.5x | 14.0x | 18.4x | 1.8% |
AMZN | $2.9T | 21.6x | 23.3x | 3.8x | 3.5x | 7.5x | 6.9x | 12.1x | -0.4% |
NVDA | $5.4T | 34.0x | 24.8x | 21.3x | 13.7x | 28.7x | 18.5x | 28.0x | 2.2% |
| Ticker | Mkt cap | P/E | P/E fwd | P/S | P/S fwd | P/GP | P/GP fwd | EV/EBITDA | FCF yld |
|---|---|---|---|---|---|---|---|---|---|
ORCL | $413.1B | 24.1x | 17.8x | 6.1x | 4.6x | 9.3x | 7.0x | 16.8x | -5.7% |
SMCI | $18.4B | 13.6x | 8.8x | 0.5x | 0.3x | 4.6x | 2.8x | 13.5x | -37.3% |
GOOGL | $4.3T | 17.8x | 17.7x | 9.7x | 8.7x | 15.9x | 14.3x | 13.5x | 1.2% |
Valuation & fundamentals
Consensus projections
| Ticker | FY2026E | FY2027E | FY2028E | |
|---|---|---|---|---|
APLD | Revenue | +98.7% | +92.4% | +149.3% |
| EPS | −24.3% | +6.9% | −104.0% | |
GDS | Revenue | +11.2% | +11.0% | +18.0% |
| EPS | −13.3% | −75.5% | +48.9% | |
VNET | Revenue | +19.9% | +21.0% | +18.6% |
| EPS | −37.9% | −261.0% | +74.7% | |
KEEL | Revenue | −59.1% | +12.9% | +81.9% |
| EPS | +59.7% | −46.8% | +71.4% | |
SHAZ | Revenue | +9846.3% | +823.7% | +76.6% |
| EPS | −44.7% | +7.9% | +24.6% | |
WYFI | Revenue | +63.5% | +110.2% | +54.2% |
| EPS | +2.2% | −134.8% | +157.8% | |
CRWV | Revenue | +147.1% | +98.0% | +60.2% |
| EPS | +194.1% | −65.7% | −325.8% | |
NBIS | Revenue | +512.2% | +244.5% | +86.2% |
| EPS | +126.3% | +35.2% | −23.8% | |
IREN | Revenue | +38.3% | +300.2% | +91.3% |
| EPS | −1004.3% | −68.5% | −1007.5% | |
WULF | Revenue | +72.8% | +212.8% | +76.3% |
| EPS | −5.6% | −89.8% | −376.7% | |
CORZ | Revenue | +83.8% | +66.9% | +22.3% |
| EPS | −60.1% | −172.6% | +236.5% | |
GLXY | Revenue | −26.1% | +27.1% | +18.4% |
| EPS | −31.0% | −201.6% | −18.5% | |
VRT | Revenue | +35.2% | +25.8% | +19.4% |
| EPS | +55.6% | +33.8% | +25.8% | |
EQIX | Revenue | +11.0% | +10.7% | +11.2% |
| EPS | +16.6% | +9.5% | +9.5% | |
DLR | Revenue | +16.0% | +11.1% | +14.1% |
| EPS | −28.5% | −3.7% | +25.8% | |
MSFT | Revenue | +18.0% | +18.2% | +19.6% |
| EPS | +26.7% | +15.4% | +18.5% | |
AMZN | Revenue | +15.7% | +14.0% | +15.9% |
| EPS | +63.6% | −10.9% | +30.2% | |
NVDA | Revenue | +65.1% | +84.2% | +43.2% |
| EPS | +59.0% | +91.7% | +42.0% | |
ORCL | Revenue | +17.8% | +33.2% | +45.5% |
| EPS | +25.3% | +7.6% | +35.6% | |
SMCI | Revenue | +77.7% | +34.0% | +19.7% |
| EPS | +33.5% | +15.5% | +13.8% | |
GOOGL | Revenue | +23.7% | +22.3% | +19.1% |
| EPS | +90.5% | −26.0% | +18.1% |
Forward fiscal years only. Blank means no analyst coverage for that year.
The worry is the funding, not the demand
The companies in this story are landlords to the artificial-intelligence boom rather than participants in it: they own or lease the halls, wire the power and rent capacity to the firms that buy the chips. Through late July they were repriced on a question that has nothing to do with tenant appetite. Alphabet's 22 July results raised 2026 capital-spending guidance to $195-205bn from $180-190bn and flagged a "significant" increase for 2027 — and the shares fell 7%, a reversal of the reflex that had rewarded every spending raise. Days later, reporting that Nvidia was in talks to guarantee roughly $250bn of financing for an OpenAI data-centre project helped wipe about $1.3 trillion off chip-sector value on concerns about circular funding and mounting debt.
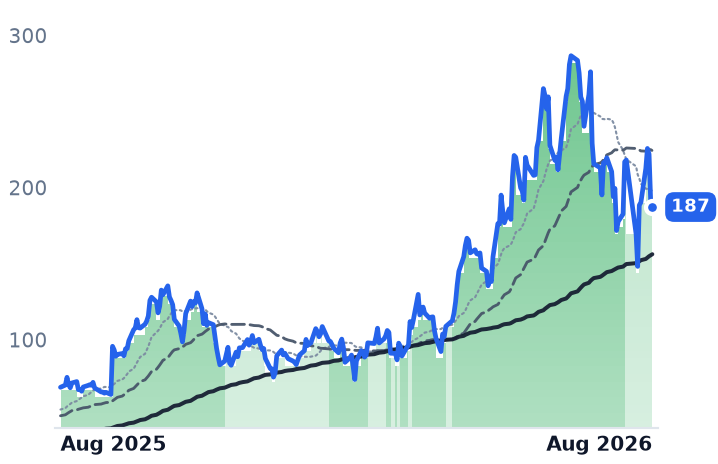
The resulting split runs along balance sheets, not business models. Over the 30 days to 7 August, Microsoft rose 31.4%, established landlords Digital Realty and Equinix gained 9.9% and 2.6% — while junk-rated, equity- and lease-funded builders fell: TeraWulf 25.3%, Nebius 13.5%, Core Scientific 10.6%, IREN 8.5%. Demand itself is not in question: hyperscaler 2026 budgets run near $200bn at Amazon and $110-120bn at Microsoft, and colocation operators are signing 10-15 year build-to-suit leases on whole campuses.
The group average is two micro-caps
Equal-weighted, the six names fell 17.4% in 30 days. Weighted by market value they fell 9.2%. SharonAI (-34.6%) and WhiteFiber (-33.0%), together 7% of the group's ~$20.6bn of combined value, account for roughly 65% of the decline. Applied Digital fell 7.3% and GDS 2.6%.
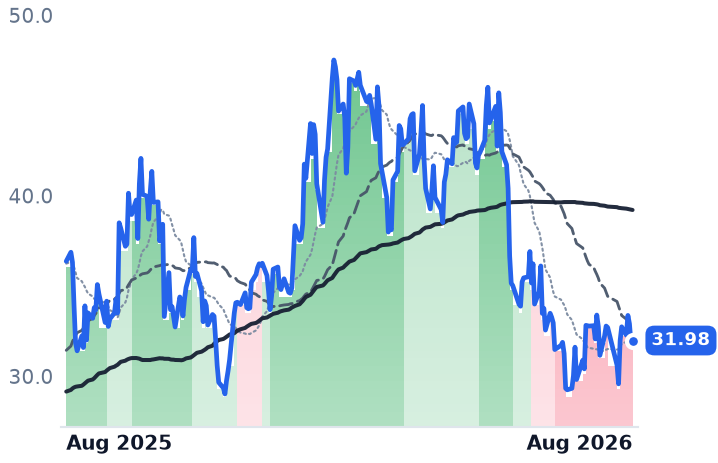
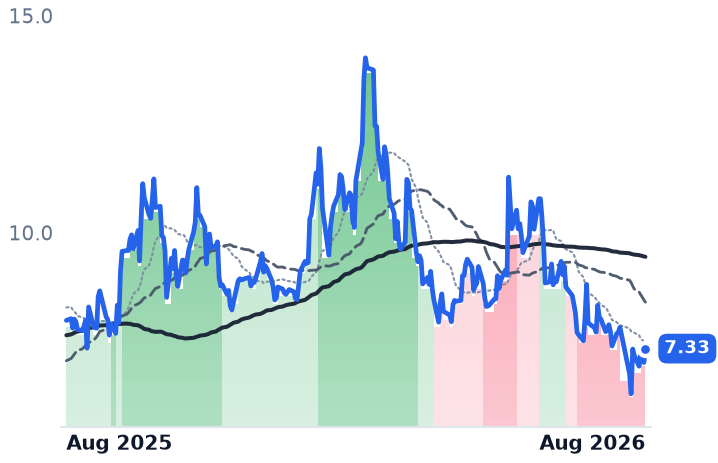
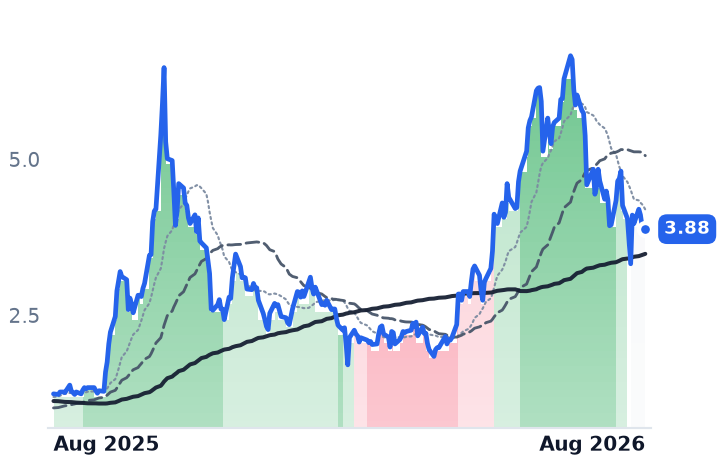
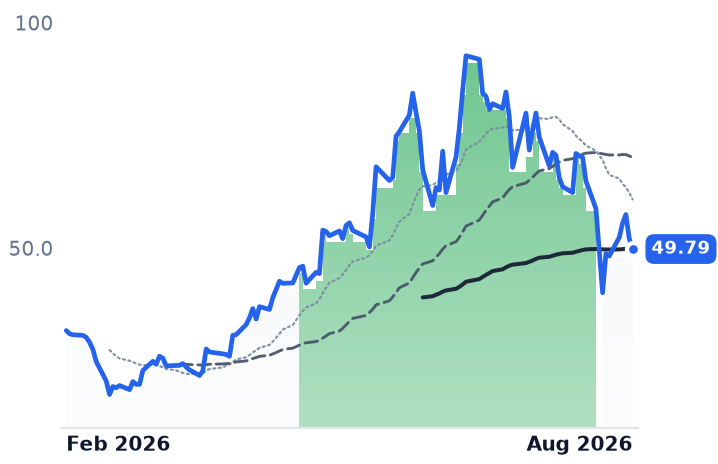
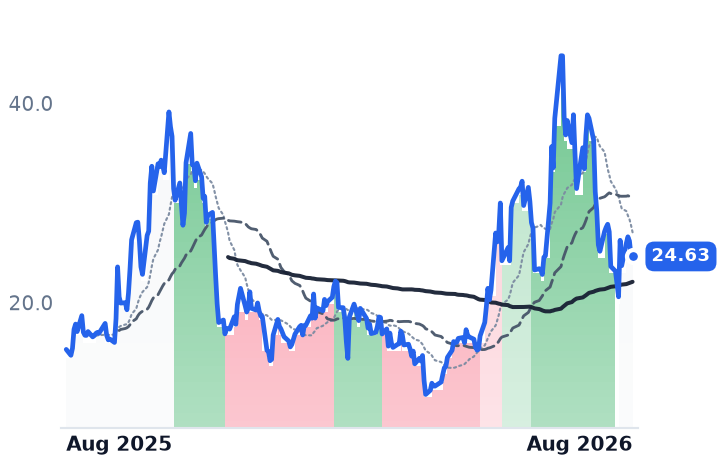
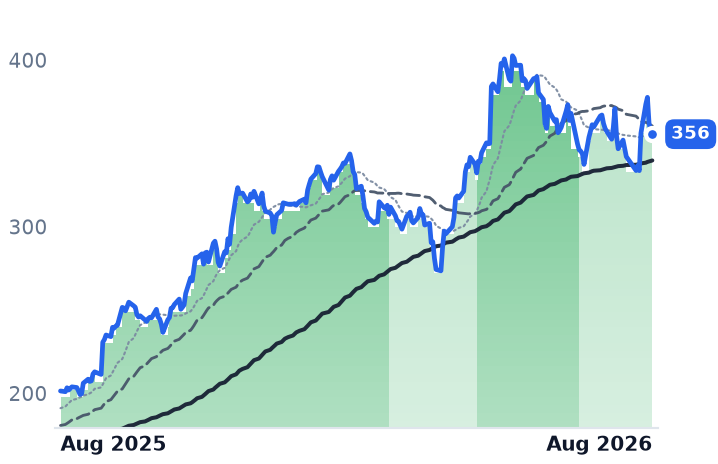
The twelve-month picture is equally split: Keel Infrastructure is up 203.1% and Applied Digital 104.6%, while GDS is down 14.2% and VNET 10.1%. And the one-month frame flatters the tape — Applied Digital is down 29.4% over 90 days and 41.3% from its 52-week high; GDS is down 27.7% over 90 days, with its 50-day average beneath its 200-day every session since 18 June.
Applied Digital: the business and the tape point opposite ways
Applied Digital, a Dallas developer of purpose-built AI data centres that pivoted out of crypto-mining hosting, grew fiscal-2026 revenue (year to 31 May) 183.7% to $611.3m, with gross margin widening from 10.5% to 25.8%. It reported on 27 July a continuing-operations net loss of $249.2m, or $0.91 a share. Contracted revenue is the striking number: a 15-year, 300-megawatt take-or-pay lease with a U.S. investment-grade hyperscaler worth about $7.5bn lifted total contracted lease revenue to roughly $31bn across four campuses and 1,200 megawatts, from roughly $16bn in May.
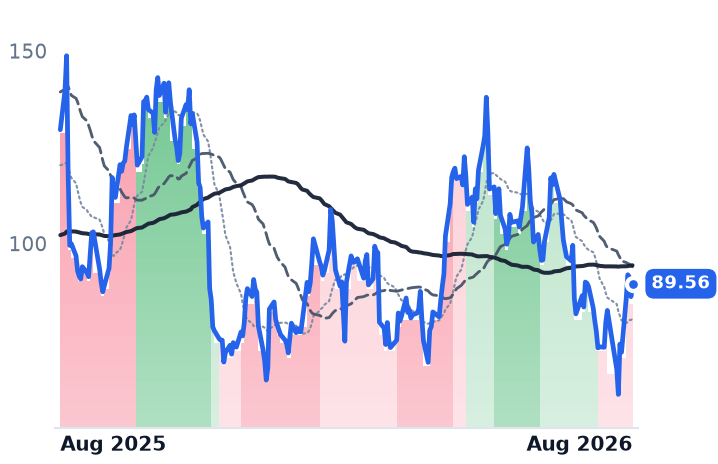
On business momentum the tape CONTRADICTS the fundamentals. On valuation it is INCONCLUSIVE. Price-to-sales compressed from 28.7x in early May to 14.4x trailing and 10.1x forward — but price-to-gross-profit barely moved, 63.3x to 64.4x trailing, so investors are paying the same for each dollar of actual profit. Two caveats sit under the lease story: fourth-quarter gross margin fell to 15.7% from 42.5% the prior quarter, and diluted shares rose from 201.2m to 275.2m, alongside 2030 debt and a $5bn preferred-equity facility. Anchor tenant CoreWeave, on roughly 400 megawatts, saw its five-year credit-default swaps top about 855 basis points — implying roughly a coin-flip default probability over five years.
China's two hosts are growing into a falling tape
GDS Holdings, Shanghai-based and China's largest listed data-centre operator, grew first-quarter revenue 23.6% to RMB 3,367m with gross margin up to 33.6% from 23.7% and operating margin at 27.0%. It guided 2026 revenue to RMB 12.4-12.9bn and adjusted EBITDA to RMB 5.75-6.0bn, with RMB 30-50bn of capital spending over three years. It trades at 13.75x trailing enterprise value to EBITDA. VNET, the Beijing hosting and colocation group, grew revenue 19.8% to RMB 2,691m — a fifth straight quarter near 20% — but gross margin slipped to 22.9% from 25.2%, free cash flow yield is -45.5%, and it has guided to another 450-500 megawatts and RMB 10-12bn of 2026 capex. Both are diverging from their own results, and both carry U.S. delisting risk. Read them on EV/EBITDA, not the headline price-to-sales figures, which divide a dollar market value by yuan revenue.
The tail: one earner, one shrinker, one shell
Keel Infrastructure, the former Bitfarms rebuilt as an AI-power and data-centre developer, is the case where price CONFIRMS the business: first-quarter revenue fell 44.7% to $37.0m at a -71.1% gross margin, consensus sees fiscal-2026 revenue of $112.5m (-59%), and price-to-sales rises from 12.7x trailing to 22.6x forward because the denominator is shrinking; shares outstanding grew 45% in five quarters. SharonAI, a 25-person GPU-cloud startup, booked $294,014 of quarterly revenue against a $513m market value — 334x trailing sales — with the 3.4x forward figure resting on two analysts modelling a 98-fold revenue jump off a $1.25bn five-year contract with ESDS Software Solutions that this desk previously reported as disputed. WhiteFiber, spun out of Bit Digital last August, is the quiet operator: revenue up 30.7% to $21.9m at a 60.2% gross margin and the only positive free-cash-flow yield in the group, at 5.97%, on 19.2x trailing and 12.8x forward price-to-gross-profit.
The setup
Where it stands — A financing-driven de-rating is hitting all six, but only Keel's shrinking revenue justifies it; Applied Digital's contracted book doubled while its shares fell.
Would confirm — Applied Digital converting Polaris Forge leases into cash with gross margin recovering above the 25.8% full-year level next quarter.
Would invalidate — A CoreWeave payment deferral or renegotiation on its roughly 400 megawatts, or further equity issuance beyond the 36.8% share growth already booked.
Watch next — Applied Digital's fiscal first-quarter results in October; GDS and VNET second-quarter reports and any change to 2026 capex guidance.
Valuation — Applied Digital 14.4x trailing and 10.1x forward sales versus 28.7x in May; GDS 13.75x and VNET 9.58x trailing EV/EBITDA.