

AI Data-Center Financiers Post Record Fees as Brookfield's Parent Diverges
Hypothesis Opus 5 · Research Sonnet 5 · Writing Sonnet 5 · Prompt v1.1
The private-credit firms, banks and infrastructure managers that finance AI data centers reported record fees and deal volume in late July, but Brookfield Corporation broke from its peers into a downtrend even as its own asset-management arm posted the same kind of record quarter.
| Ticker | Company | Segment | Trend | 30D | 1Y |
|---|---|---|---|---|---|
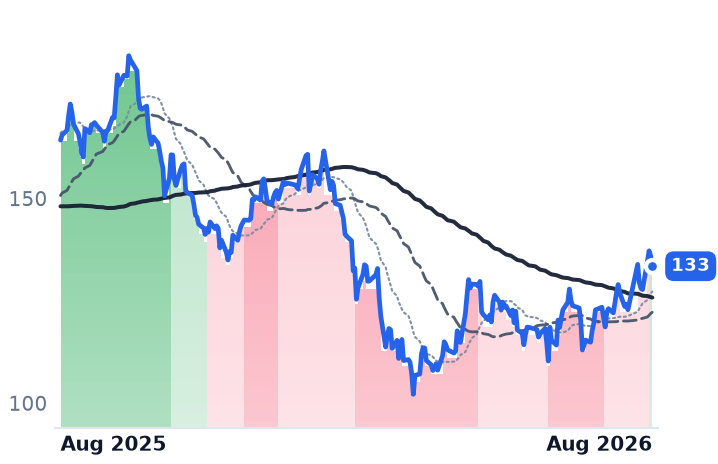
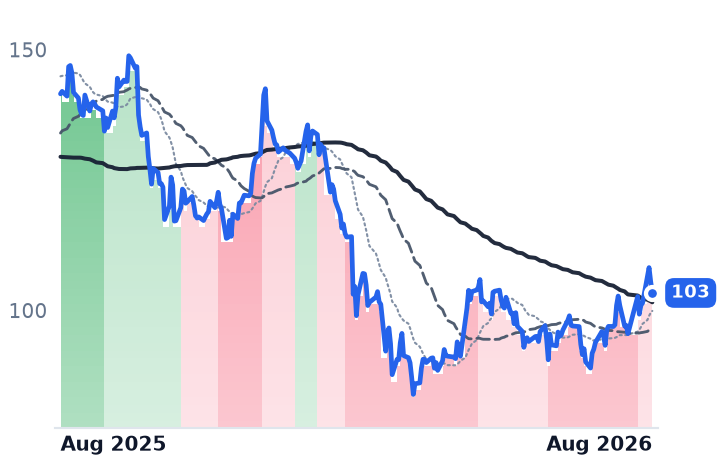
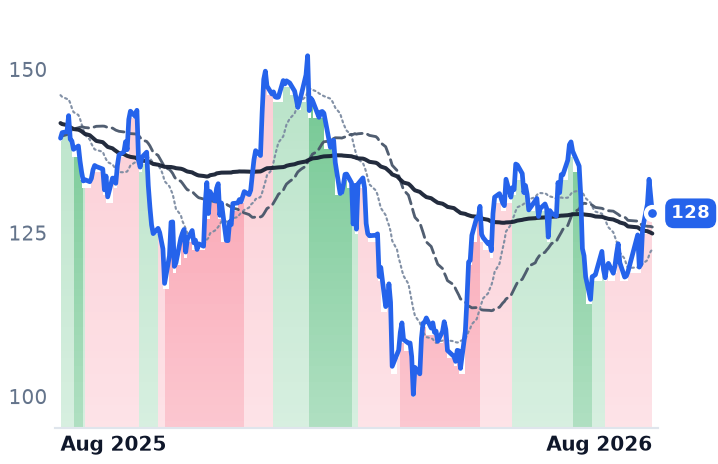
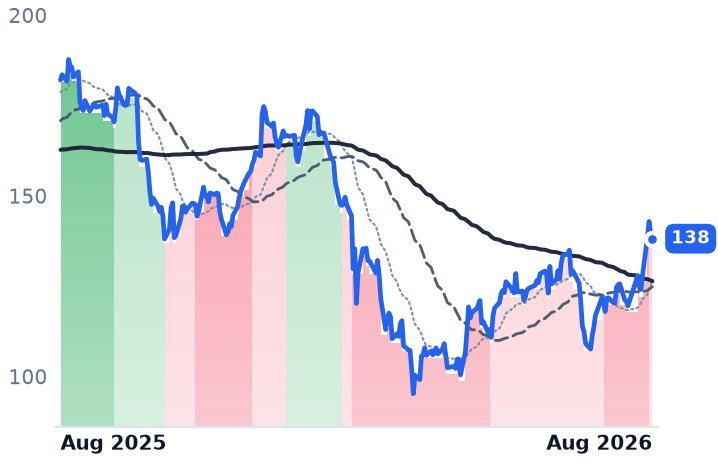
BX | Blackstone | Alternative & Private Capital | 🔴 Cont. Bear | +12.5% | −18.8% |
KKR | KKR | Alternative & Private Capital | 🔴 Cont. Bear | +10.8% | −27.0% |
APO | Apollo Global Management | Alternative & Private Capital | 🔴 Cont. Bear | +8.3% | −8.2% |
ARES | Ares Management | Alternative & Private Capital | 🔴 Cont. Bear | +17.1% | −24.1% |
CG | The Carlyle | Alternative & Private Capital | ⚠️ Emerging Bear | +13.5% | −19.1% |
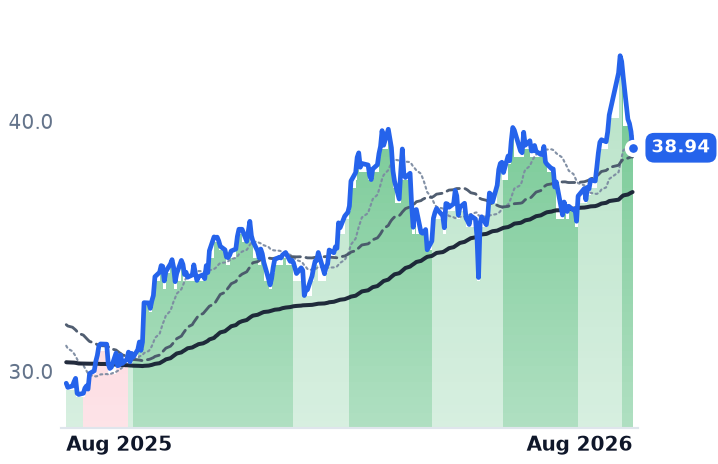
GS | The Goldman Sachs | Bulge Bracket Investment Banks | 🟢 Cont. Bull | +0.3% | +45.7% |
MS | Morgan Stanley | Bulge Bracket Investment Banks | 🟢 Cont. Bull | −2.0% | +54.3% |
HASI | HA Sustainable Infrastructure Capital | Financial - Diversified | 🟢 Cont. Bull | +2.2% | +62.9% |
BIP | Brookfield Infrastructure Partners | Infrastructure & Transport Conglomerates | 🟢 Cont. Bull | +4.2% | +31.9% |
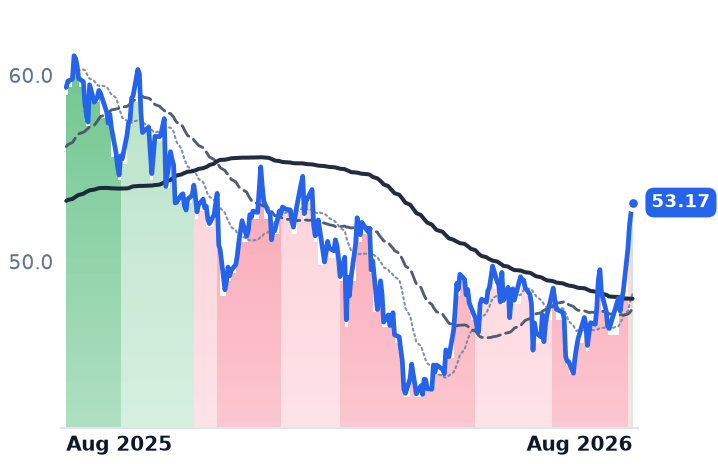
BAM | Brookfield Asset Management | Real Estate & Infrastructure | 🔴 Cont. Bear | +16.9% | −10.4% |
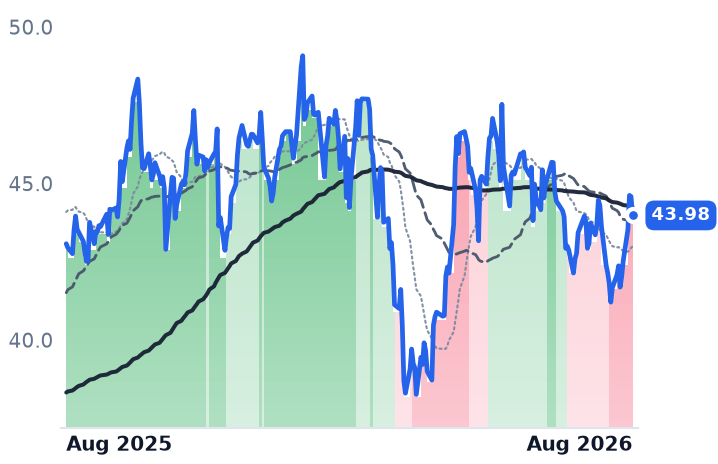
BN | Brookfield | Real Estate & Infrastructure | ⚠️ Emerging Bear | +2.4% | +2.1% |
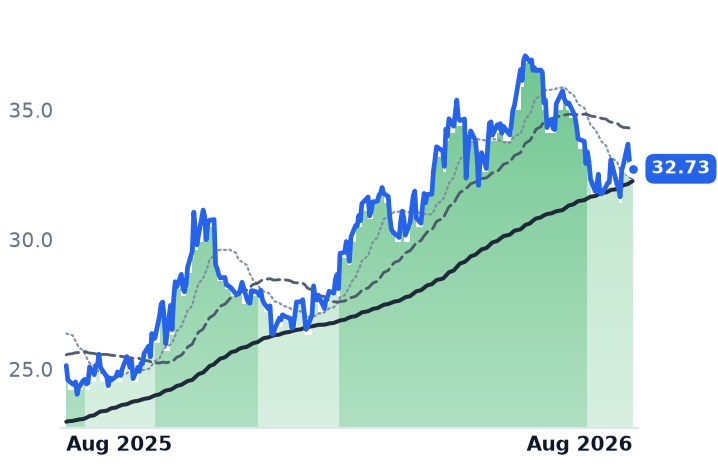
BEP | Brookfield Renewable Partners | Diversified Renewable Generators | 🟢 Cont. Bull | −1.9% | +30.2% |
BEPC | Brookfield Renewable | Diversified Renewable Generators | ⚠️ Emerging Bear | −7.2% | −0.0% |
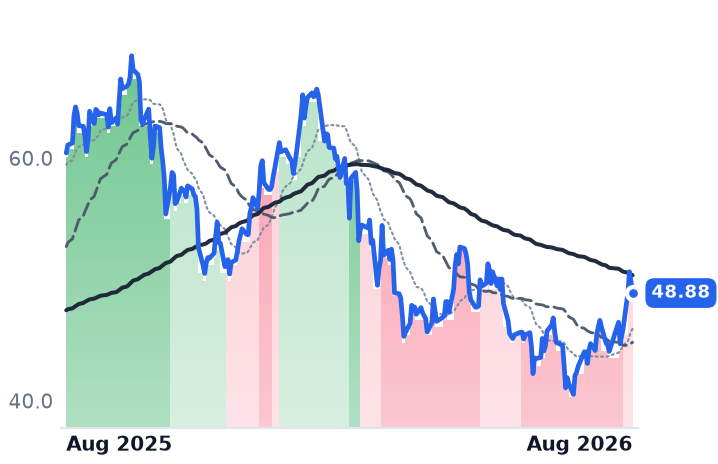
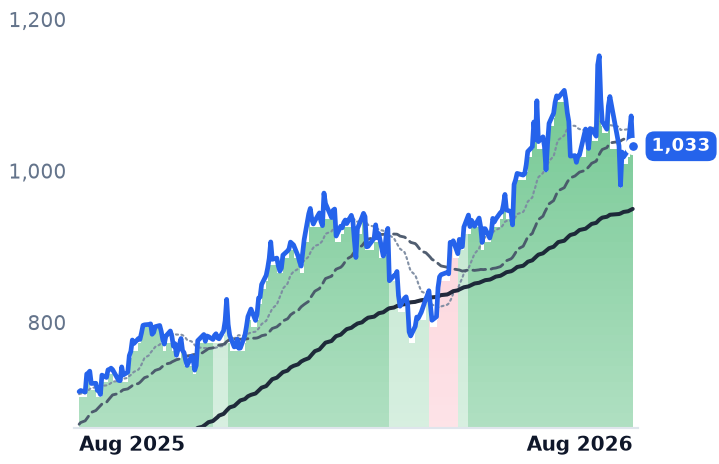
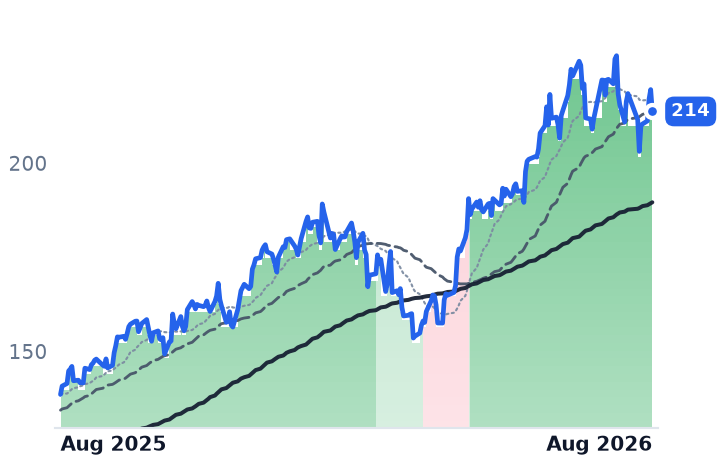
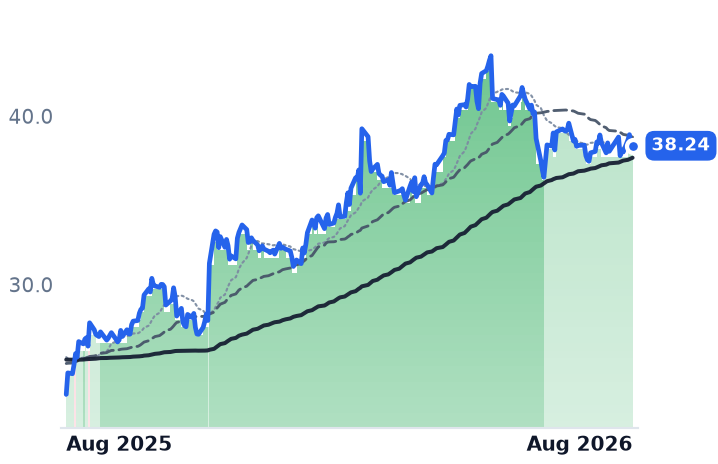
12-month price & trend
| Ticker | Mkt cap | P/E | P/E fwd | P/S | P/S fwd | P/GP | P/GP fwd | EV/EBITDA | FCF yld |
|---|---|---|---|---|---|---|---|---|---|
BX | $161.2B | 29.7x | 22.5x | 10.0x | 11.0x | 11.3x | 12.4x | 20.5x | 1.6% |
KKR | $92.8B | 30.8x | 16.6x | 4.4x | 8.8x | 9.5x | 18.9x | 14.1x | 7.0% |
APO | $73.7B | 28.2x | 14.5x | 2.2x | 3.2x | 2.5x | 3.6x | 5.3x | 8.1% |
| Ticker | Mkt cap | P/E | P/E fwd | P/S | P/S fwd | P/GP | P/GP fwd | EV/EBITDA | FCF yld |
|---|---|---|---|---|---|---|---|---|---|
ARES | $45.4B | 60.3x | 23.5x | 7.1x | 8.0x | 11.3x | 12.8x | 18.4x | 1.8% |
CG | $17.6B | 48.3x | 13.6x | 4.5x | 4.7x | 6.4x | 6.7x | 35.6x | -5.2% |
GS | $304.6B | 15.7x | 14.8x | 2.6x | 4.3x | 4.5x | 7.5x | 17.7x | -13.6% |
| Ticker | Mkt cap | P/E | P/E fwd | P/S | P/S fwd | P/GP | P/GP fwd | EV/EBITDA | FCF yld |
|---|---|---|---|---|---|---|---|---|---|
MS | $337.1B | 17.2x | 16.6x | 2.7x | 4.1x | 4.5x | 6.9x | 23.9x | -7.0% |
HASI | $4.9B | 57.9x | 12.8x | 0.0x | 10.5x | n/m | 37.9x | 23.4x | 4.9% |
BIP | $17.9B | 54.3x | 35.9x | 0.7x | 1.4x | 2.6x | 5.3x | 6.8x | -3.2% |
| Ticker | Mkt cap | P/E | P/E fwd | P/S | P/S fwd | P/GP | P/GP fwd | EV/EBITDA | FCF yld |
|---|---|---|---|---|---|---|---|---|---|
BAM | $84.9B | 30.4x | 28.9x | 15.5x | 13.9x | 19.3x | 17.3x | 27.5x | 2.7% |
BN | $98.2B | 83.1x | 16.0x | 1.3x | 12.9x | 3.7x | 36.6x | 10.4x | -7.4% |
BEP | $10.5B | 54.3x | — | 1.7x | 1.5x | 7.0x | 6.1x | 9.6x | -48.1% |
| Ticker | Mkt cap | P/E | P/E fwd | P/S | P/S fwd | P/GP | P/GP fwd | EV/EBITDA | FCF yld |
|---|---|---|---|---|---|---|---|---|---|
BEPC | $5.3B | n/m | — | 1.3x | 0.8x | 2.7x | 1.7x | 44.9x | -13.9% |
Valuation & fundamentals
Consensus projections
| Ticker | FY2026E | FY2027E | FY2028E | |
|---|---|---|---|---|
BX | Revenue | +15.0% | +24.4% | +4.9% |
| EPS | +10.7% | +25.2% | +10.8% | |
KKR | Revenue | +33.9% | +17.8% | +32.9% |
| EPS | +26.0% | +18.0% | +15.7% | |
APO | Revenue | +27.3% | +16.0% | +13.9% |
| EPS | +10.8% | +21.4% | +16.1% | |
ARES | Revenue | +22.9% | +19.5% | +9.3% |
| EPS | +17.7% | +23.8% | +17.7% | |
CG | Revenue | −1.7% | +36.3% | +9.0% |
| EPS | −10.1% | +41.6% | +15.4% | |
GS | Revenue | +20.6% | +2.7% | +1.8% |
| EPS | +42.8% | +4.7% | +5.3% | |
MS | Revenue | +16.6% | +5.5% | +5.6% |
| EPS | +30.4% | +5.9% | +8.1% | |
HASI | Revenue | +18.8% | +11.2% | +14.0% |
| EPS | +10.5% | +10.9% | +8.9% | |
BIP | Revenue | +61.2% | −25.6% | +8.1% |
| EPS | +2.1% | +38.8% | −2.9% | |
BAM | Revenue | +12.2% | +16.1% | +12.9% |
| EPS | +12.9% | +17.8% | +16.8% | |
BN | Revenue | −6.8% | +21.4% | +21.7% |
| EPS | +13.2% | +23.7% | +15.4% | |
BEP | Revenue | +8.3% | +11.0% | +0.9% |
| EPS | +22.8% | −18.4% | −12.6% | |
BEPC | Revenue | +13.3% | +16.7% | +7.6% |
| EPS | −27.1% | −1.1% | −72.0% |
Forward fiscal years only. Blank means no analyst coverage for that year.
The financial firms that actually write the checks behind the AI data-center boom — private-equity shops structuring loans against Nvidia chips, banks arranging multibillion-dollar leases, and infrastructure funds building the power and fiber underneath — just finished reporting second-quarter earnings, and the numbers largely back up this month's rally rather than explaining it away as chart noise. Six of the group's largest names posted record or near-record fee income and fundraising in late July and early August, with named, dated financing deals tied directly to the AI buildout. But one member, Brookfield Corporation, moved the opposite direction on the chart even as its own asset-management subsidiary reported a record quarter — a split that looks more like a timing gap than a credit problem.
The private-credit and buyout core. Blackstone (BX), the world's largest alternative-asset manager, reported $1.8 billion of fee-related earnings (FRE) — the recurring management fees that anchor its valuation — up 22% year over year, on record assets under management (AUM) of $1.35 trillion. Its infrastructure arm grew AUM 40% to $90 billion, and its data-center platform, built around the QTS operator it owns, was marked at $185 billion, up from $130 billion at the start of the year; in July it also detailed a $35 billion financing platform with Broadcom for a gigawatt of AI compute. KKR (KKR) posted FRE of $1.32 per share, up 34%, with a 70% margin for a tenth straight quarter above 65%, and raised a record $133 billion over the trailing year; in June it launched Helix, a $10 billion-plus AI-infrastructure vehicle backed by Nvidia and power producer Vistra, though management flagged that financing spreads on the largest hyperscaler deals have begun widening. Apollo Global Management (APO), which pairs private credit with an insurance balance sheet, grew FRE 25% to $785 million on record quarterly origination of roughly $74 billion, and is one of two lenders, with Blackstone, behind a $35 billion loan to buy custom AI chips for Anthropic and lease them back — the largest private-credit financing ever completed. Ares Management (ARES) grew FRE 20% to $491 million on record fundraising of $36 billion, with direct-lending non-accruals still under 2%, while building Ada Infrastructure, a seven-campus, roughly one-gigawatt data-center platform. Carlyle Group (CG) reported record FRE of $358 million, up 11%, with capital-markets fees more than doubling to $111 million.
The banks. Goldman Sachs (GS) and Morgan Stanley (MS) both posted record revenue, $20.3 billion and $21.3 billion, with Goldman's equities revenue up 86% on Asia financing activity and Morgan Stanley's investment-banking revenue up 58%. Morgan Stanley raised its 2026 data-center capex forecast to $850 billion from $575 billion and 2027 to $1.3 trillion from $700 billion, positioning itself as an intermediary rather than a direct lender. Goldman flagged its supplementary leverage ratio, a regulatory capital limit, as the binding constraint on how much more financing it can carry.
The yield and infrastructure names. HA Sustainable Infrastructure Capital (HASI), a specialty lender to renewable and efficiency projects, and Brookfield Infrastructure Partners (BIP), which owns toll-like assets including data centers and fiber, sit at the more bond-like end of the group. BIP's data-segment funds from operations grew 36% on a bulk fiber network and an Intel Arizona chip-plant partnership, and it spun off a U.S. data-center unit in an IPO that raised roughly $1.2 billion while retaining 64% ownership.
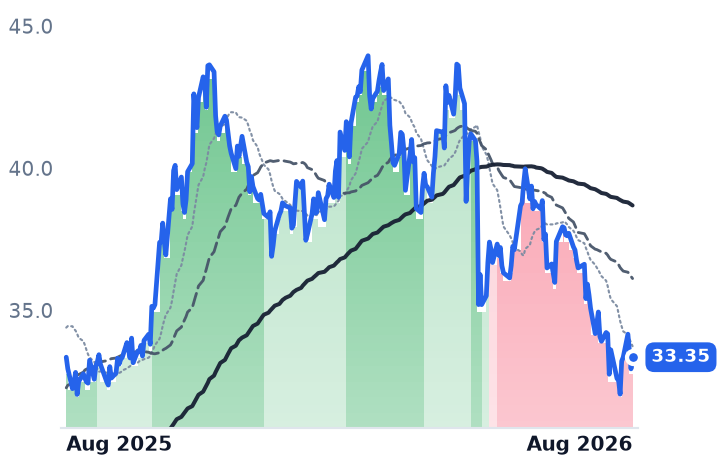
The Brookfield divergence. Brookfield Corporation (BN), the holding company atop Brookfield's fund complex, has broken from a mild uptrend into a strong downtrend across every horizon out to a year, and its renewable arms, Brookfield Renewable Corp (BEPC) and Brookfield Renewable Partners (BEP), have stepped down from strong uptrends over the same period. That looks like sequencing rather than deterioration: BN does not report second-quarter results until August 13, after Morgan Stanley cut its price target to $59 from $61 in July citing real-estate-heavy exposure, while every other name in the group had already reported and re-rated. Brookfield Asset Management (BAM), BN's own fee-generating subsidiary, grew FRE 20% to $808 million with record $77 billion fundraising in the same window, including a new $10 billion AI infrastructure fund — evidence against the idea that Brookfield's AI-financing book itself is weakening.
None of this is a rate-cut trade. The Federal Reserve held its benchmark rate at 3.50%-3.75% at its July 29 meeting, and futures on August 4 priced better-than-60% odds of a hike, not a cut, at the September meeting.
What's unresolved. Moody's has flagged roughly $662 billion of hyperscaler data-center lease commitments signed but not yet begun paying on. Apollo's own economists note that $5 trillion of planned AI capex would require $1.5-2 trillion of annual AI revenue by 2030, against only $40-60 billion generated today. And GPU-backed loans such as CoreWeave's facility reportedly lean on informal residual-value support from Nvidia rather than independently appraised collateral — an assumption untested by a downturn. None of this shows up yet in reported credit metrics, but it's the risk this group is being paid to carry.
On valuation, most alt managers show large gaps between trailing and forward multiples — KKR 30.8x trailing versus 16.6x forward, Carlyle 48.3x versus 13.6x, Ares 60.3x versus 23.5x — implying consensus expects current fee growth to hold rather than a fully priced move. Goldman and Morgan Stanley show little compression (14.8x and 16.6x forward) because both already re-rated over the past year, up 42% and 51%. Brookfield Infrastructure remains the least compressed, at 35.9x forward funds from operations.
On the tape itself, the group's one-month move is not evenly shared: 30-day returns range from -8.9% in Brookfield Renewable Corp to +13.4% in Ares, averaging closer to 3-4%. The alt managers and banks are rallying despite a rough trailing year for several (Ares -27%, KKR -28.5%, Carlyle -22.3%), a stretch Goldman, Morgan Stanley and HASI outran (+42.5%, +51.3%, +56.5%). Only Brookfield's holding company and its renewable arms are breaking down, on earnings that haven't printed yet.
The setup
Where it stands — Alt-managers and banks rallied on record fee income and named AI-financing deals; Brookfield's parent diverged into a downtrend ahead of its own earnings. Would confirm — BN's August 13 results show fee-related and distributable-earnings growth near BAM's 15-20% pace, not a real-estate-driven NAV markdown. Would invalidate — BN discloses leverage or NAV deterioration tied specifically to its data-center or AI-financing exposure, not just real estate or sector rotation. Watch next — Brookfield Corporation's Q2 2026 earnings call, August 13, 2026. Valuation — Alt managers trade near 15-24x forward earnings versus 30-60x trailing; BN's forward P/E is 16x versus an 83x trailing figure distorted by thin GAAP margins.