

Gas Pipeline Stocks Rallied 23% on Data-Center Demand — but the Reasons Diverge
Hypothesis Opus 5 · Research Sonnet 5 · Writing Sonnet 5 · Prompt v1.1
Ten natural-gas pipeline and processing companies gained an average of 23% over the past year on real, contracted demand growth from power plants and LNG exporters — but the rally splits into cheap cash generators and richly priced growth bets, and the cohort's biggest winner is really an oil story.
| Ticker | Company | Segment | Trend | 30D | 1Y |
|---|---|---|---|---|---|
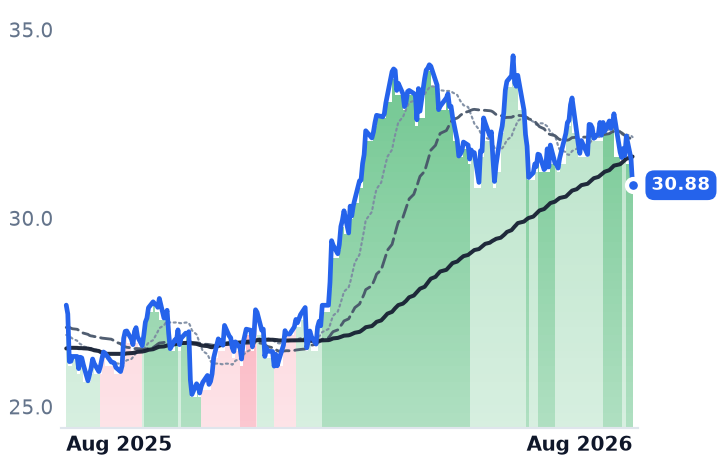
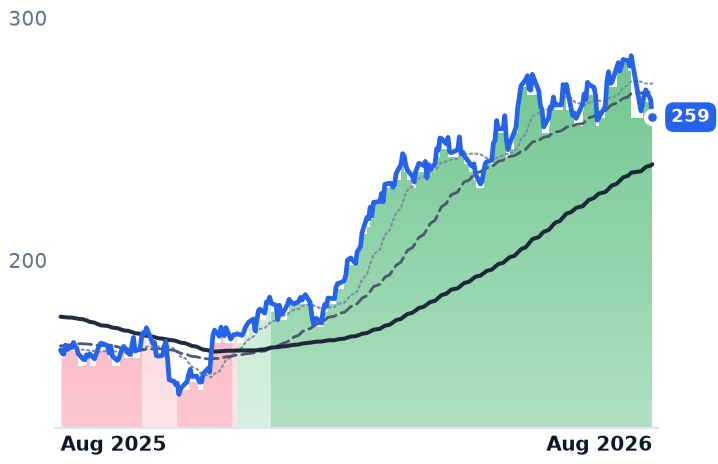
KMI | Kinder Morgan | Natural Gas Pipelines & Transmission | 🟢 Cont. Bull | −2.6% | +11.5% |
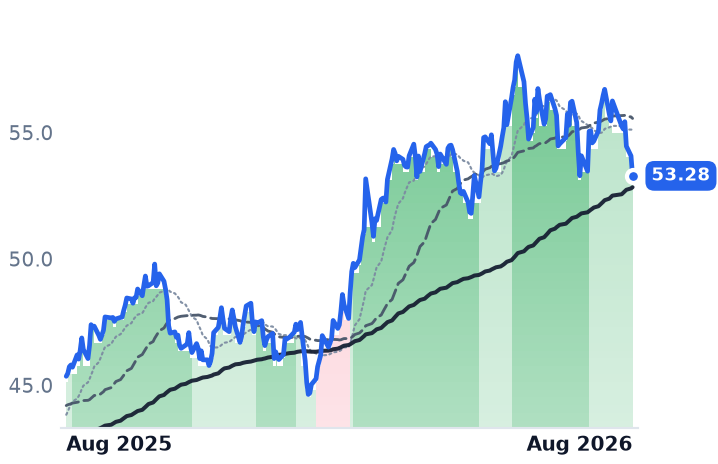
ENB | Enbridge | Natural Gas Pipelines & Transmission | 🟢 Cont. Bull | −0.3% | +17.5% |
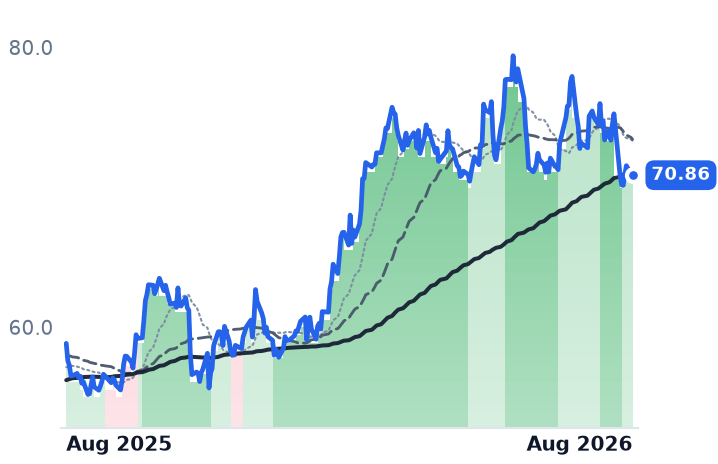
WMB | The Williams Companies | Natural Gas Pipelines & Transmission | 🟢 Cont. Bull | −2.7% | +20.4% |
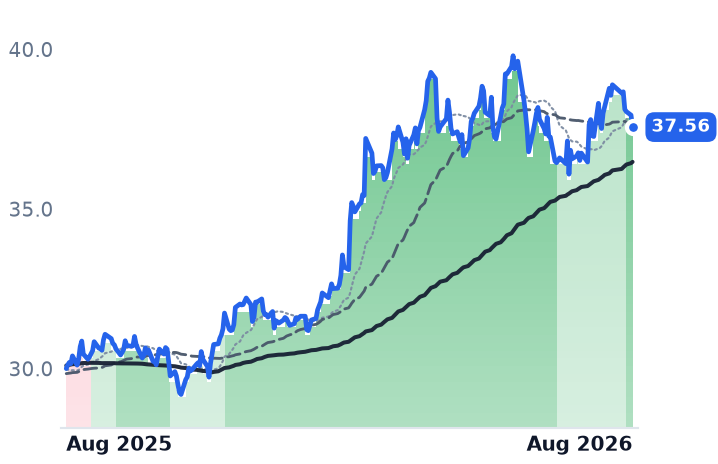
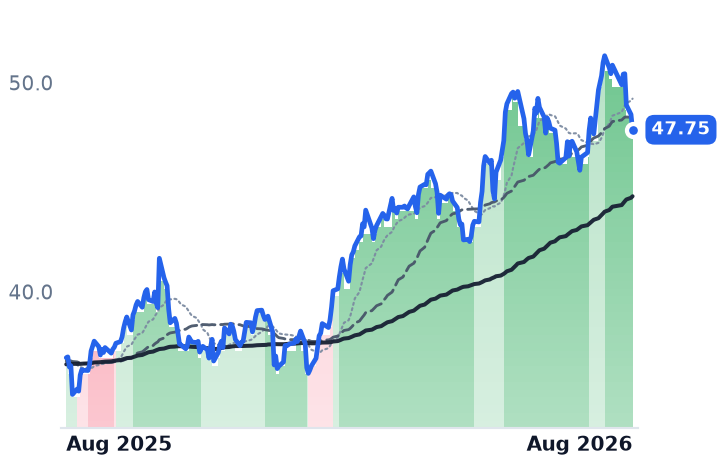
EPD | Enterprise Products Partners | Crude Oil & NGL Pipelines | 🟢 Cont. Bull | +3.0% | +25.2% |
ET | Energy Transfer | Natural Gas Pipelines & Transmission | 🌱 Emerging Bull | +6.9% | +22.5% |
TRP | TC Energy | Natural Gas Pipelines & Transmission | 🟢 Cont. Bull | −1.7% | +37.0% |
MPLX | MPLX | Natural Gas Gathering & Processing | 🟢 Cont. Bull | +3.7% | +18.9% |
OKE | ONEOK | Natural Gas Gathering & Processing | 🌱 Emerging Bull | −2.6% | +9.9% |
TRGP | Targa Resources | Natural Gas Gathering & Processing | 🟢 Cont. Bull | −1.7% | +59.0% |
PBA | Pembina Pipeline | Crude Oil & NGL Pipelines | 🟢 Cont. Bull | +2.3% | +29.6% |
EQT | EQT | Appalachian Shale Gas | ⚠️ Emerging Bear | +2.9% | +3.5% |
EXE | Expand Energy | Appalachian Shale Gas | ⚠️ Emerging Bear | +6.7% | −3.3% |
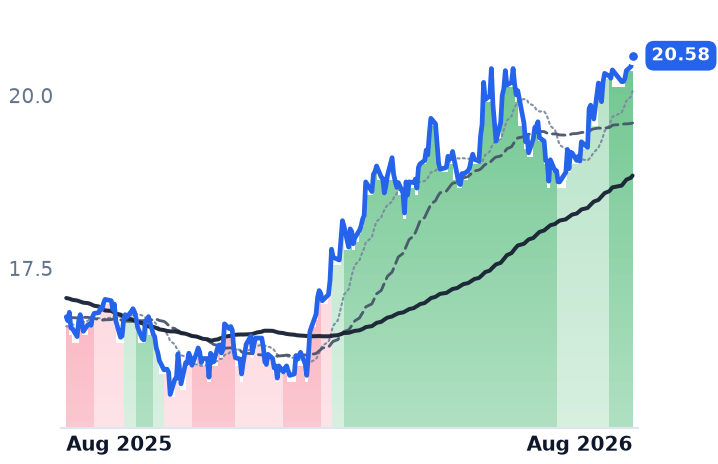
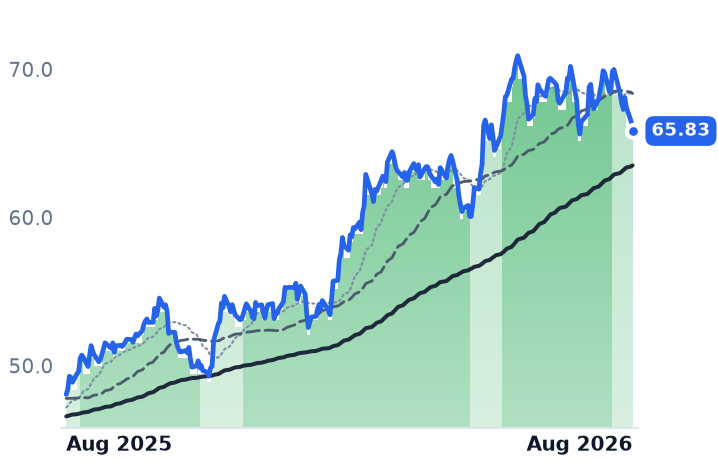
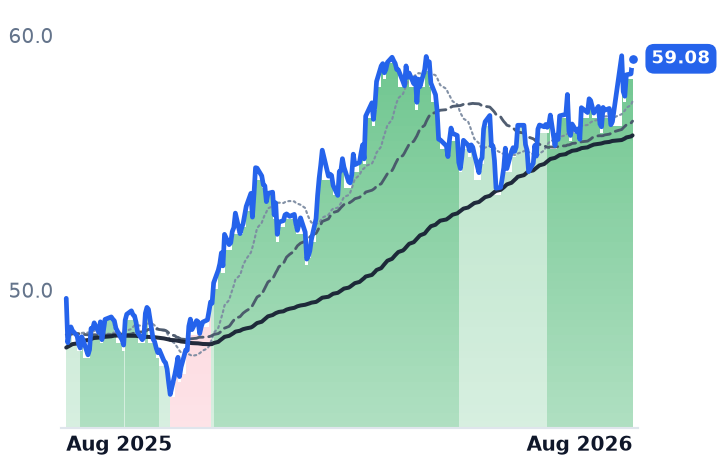
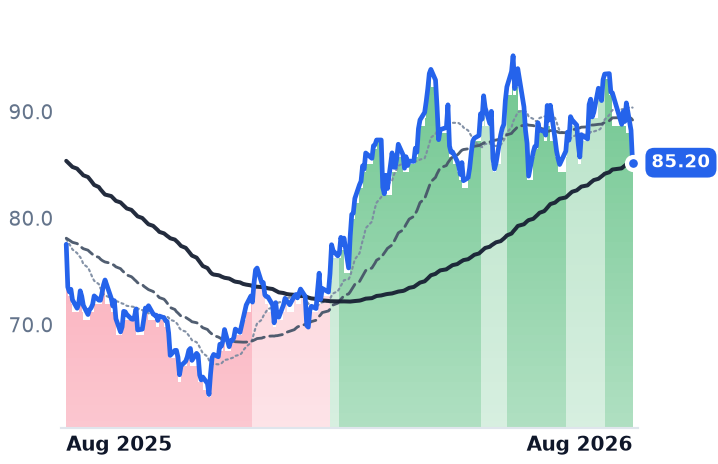
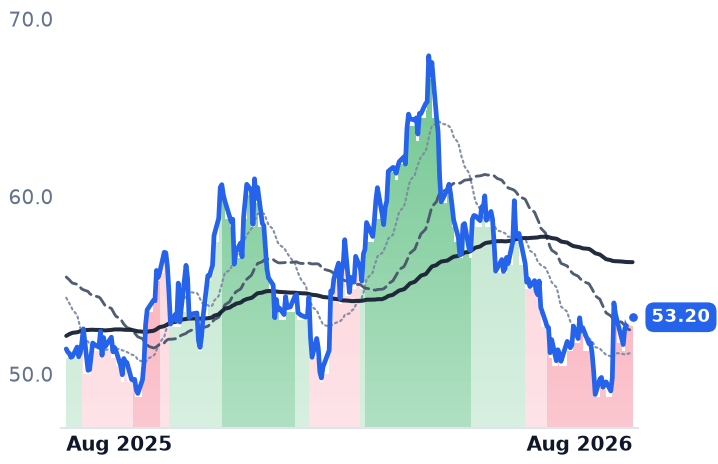
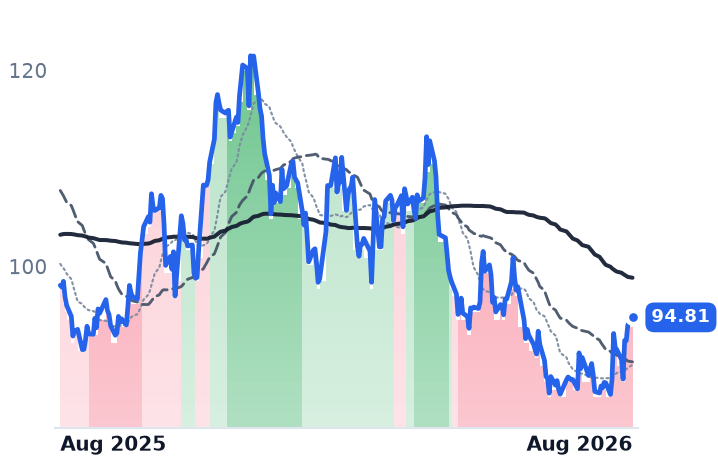
12-month price & trend
| Ticker | Mkt cap | P/E | P/E fwd | P/S | P/S fwd | P/GP | P/GP fwd | EV/EBITDA | FCF yld |
|---|---|---|---|---|---|---|---|---|---|
KMI | $68.8B | 19.8x | 20.4x | 3.8x | 3.8x | 6.9x | 6.9x | 12.5x | 5.6% |
ENB | $116.4B | 25.0x | 18.1x | 1.7x | 1.6x | 6.0x | 5.7x | 12.9x | 1.5% |
WMB | $86.7B | 28.1x | 29.8x | 7.1x | 7.1x | 9.6x | 9.6x | 15.7x | -0.2% |
| Ticker | Mkt cap | P/E | P/E fwd | P/S | P/S fwd | P/GP | P/GP fwd | EV/EBITDA | FCF yld |
|---|---|---|---|---|---|---|---|---|---|
EPD | $81.3B | 13.0x | 12.9x | 1.4x | 1.4x | 10.6x | 10.6x | 7.7x | 1.8% |
ET | $70.8B | 12.6x | 13.8x | 0.7x | 0.7x | 2.9x | 2.9x | 10.2x | 5.2% |
TRP | $68.5B | 27.8x | 17.5x | 6.0x | 4.2x | 11.7x | 8.2x | 14.1x | 4.2% |
| Ticker | Mkt cap | P/E | P/E fwd | P/S | P/S fwd | P/GP | P/GP fwd | EV/EBITDA | FCF yld |
|---|---|---|---|---|---|---|---|---|---|
MPLX | $60.0B | 22.0x | 13.8x | 4.6x | 4.7x | 8.8x | 9.0x | 8.7x | 9.7% |
OKE | $53.7B | 15.2x | 15.0x | 1.5x | 1.4x | 6.9x | 6.4x | 11.1x | 4.2% |
TRGP | $55.6B | 26.3x | 23.8x | 3.4x | 2.8x | 9.3x | 7.7x | 15.0x | 0.5% |
| Ticker | Mkt cap | P/E | P/E fwd | P/S | P/S fwd | P/GP | P/GP fwd | EV/EBITDA | FCF yld |
|---|---|---|---|---|---|---|---|---|---|
PBA | $27.8B | 23.7x | 15.2x | 5.0x | 3.2x | 13.4x | 8.6x | 14.1x | 5.3% |
EQT | $33.3B | 11.7x | 12.6x | 3.6x | 3.5x | 5.3x | 5.1x | 6.3x | 11.3% |
EXE | $22.0B | 8.1x | 10.4x | 1.6x | 1.6x | 2.5x | 2.5x | 3.8x | 11.6% |
Valuation & fundamentals
Consensus projections
| Ticker | FY2026E | FY2027E | FY2028E | |
|---|---|---|---|---|
KMI | Revenue | +8.2% | +1.9% | +5.8% |
| EPS | +18.1% | +0.8% | +8.6% | |
ENB | Revenue | +21.8% | −7.4% | +3.6% |
| EPS | +0.5% | +11.8% | +10.3% | |
WMB | Revenue | +6.9% | +10.5% | +12.4% |
| EPS | +12.2% | +5.0% | +21.7% | |
EPD | Revenue | +12.8% | +5.4% | +5.7% |
| EPS | +11.6% | +9.6% | +8.3% | |
ET | Revenue | +33.3% | +2.1% | +4.4% |
| EPS | +11.0% | +6.5% | +6.5% | |
TRP | Revenue | +6.7% | +4.4% | +5.3% |
| EPS | +7.3% | +5.4% | +6.2% | |
MPLX | Revenue | −1.3% | +6.7% | +5.1% |
| EPS | −7.6% | +12.5% | +7.2% | |
OKE | Revenue | +13.9% | −2.2% | +1.4% |
| EPS | +5.3% | +9.2% | +11.2% | |
TRGP | Revenue | +16.8% | +16.2% | +10.1% |
| EPS | +27.5% | +14.5% | +17.8% | |
PBA | Revenue | +10.9% | +4.2% | +4.6% |
| EPS | +17.4% | +2.2% | +5.3% | |
EQT | Revenue | +12.9% | −0.5% | +9.5% |
| EPS | +43.8% | −5.2% | +31.6% | |
EXE | Revenue | +17.6% | −3.0% | +5.6% |
| EPS | +51.5% | −4.6% | +14.3% |
Forward fiscal years only. Blank means no analyst coverage for that year.
What happened
Ten companies that move, process and export natural gas — pipelines, gathering systems and liquids processors — gained an average of roughly 23% over the past twelve months, a period in which the price of the gas itself barely moved. The gain looks uniform on a chart. It isn't. Underneath, one group is growing cash flow per share while trading at some of its cheapest multiples in years; another is growing just as fast but paying up for it; and the single best-performing name in the group owes most of its growth to oil-linked liquids economics, not gas at all.
The businesses, and what's actually driving them
Kinder Morgan (KMI), which operates the largest U.S. natural-gas pipeline network and moves roughly 40% of the gas the country consumes, raised full-year guidance after adjusted EBITDA grew 12% and earnings per share 32% in the second quarter. It has taken final investment decisions — not just announced intentions — on the $1.7 billion Trident pipeline serving Gulf Coast LNG terminals and the $1.4 billion Mississippi Crossing project, both backed by binding long-term transportation contracts. Its Haynesville gathering volumes rose 26% year over year, with one system up 54%, while net debt fell to 3.6 times EBITDA from 3.8 times. The stock trades at 20.4 times forward earnings, roughly flat with trailing — a modest re-rating, not a stretch.
Williams (WMB), which owns the Transco pipeline running gas from the Gulf Coast to the Northeast, is in advanced talks on a $5.5 billion purchase of gathering assets serving ten LNG plants and 26 power plants, and its 556-megawatt Socrates power project is on schedule to enter service in the second half of 2026. The growth story is real. But Williams is also the most expensive name in the group — 15.7 times trailing enterprise value to EBITDA, a forward earnings multiple that expanded from 28 to nearly 30 times, and a trailing free-cash-flow yield that is slightly negative, meaning current spending is outrunning cash generation.
Enterprise Products Partners (EPD), a Houston-based pipeline and natural-gas-liquids operator, and MPLX, a processing partnership majority-owned by Marathon Petroleum, sit at the opposite end. Enterprise trades at 7.7 times EV/EBITDA and 13 times earnings, the cheapest in the group, with leverage flat at its target. MPLX's forward earnings multiple has compressed to 13.8 times from 22 times trailing, with a 9.7% trailing free-cash-flow yield, the highest of the ten. Both raised distributions on real cash generation rather than unit issuance. Enterprise did flag that roughly $200 million of its second-quarter EBITDA beat came from a commodity-demand spike management called non-recurring.
TC Energy (TRP), a Canadian pipeline operator, and Enbridge (ENB), which runs Canada's Mainline crude system alongside a growing gas-utility business, both point to a $20 billion-plus secured project backlog and describe rising data-center and power-generation demand as the driver — TC Energy now expects 15 billion cubic feet a day of incremental U.S. gas demand from data centers alone by 2035. Energy Transfer (ET), a diversified pipeline and terminal operator, posted revenue up 78% and net income up 90%, a scale of growth that outpaces organic volumes and points to recent acquisitions doing much of the work rather than pure throughput growth.
Then there's Targa Resources (TRGP), a Permian Basin gas processor and natural-gas-liquids exporter, which gained 61.6% over the year — the largest move in the group — after raising 2026 EBITDA guidance 17%. But management credited the growth to Permian production gathering and LPG export/marketing economics — oil-directed associated gas and NGL spreads, not Henry Hub demand. Targa also carries the second-richest EV/EBITDA multiple in the group at 15 times. Oneok (OKE), still digesting last year's Magellan and EnLink acquisitions, and Pembina (PBA), a Canadian pipeline and liquids company, gained 10.5% and 30% respectively; neither had sufficient fundamental data available here to confirm whether their moves are earnings-led.
Does the tape agree?
Over the trailing seven weeks, the group's trend signals diverged rather than confirmed uniformly: Targa and MPLX held unbroken strong uptrends, Kinder Morgan ended one after a late-July wobble, but Enbridge, TC Energy and Williams all softened from strong to milder uptrends in the final days of the window. That's a cohort with internal disagreement, not a single strengthening signal.
Is upstream distress actually showing up downstream?
The hypothesis that gas producers' pain is reaching pipeline volumes doesn't hold up yet. EQT Corporation, an Appalachian gas producer trading in a confirmed downtrend, sits at just 6.3 times EV/EBITDA with consensus still projecting 12.9% revenue growth next year — equity multiples are compressing on weak gas prices, but volumes aren't collapsing. Expand Energy (EXE), the Chesapeake-Southwestern merger entity, shows similarly cheap multiples and volatile but still-growing revenue estimates. Wider coverage frames the pipeline group broadly as the beneficiary of AI-driven power and LNG-export demand, consistent with what the contracted backlogs show.
The setup
Where it stands — Pipeline stocks are up 23% on real, contracted demand growth, but valuations and trend signals now split the group into cheap cash generators and pricier growth bets. Would confirm — Williams' and Targa's free cash flow turns positive as FID'd projects (Socrates, Trident, Mississippi Crossing) enter service on schedule in 2026-2029. Would invalidate — Kinder Morgan's or Williams' gathering/transport volumes decline year over year for two straight quarters, signaling upstream weakness reaching the pipes. Watch next — South System Expansion 4's first phase in-service target, Q4 2028, and Williams' Socrates power project entering service in the second half of 2026. Valuation — Enterprise trades at 7.7x EV/EBITDA and MPLX at 13.8x forward earnings, both below cohort peers; Williams at 15.7x EV/EBITDA is the group's richest.