

Data-Center Gas Demand Lifts Pipelines and Compressors, Bypasses Cheap Drillers
Hypothesis Opus 5 · Research Sonnet 5 · Writing Sonnet 5 · Prompt v1.1
Pipeline operators and gas-compression firms have re-rated on real, contracted data-center and power-plant gas deals, while six Appalachian gas producers — despite beating earnings and raising production guidance — trade at a fraction of the multiple, marked down on a soft 2026-27 price forecast rather than their own results.
| Ticker | Company | Segment | Trend | 30D | 1Y |
|---|---|---|---|---|---|
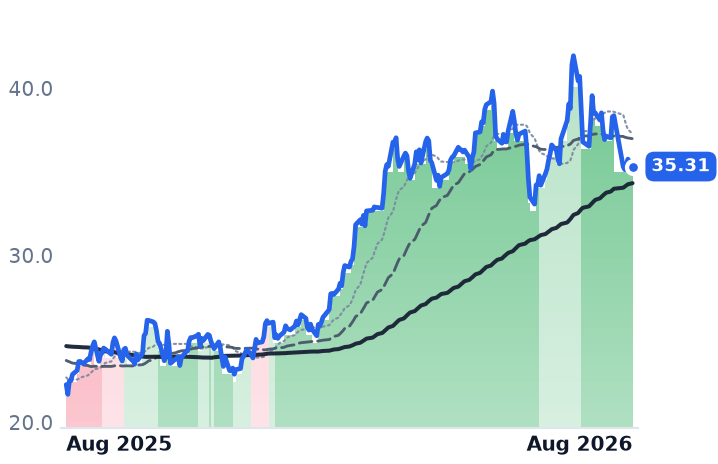
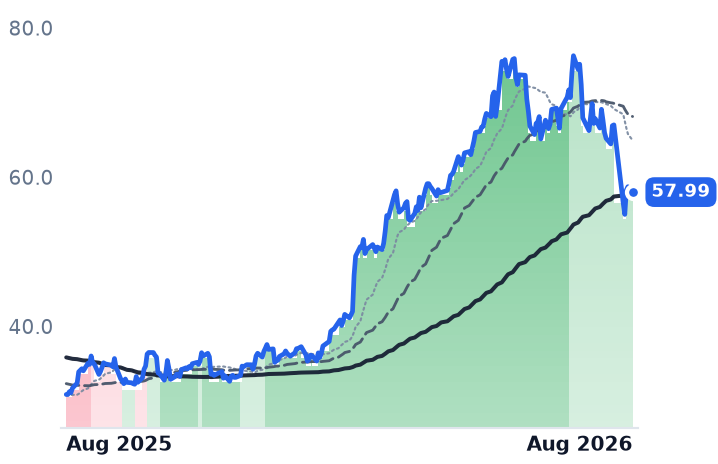
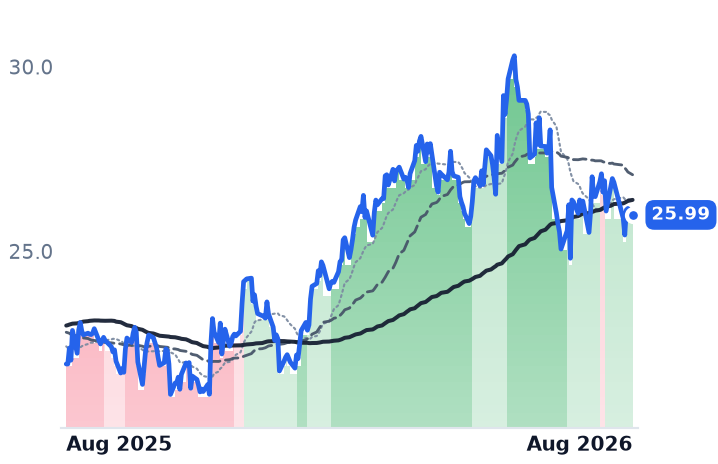
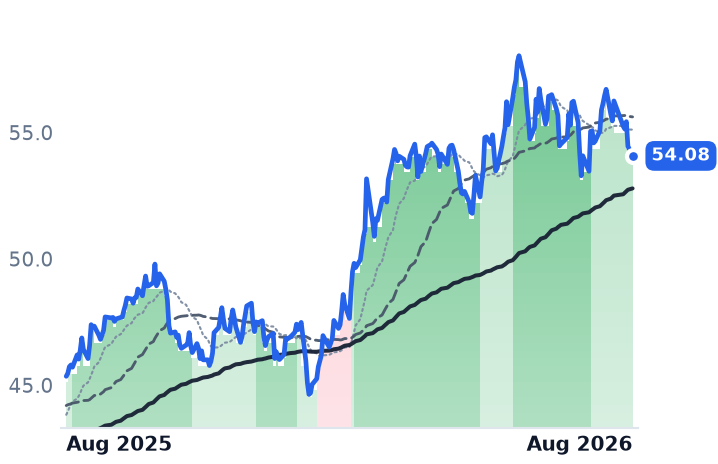
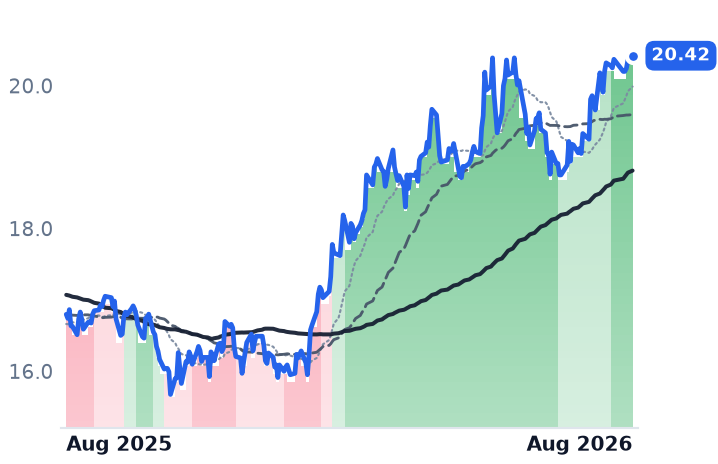
AROC | Archrock | Compression & Gas Processing | 🟢 Cont. Bull | −3.3% | +58.6% |
KGS | Kodiak Gas Services | Compression & Gas Processing | 🟢 Cont. Bull | −12.4% | +87.9% |
USAC | USA Compression Partners | Compression & Gas Processing | 🟢 Cont. Bull | +1.9% | +18.4% |
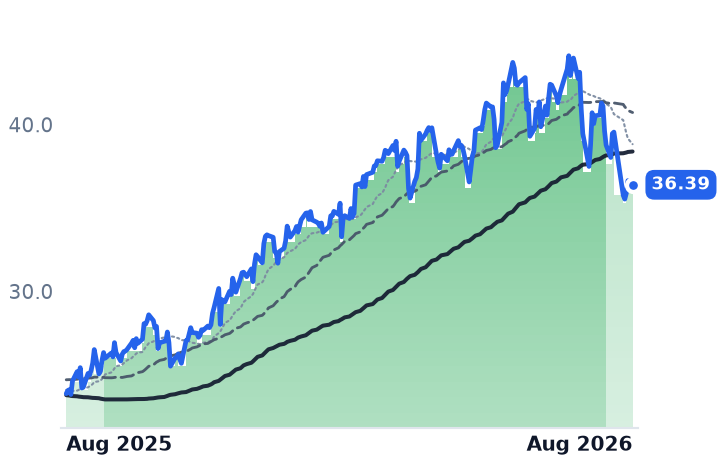
NGS | Natural Gas Services | Compression & Gas Processing | 🟢 Cont. Bull | −2.9% | +52.5% |
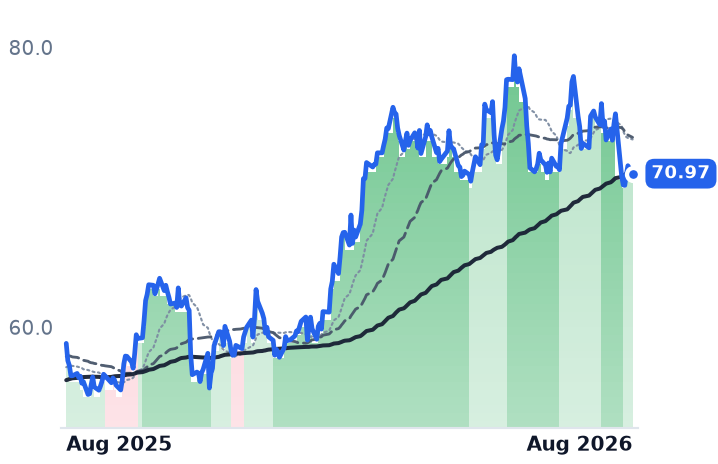
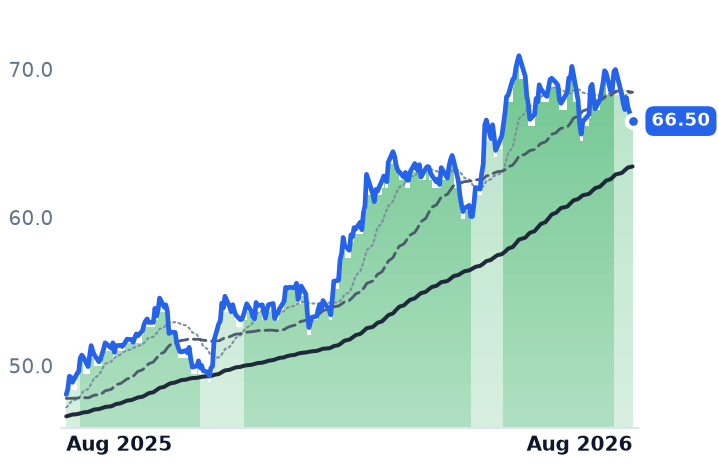
ENB | Enbridge | Natural Gas Pipelines & Transmission | 🟢 Cont. Bull | +1.1% | +19.2% |
WMB | The Williams Companies | Natural Gas Pipelines & Transmission | 🟢 Cont. Bull | −2.5% | +20.6% |
EPD | Enterprise Products Partners | Crude Oil & NGL Pipelines | 🟢 Cont. Bull | +4.0% | +26.5% |
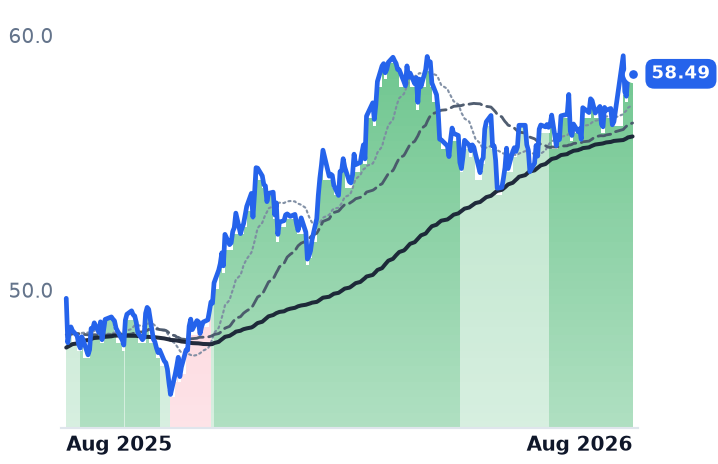
KMI | Kinder Morgan | Natural Gas Pipelines & Transmission | 🟢 Cont. Bull | −0.3% | +14.0% |
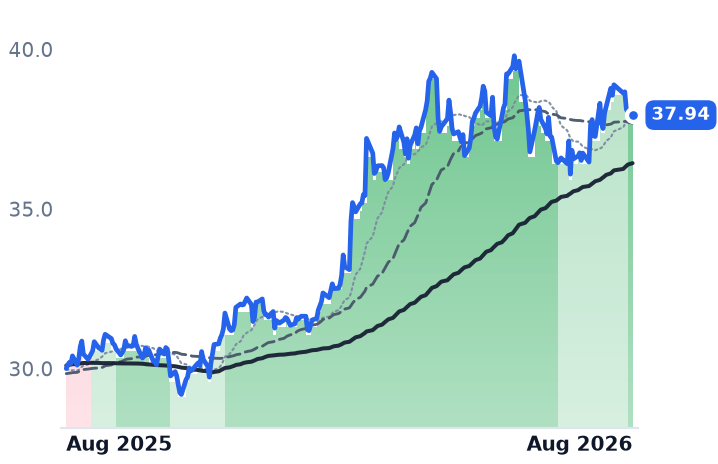
ET | Energy Transfer | Natural Gas Pipelines & Transmission | 🌱 Emerging Bull | +6.1% | +21.6% |
TRP | TC Energy | Natural Gas Pipelines & Transmission | 🟢 Cont. Bull | −0.7% | +38.4% |
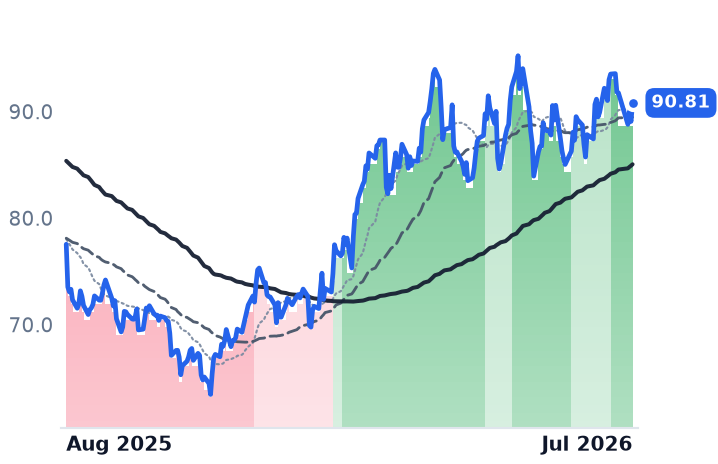
MPLX | MPLX | Natural Gas Gathering & Processing | 🟢 Cont. Bull | +2.7% | +17.7% |
OKE | ONEOK | Natural Gas Gathering & Processing | 🌱 Emerging Bull | +3.9% | +17.1% |
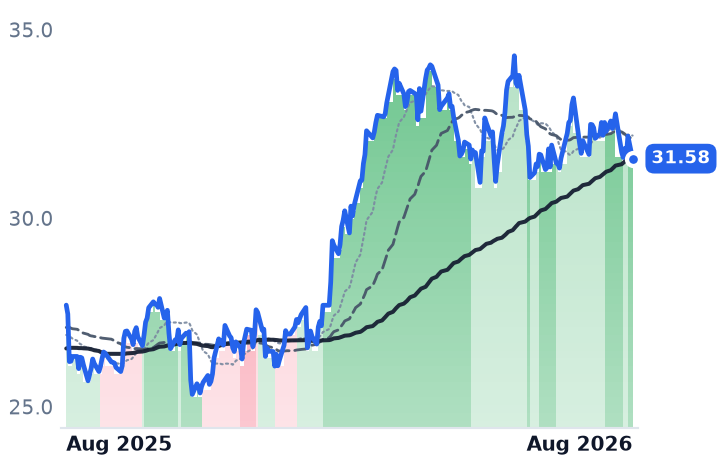
EQT | EQT | Appalachian Shale Gas | ⚠️ Emerging Bear | +2.9% | +3.5% |
EXE | Expand Energy | Appalachian Shale Gas | 🔴 Cont. Bear | +6.7% | −3.3% |
AR | Antero Resources | Appalachian Shale Gas | 🔴 Cont. Bear | +3.8% | +9.0% |
RRC | Range Resources | Appalachian Shale Gas | 🔴 Cont. Bear | +6.9% | +15.1% |
CNX | CNX Resources | Appalachian Shale Gas | ⚠️ Emerging Bear | +7.1% | +23.0% |
GPOR | Gulfport Energy | Appalachian Shale Gas | ⚠️ Emerging Bear | −1.5% | −2.5% |
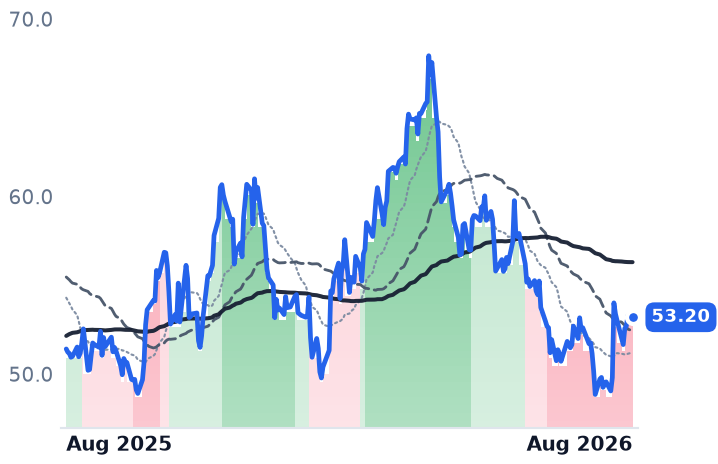
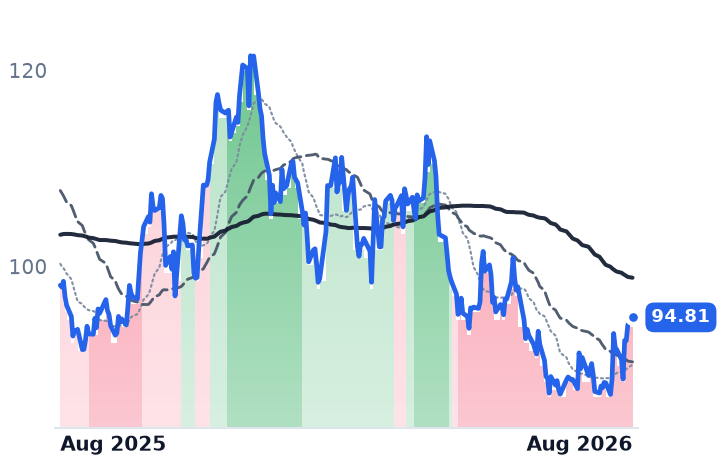
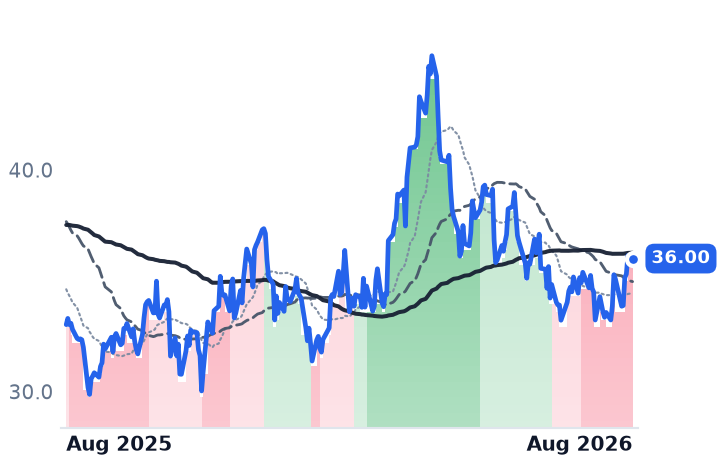
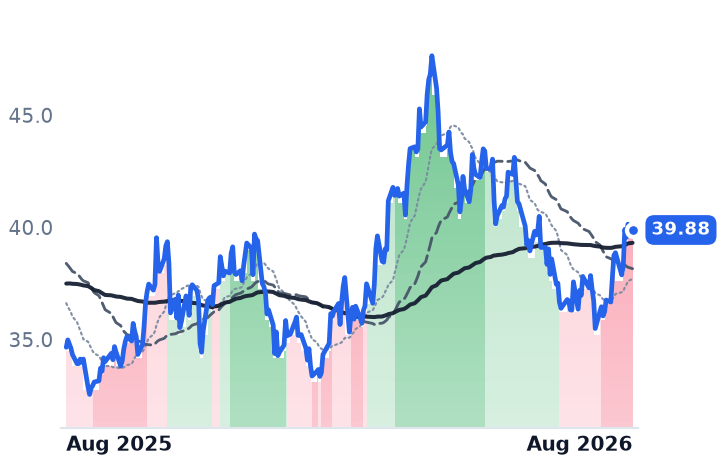
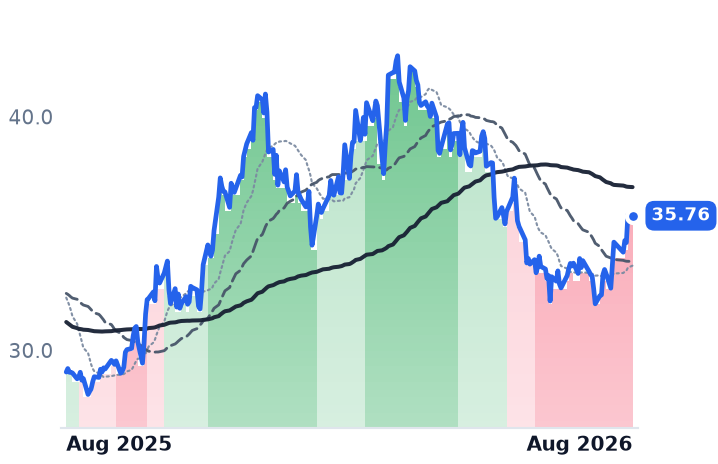
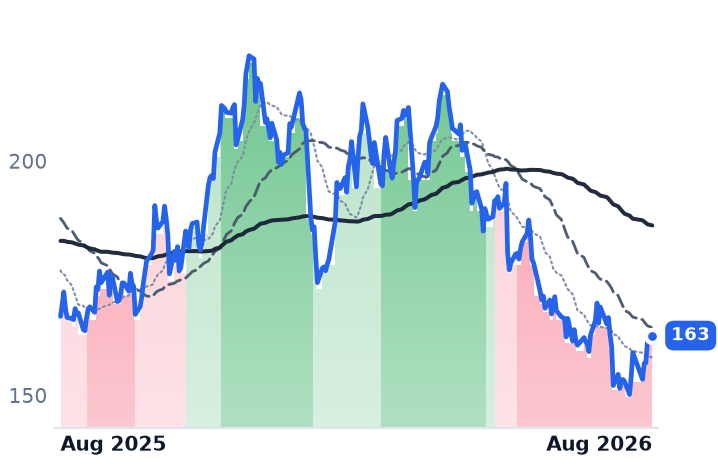
12-month price & trend
| Ticker | Mkt cap | P/E | P/E fwd | P/S | P/S fwd | P/GP | P/GP fwd | EV/EBITDA | FCF yld |
|---|---|---|---|---|---|---|---|---|---|
AROC | $6.2B | 19.2x | 19.0x | 4.1x | 4.0x | 7.1x | 6.9x | 9.8x | 3.9% |
KGS | $5.9B | 74.3x | 26.6x | 4.4x | 3.8x | 11.0x | 9.5x | 10.2x | 3.4% |
USAC | $3.8B | 26.5x | 22.3x | 3.5x | 2.8x | 7.8x | 6.3x | 10.7x | 8.0% |
| Ticker | Mkt cap | P/E | P/E fwd | P/S | P/S fwd | P/GP | P/GP fwd | EV/EBITDA | FCF yld |
|---|---|---|---|---|---|---|---|---|---|
NGS | $463.6M | 21.0x | 17.8x | 2.6x | 2.1x | 5.9x | 4.8x | 8.4x | -12.0% |
ENB | $118.1B | 25.4x | 18.4x | 1.7x | 1.6x | 6.0x | 5.7x | 13.1x | 1.4% |
WMB | $86.8B | 31.0x | 30.0x | 7.3x | 7.1x | 9.9x | 9.6x | 16.4x | 0.8% |
| Ticker | Mkt cap | P/E | P/E fwd | P/S | P/S fwd | P/GP | P/GP fwd | EV/EBITDA | FCF yld |
|---|---|---|---|---|---|---|---|---|---|
EPD | $82.1B | 13.2x | 13.0x | 1.4x | 1.4x | 10.6x | 10.6x | 10.9x | 2.7% |
KMI | $70.3B | 20.2x | 20.9x | 3.9x | 3.9x | 7.1x | 7.1x | 12.7x | 5.5% |
ET | $70.3B | 15.2x | 13.7x | 0.8x | 0.7x | 3.3x | 2.9x | 9.6x | 5.2% |
| Ticker | Mkt cap | P/E | P/E fwd | P/S | P/S fwd | P/GP | P/GP fwd | EV/EBITDA | FCF yld |
|---|---|---|---|---|---|---|---|---|---|
TRP | $69.2B | 28.3x | 17.7x | 6.1x | 4.3x | 11.9x | 8.4x | 14.3x | 4.1% |
MPLX | $59.3B | 12.6x | 13.6x | 4.8x | 4.6x | 9.2x | 8.8x | 11.6x | 8.4% |
OKE | $55.6B | 15.7x | 15.5x | 1.6x | 1.5x | 7.3x | 6.9x | 11.4x | 4.0% |
| Ticker | Mkt cap | P/E | P/E fwd | P/S | P/S fwd | P/GP | P/GP fwd | EV/EBITDA | FCF yld |
|---|---|---|---|---|---|---|---|---|---|
EQT | $33.3B | 11.7x | 12.6x | 3.6x | 3.5x | 5.3x | 5.1x | 6.3x | 11.3% |
EXE | $22.0B | 8.1x | 10.4x | 1.6x | 1.6x | 2.5x | 2.5x | 3.8x | 11.6% |
AR | $11.1B | 10.3x | 8.6x | 1.9x | 1.7x | 4.2x | 3.7x | 6.6x | 18.0% |
| Ticker | Mkt cap | P/E | P/E fwd | P/S | P/S fwd | P/GP | P/GP fwd | EV/EBITDA | FCF yld |
|---|---|---|---|---|---|---|---|---|---|
RRC | $9.3B | 11.0x | 9.7x | 2.8x | 2.6x | 5.8x | 5.4x | 7.2x | 12.6% |
CNX | $5.3B | 5.2x | 11.5x | 2.2x | 2.4x | 4.4x | 4.8x | 4.0x | 9.9% |
GPOR | $2.9B | 5.5x | 6.9x | 1.9x | 2.0x | 3.2x | 3.3x | 3.3x | 12.4% |
Valuation & fundamentals
Consensus projections
| Ticker | FY2026E | FY2027E | FY2028E | |
|---|---|---|---|---|
AROC | Revenue | +4.8% | +6.3% | +7.3% |
| EPS | +18.0% | +15.2% | +11.8% | |
KGS | Revenue | +16.6% | +16.1% | +15.3% |
| EPS | +95.9% | +35.0% | +31.5% | |
USAC | Revenue | +36.6% | +6.3% | +5.7% |
| EPS | +24.8% | +30.9% | +20.3% | |
NGS | Revenue | +27.2% | +16.9% | +6.0% |
| EPS | +26.9% | +26.9% | +5.2% | |
ENB | Revenue | +21.8% | −7.4% | +3.6% |
| EPS | +0.5% | +11.8% | +10.3% | |
WMB | Revenue | +6.4% | +10.5% | +13.5% |
| EPS | +11.5% | +6.7% | +21.1% | |
EPD | Revenue | +12.8% | +5.4% | +5.7% |
| EPS | +11.6% | +9.6% | +8.3% | |
KMI | Revenue | +8.2% | +1.9% | +5.8% |
| EPS | +17.7% | +0.8% | +8.9% | |
ET | Revenue | +33.3% | +2.1% | +4.4% |
| EPS | +11.0% | +6.5% | +6.5% | |
TRP | Revenue | +6.7% | +4.4% | +5.3% |
| EPS | +7.3% | +5.4% | +6.2% | |
MPLX | Revenue | −1.3% | +6.7% | +5.1% |
| EPS | −7.6% | +12.5% | +7.2% | |
OKE | Revenue | +13.9% | −2.2% | +1.4% |
| EPS | +5.5% | +9.2% | +11.5% | |
EQT | Revenue | +12.9% | −0.5% | +9.5% |
| EPS | +43.8% | −5.2% | +31.6% | |
EXE | Revenue | +17.6% | −3.0% | +5.6% |
| EPS | +51.5% | −4.6% | +14.3% | |
AR | Revenue | +30.3% | +0.3% | +7.0% |
| EPS | +130.9% | +1.8% | +26.1% | |
RRC | Revenue | +17.7% | +2.8% | +7.2% |
| EPS | +41.8% | −3.5% | +16.8% | |
CNX | Revenue | +6.9% | +0.7% | +5.8% |
| EPS | +42.1% | +37.2% | +18.2% | |
GPOR | Revenue | +8.3% | +4.2% | +5.3% |
| EPS | +10.8% | +18.4% | +28.6% |
Forward fiscal years only. Blank means no analyst coverage for that year.
Natural gas demand from artificial-intelligence data centers and new gas-fired power plants is showing up in company results — but the money attached to that demand is flowing almost entirely to the pipes and compressors that move the gas, not to the drillers who produce it. Over the past year, gas-pipeline operators and compression-equipment lessors have rallied 20%-55%, while six Appalachian gas producers are essentially flat, even though several just posted their best quarters in years and raised production targets. That split is the story: a documented gap between what these businesses are doing and what their stocks are doing.
Midstream: contracts are signed, and it's showing up in the numbers. Kinder Morgan (KMI), which owns the largest natural-gas pipeline network in North America, ended its second quarter with a $9.6 billion project backlog, 92% of it gas-related and more than 60% tied to power-generation demand, and now expects full-year adjusted earnings before interest, taxes, depreciation and amortization (EBITDA) at least 5% above budget — a swing chief financial officer David Michels pegged at more than $430 million, driven by the natural-gas buildout. Its Trident pipeline, a $1.7-1.8 billion project moving gas from Katy, Texas to Port Arthur, has its first phase targeted for early 2027 in-service. Williams Companies (WMB), owner of the Transco pipeline serving the Southeast and mid-Atlantic, is committing over $5 billion to power-linked projects including the $1.6 billion Project Socrates, targeted for late-2026 completion, and is separately in advanced talks on a roughly $5.5 billion acquisition of gathering assets serving ten liquefied-natural-gas (LNG) facilities and 26 power plants. Energy Transfer (ET), a diversified pipeline operator, signed a 450 million-cubic-feet-per-day supply contract with CloudBurst Data Centers near Austin and will feed a 1.2-gigawatt power plant near San Marcos starting the third quarter of 2026. Oneok (OKE), Enterprise Products Partners (EPD), Enbridge (ENB), TC Energy (TRP) and MPLX round out the group; all eight names sit in bullish trend bands, and the cohort's still-modest 12-13 times EBITDA multiple keeps it below merchant power-generation comparables even after the run.
Compression: real utilization, but the tape has started giving some back. Archrock (AROC), which rents natural-gas compression units to producers and pipelines, ran its fleet at 95% utilization on 4.53 million operating horsepower in the first quarter, is funding $250-275 million of 2026 growth capital expenditure without issuing new equity, and keeps debt under 3.5 times EBITDA, according to its own earnings materials. USA Compression Partners (USAC), a similarly sized fleet operator sponsored by Energy Transfer, is funding its capital plan from free cash flow, but its first-quarter gross profit fell 22.9% even as revenue grew 35% — a margin-compression signal inside a growth story — and the stock has slipped to a mild-bear trend band, the one name in this layer moving against its peers. Kodiak Gas Services (KGS) has climbed roughly 78% year-to-date on real, largely contracted distributed-power capacity, but sell-side coverage has downgraded it to Hold on valuation, and Archrock's own price target was trimmed in late July — a sign the group's easiest gains may be behind it even where the underlying contracts are genuine. Natural Gas Services Group (NGS) is the smallest name in the set.
Producers: better results, cheaper stocks, worse trend. All six Appalachian gas producers — EQT (EQT), the region's largest gas producer; Expand Energy (EXE), the Haynesville- and Appalachia-focused driller formed from Chesapeake's merger with Southwestern; Antero Resources (AR), an unhedged gas and natural-gas-liquids producer; Range Resources (RRC), a Marcellus operator with liquids-export exposure; CNX Resources (CNX); and Gulfport Energy (GPOR) — sit in the same bearish trend band, and all six are down over the trailing 90 days despite modest 30-day bounces. Yet EQT beat first-quarter consensus, posted a $5.07-per-thousand-cubic-feet realized price after hedges, and raised full-year production guidance; Range delivered its highest gas premium to benchmark futures in over a decade and a record natural-gas-liquids premium, with a favorable 2026 basis guide, not a blowout, per its results. The selling instead tracks a soft government forecast — the Energy Information Administration expects Henry Hub gas near $3.5-3.7 per million British thermal units through 2027, versus a $4.15 estimate from Goldman Sachs. That flat strip has priced these producers at 4.5-to-12.3 times trailing earnings, roughly a third of the compression group's multiple and a fraction of midstream's, even as EQT and Antero run largely unhedged into any late-decade repricing. Expand Energy has also been without a permanent chief executive since February, adding company-specific uncertainty on top of the sector-wide markdown.
What the tape says, and what it's missing. The trend bands read cleanly: midstream bullish across all eight names, compression bullish in three of four, and every one of the six producers in the same bearish band since mid-April — a cohort-wide signal, not one company's problem. But bearish price action next to earnings beats and raised guidance is a genuine divergence between the tape and the business, and it's the producers, not the pipelines, carrying it.
The setup
Where it stands — Midstream and compression have re-rated on signed, dated gas contracts; Appalachian producers beat estimates but trade at 4.5x-12.3x earnings versus 12x-100x for pipelines and compressors. Would confirm — Henry Hub futures for 2027-28 rise toward Goldman's $4.15/MMBtu case while EQT, Range and Antero hold or raise 2026 production guidance again. Would invalidate — Producer forward EV/EBITDA rises to converge with midstream multiples without any change in the futures strip, or USAC-style margin compression spreads to Archrock and Kodiak. Watch next — Expand Energy's permanent CEO appointment, expected within its original six-to-nine-month search window from February 2026. Valuation — E&P trailing P/E averages roughly 8x versus midstream's 12-34x and compression's 23-100x; midstream's 12-13x EV/EBITDA sits below merchant-power comparables.