

Data-Center Gas Trade Splits: Pipelines Compound While Producers De-Rate
Hypothesis Opus 5 · Research Sonnet 5 · Writing Sonnet 5 · Prompt v1.1
The AI-data-center natural-gas trade is rewarding pipeline and water-infrastructure operators paid fixed fees while Appalachian and Haynesville producers who sell the actual gas are de-rating on a real Henry Hub price collapse, though several producers now look cheap on their own numbers rather than broken.
| Ticker | Company | Segment | Trend | 30D | 1Y |
|---|---|---|---|---|---|
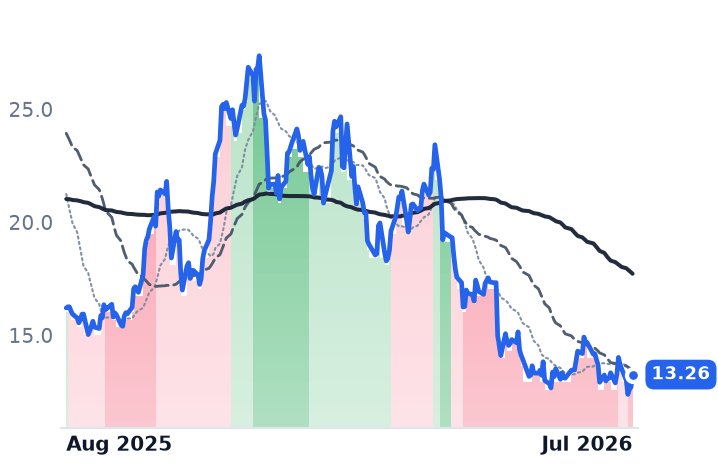
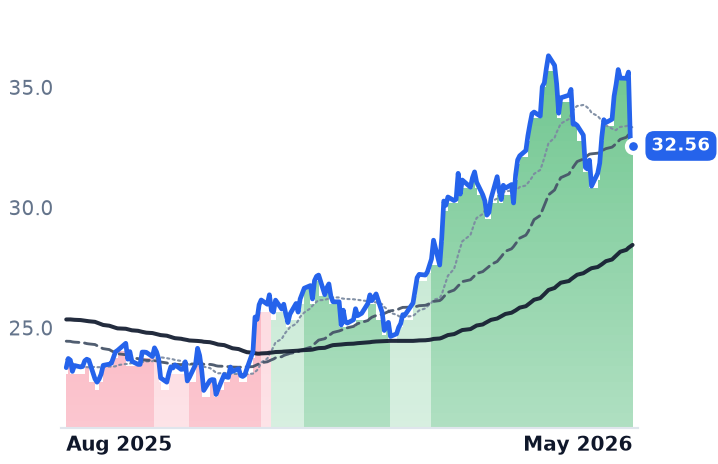
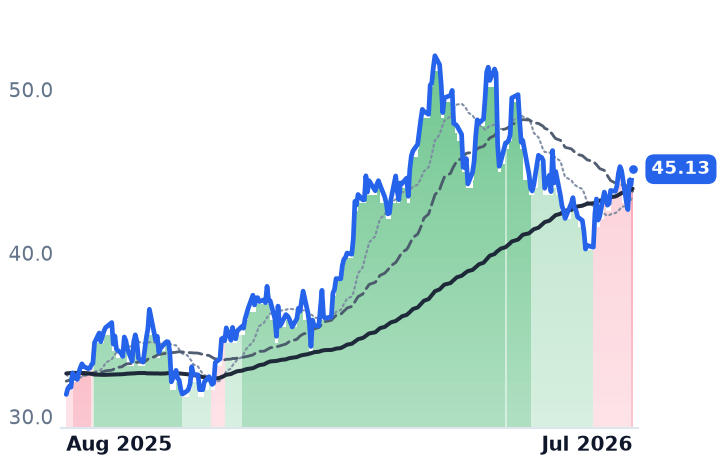
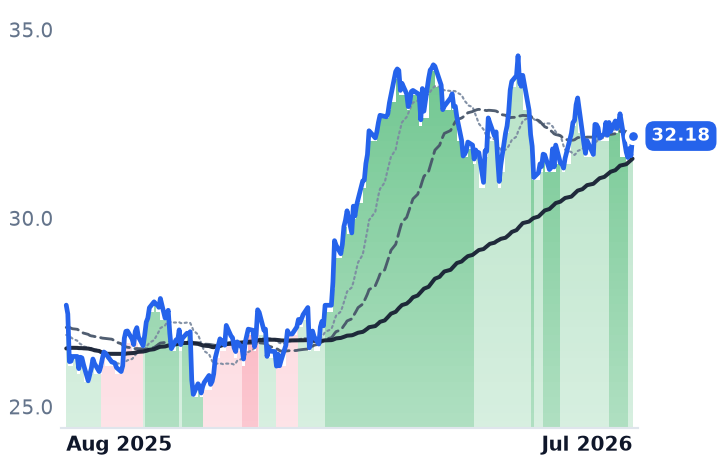
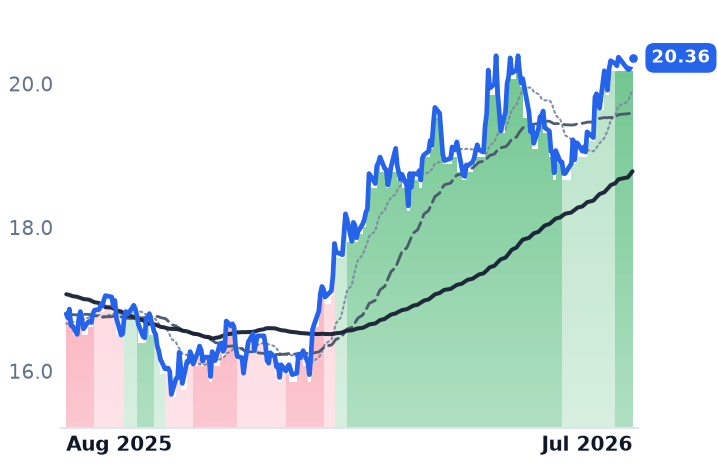
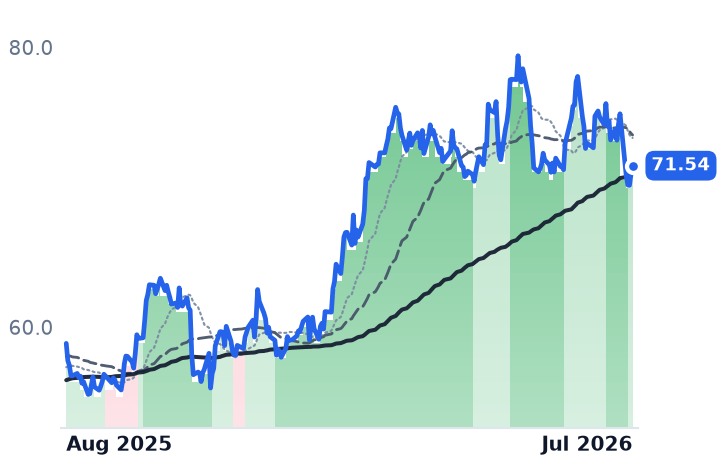
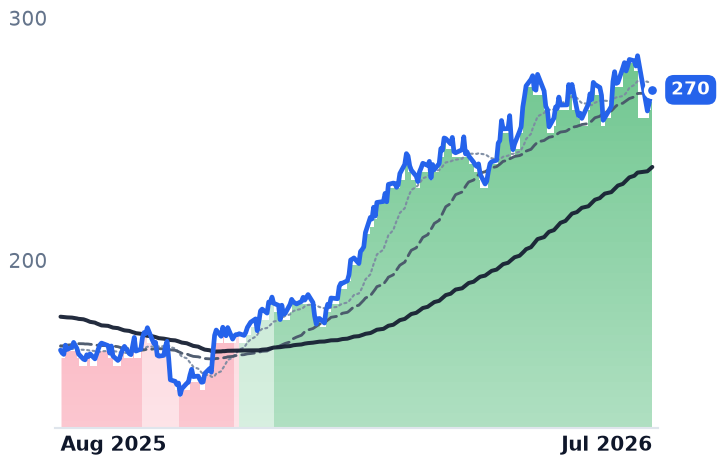
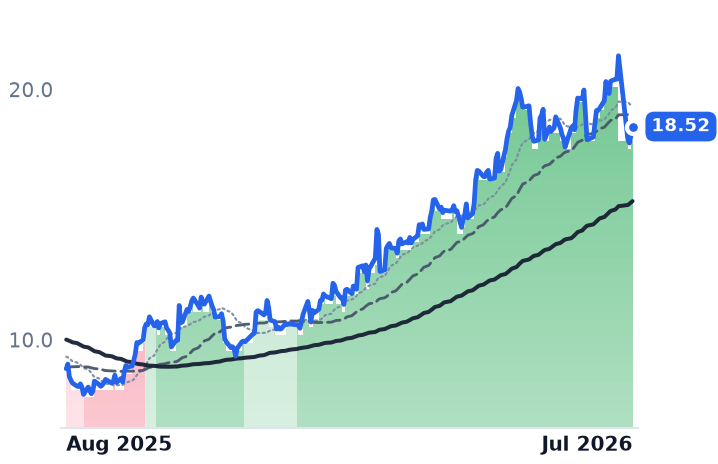
EQT | EQT | Appalachian Shale Gas | ⚠️ Emerging Bear | +3.1% | +3.6% |
EXE | Expand Energy | Appalachian Shale Gas | ⚠️ Emerging Bear | +5.8% | −4.1% |
RRC | Range Resources | Appalachian Shale Gas | 🔴 Cont. Bear | +7.6% | +15.8% |
AR | Antero Resources | Appalachian Shale Gas | 🔴 Cont. Bear | +4.2% | +9.4% |
CRK | Comstock Resources | Diversified Onshore & Conventional | ⚠️ Emerging Bear | −6.4% | −18.2% |
CTRA | Coterra Energy | Appalachian Shale Gas | 🟢 Cont. Bull | — | +39.5% |
DVN | Devon Energy | Diversified Onshore & Conventional | ⚠️ Emerging Bear | +11.8% | +43.9% |
KMI | Kinder Morgan | Natural Gas Pipelines & Transmission | 🟢 Cont. Bull | +1.5% | +16.2% |
ET | Energy Transfer | Natural Gas Pipelines & Transmission | 🌱 Emerging Bull | +5.8% | +21.2% |
WMB | The Williams Companies | Natural Gas Pipelines & Transmission | 🟢 Cont. Bull | −1.8% | +21.6% |
TRGP | Targa Resources | Natural Gas Gathering & Processing | 🟢 Cont. Bull | +2.6% | +66.0% |
WTTR | Select Water Solutions | Water Services & Energy Solutions | 🟢 Cont. Bull | +2.3% | +109.4% |
RES | RPC | Well Services & Stimulation | ⚠️ Emerging Bear | +2.0% | +29.3% |
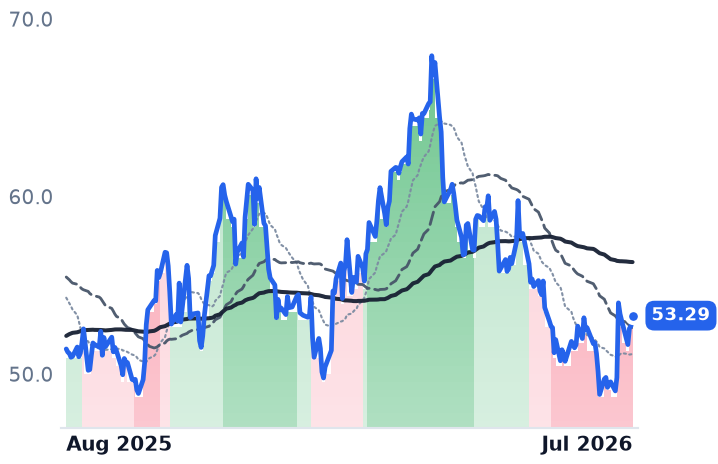
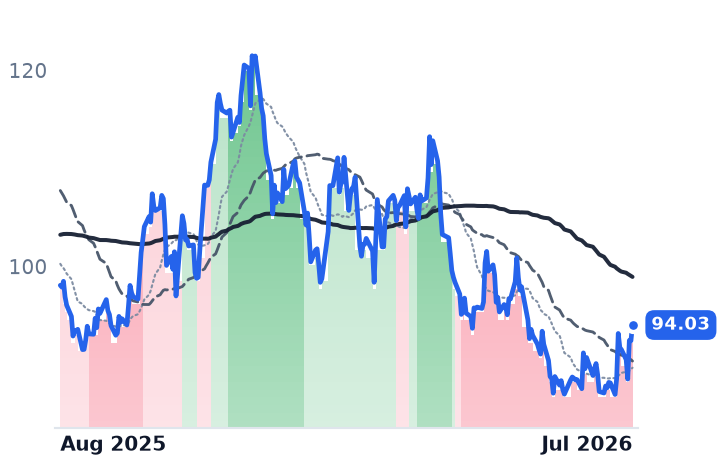
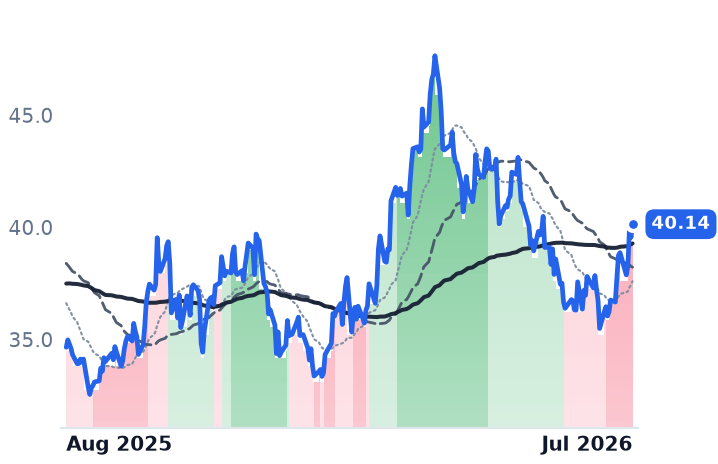
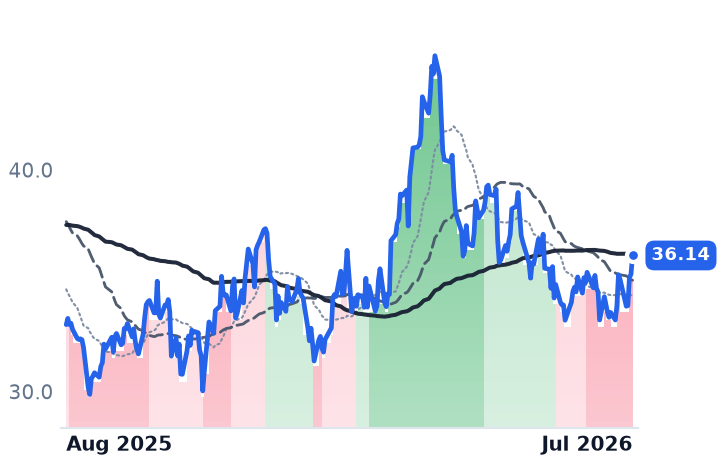
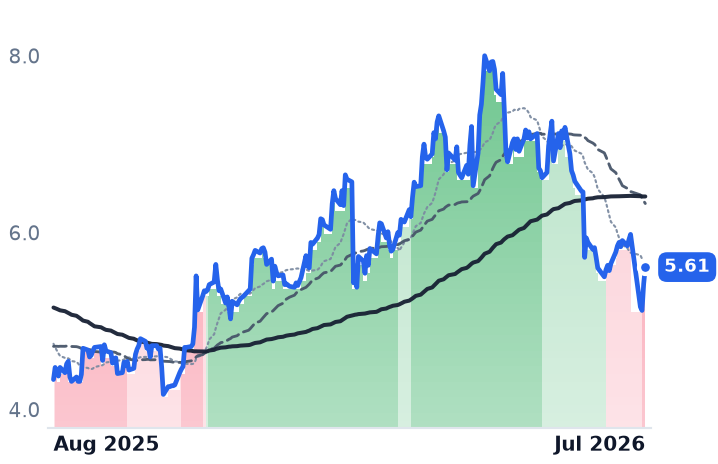
12-month price & trend
| Ticker | Mkt cap | P/E | P/E fwd | P/S | P/S fwd | P/GP | P/GP fwd | EV/EBITDA | FCF yld |
|---|---|---|---|---|---|---|---|---|---|
EQT | $33.3B | 11.7x | 12.6x | 3.6x | 3.5x | 5.3x | 5.1x | 6.3x | 11.3% |
EXE | $22.0B | 8.1x | 10.4x | 1.6x | 1.6x | 2.5x | 2.5x | 3.8x | 11.6% |
RRC | $9.3B | 11.0x | 9.7x | 2.8x | 2.6x | 5.8x | 5.4x | 7.2x | 12.6% |
| Ticker | Mkt cap | P/E | P/E fwd | P/S | P/S fwd | P/GP | P/GP fwd | EV/EBITDA | FCF yld |
|---|---|---|---|---|---|---|---|---|---|
AR | $11.1B | 10.3x | 8.6x | 1.9x | 1.7x | 4.2x | 3.7x | 6.6x | 18.0% |
CRK | $3.9B | 7.5x | 31.7x | 2.1x | 2.0x | 3.1x | 3.0x | 5.1x | -22.6% |
CTRA | $24.7B | 14.9x | 11.3x | 3.2x | 2.9x | 8.2x | 7.4x | 5.7x | 8.0% |
| Ticker | Mkt cap | P/E | P/E fwd | P/S | P/S fwd | P/GP | P/GP fwd | EV/EBITDA | FCF yld |
|---|---|---|---|---|---|---|---|---|---|
DVN | $30.8B | 13.6x | 9.2x | 1.8x | 1.3x | 7.9x | 5.7x | 4.9x | 8.7% |
KMI | $70.3B | 20.2x | 20.9x | 3.9x | 3.9x | 7.1x | 7.1x | 12.7x | 5.5% |
ET | $70.3B | 15.2x | 13.7x | 0.8x | 0.7x | 3.3x | 2.9x | 9.6x | 5.2% |
| Ticker | Mkt cap | P/E | P/E fwd | P/S | P/S fwd | P/GP | P/GP fwd | EV/EBITDA | FCF yld |
|---|---|---|---|---|---|---|---|---|---|
WMB | $86.8B | 31.0x | 30.0x | 7.3x | 7.1x | 9.9x | 9.6x | 16.4x | 0.8% |
TRGP | $57.2B | 27.0x | 24.5x | 3.5x | 2.9x | 9.6x | 7.9x | 15.3x | 0.5% |
WTTR | $2.0B | 96.7x | 36.6x | 1.4x | 1.4x | 7.7x | 7.7x | 8.3x | -4.8% |
| Ticker | Mkt cap | P/E | P/E fwd | P/S | P/S fwd | P/GP | P/GP fwd | EV/EBITDA | FCF yld |
|---|---|---|---|---|---|---|---|---|---|
RES | $1.5B | 73.3x | 34.6x | 0.9x | 0.9x | 7.9x | 7.9x | 6.3x | 2.9% |
Valuation & fundamentals
Consensus projections
| Ticker | FY2026E | FY2027E | FY2028E | |
|---|---|---|---|---|
EQT | Revenue | +12.9% | −0.5% | +9.5% |
| EPS | +43.8% | −5.2% | +31.6% | |
EXE | Revenue | +17.6% | −3.0% | +5.6% |
| EPS | +51.5% | −4.6% | +14.3% | |
RRC | Revenue | +17.7% | +2.8% | +7.2% |
| EPS | +41.8% | −3.5% | +16.8% | |
AR | Revenue | +30.3% | +0.3% | +7.0% |
| EPS | +130.9% | +1.8% | +26.1% | |
CRK | Revenue | +2.5% | +16.5% | +12.5% |
| EPS | −20.6% | +71.4% | +79.2% | |
CTRA | Revenue | +11.7% | +1.5% | +3.3% |
| EPS | +31.8% | +1.2% | +8.2% | |
DVN | Revenue | +42.1% | +10.1% | +4.9% |
| EPS | +35.0% | −1.0% | +8.2% | |
KMI | Revenue | +8.2% | +1.9% | +5.8% |
| EPS | +17.7% | +0.8% | +8.9% | |
ET | Revenue | +33.3% | +2.1% | +4.4% |
| EPS | +11.0% | +6.5% | +6.5% | |
WMB | Revenue | +6.4% | +10.5% | +13.5% |
| EPS | +11.5% | +6.7% | +21.1% | |
TRGP | Revenue | +16.6% | +16.2% | +10.0% |
| EPS | +27.2% | +14.6% | +17.6% | |
WTTR | Revenue | +5.5% | +5.2% | +3.9% |
| EPS | +112.0% | +36.1% | +59.7% | |
RES | Revenue | +6.5% | +4.8% | −2.3% |
| EPS | −30.3% | +40.0% | +42.9% |
Forward fiscal years only. Blank means no analyst coverage for that year.
Two businesses, one label
A group of 17 energy stocks tied to the AI data-center buildout looks calm from a distance, up 15% over the past year and another 2.6% in the last month. But that average blends two businesses moving in opposite directions. Companies that own pipelines and water-handling systems and collect a fixed fee regardless of gas prices keep climbing. Companies that pull gas out of the Appalachian and Haynesville shales and sell it at whatever the market pays have been falling for three months. The split traces to a genuine collapse in the price of gas itself, not just a shift in investor mood.
The producers: a real price shock
EQT Corporation, the largest natural-gas producer in Appalachia's Marcellus and Utica shale, Range Resources, another large Appalachian gas and natural-gas-liquids producer, and Antero Resources, an Appalachian producer that also sells liquids through its own midstream system, all broke from a mild uptrend to a hard downtrend between late June and early July; EQT is down 9.9% over 90 days. Expand Energy, the Haynesville-focused producer formed from last year's Chesapeake-Southwestern merger, has sat in a downtrend continuously since April 14, a 109-session stretch that overlaps with CEO Nick Dell'Osso's February departure and an unresolved leadership search. Comstock Resources, a Haynesville shale gas producer, is down 23% over 90 days and 40% over six months, the worst of the group, after Q2 revenue fell and net income dropped year-over-year despite flat production, even as it sold a stake in its gathering unit to cut leverage. Coterra Energy, formerly a standalone Appalachian and Permian producer, merged into Devon Energy in May and no longer trades separately, leaving five starred producers instead of six.
The driver is Henry Hub, the US gas benchmark: spot prices averaged $7.72/MMBtu in January 2026 on an extreme cold snap, then were revised down to a $3.67 full-year forecast as storage rebuilt to 5% above its five-year average. EQT's realized price fell to $2.89/MMBtu in the second quarter even as it generated $330 million of free cash flow and raised production guidance. Notably, Appalachian basis actually strengthened, not widened, through mid-2026, meaning this is a national gas-price story, not a regional discount problem.
Fundamentals split the producers further
EQT's trailing price-to-earnings actually rose, from 11.3x to 12.3x, while its stock fell — earnings decayed faster than the share price, which CONFIRMS genuine deterioration rather than a cheap dislocation. Range and Antero tell a different story: Antero's trailing P/E compressed from 19x to 10x on only a modest price decline, and both remain up double digits over six months despite their bearish short-term bands — valuation here looks INCONCLUSIVE-to-cheapening, not a confirmed breakdown. Expand Energy, at 6.7x trailing earnings, is the extreme case: the user's own research explicitly calls it "dislocated," trading near 4x forward EBITDA on a low-to-mid-teens free-cash-flow yield, arguing the CEO overhang has hit the price but not the roughly 70% of core Haynesville inventory it controls. Comstock is flagged in the same research as the highest-torque and highest-leverage name in the group — the biggest winner if a forecast 2028 gas deficit arrives, the biggest loser if it doesn't.
The infrastructure side: fee-based and still compounding
Targa Resources, the dominant natural-gas processor in the Permian Basin, has held an uptrend for 232 straight sessions since mid-December and trades near 28x trailing earnings on record Adjusted EBITDA. Select Water Solutions, a produced-water management provider to shale drillers, has held its own uptrend for 217 sessions and is up 55% over six months — but its P/E has expanded from 82x to 94x, the richest multiple in the group, a stretched advance riding continued volume growth rather than a support level. Energy Transfer and Kinder Morgan, both major pipeline and gas-gathering operators, look cheaper by comparison at roughly 16x and 20x trailing earnings; Energy Transfer has signed roughly 900 million cubic feet per day of Oracle-linked gas-supply agreements and a 20-year deal to supply Meta's Hyperion data-center campus, and Kinder Morgan's $20 billion project backlog is about 60% linked to power and data-center demand — signed contracts with named counterparties, not just letters of intent. Williams Companies, which owns the Transco pipeline system, trades at the richest multiple of the three, near 34x, yet its stock is down 5% over 90 days despite remaining nominally in an uptrend — an early crack worth watching in an otherwise unbroken infrastructure rally.
The tape running ahead of the numbers
RPC, an oilfield-services company that provides pressure pumping and other completion services, was downgraded to a downtrend in the final week of July as frac-spread counts fell to 196 crews, even though its own Q2 results beat estimates with margins expanding 250 basis points as it shifted toward higher-return service lines. That gap between a bearish band and improving numbers suggests the oilfield-services tape may be pricing in more pessimism than the underlying business currently shows.
The setup
Where it stands — Pipeline and water names hold multi-month uptrends on signed data-center gas contracts; five of six starred producers sit in downtrends on a real Henry Hub price collapse. Would confirm — EQT and Expand Energy's realized gas prices stay below $3.50/MMBtu through Q3 2026 while trailing earnings keep falling faster than share prices. Would invalidate — Henry Hub's 2027 strip rises back above $4.00/MMBtu and Range or Antero's trend bands flip back to an uptrend for 20+ consecutive sessions. Watch next — Expand Energy's permanent CEO announcement and Q3 2026 earnings from EQT, Range and Antero in late October/early November. Valuation — Expand Energy trades near 4x forward EBITDA versus Energy Transfer's 8.5x and Select Water's 94x trailing P/E, its own three-year high.