

Data-Center Metals Bucket Rolls Over Broadly, Debunking 'Resilience' Label
Hypothesis Opus 5 · Research Sonnet 5 · Writing Sonnet 5 · Prompt v1.0
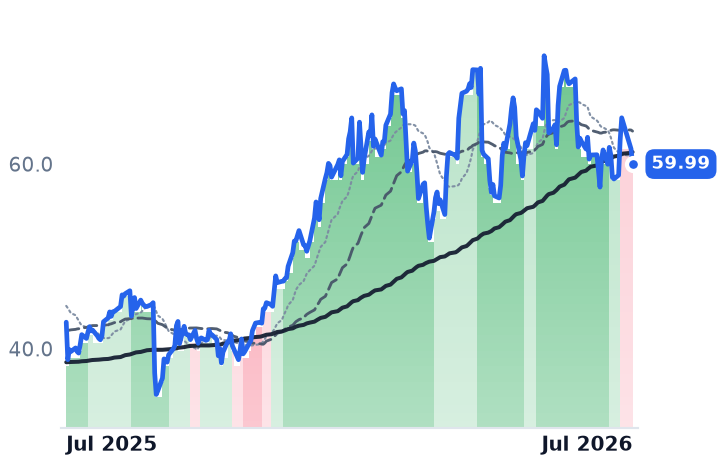
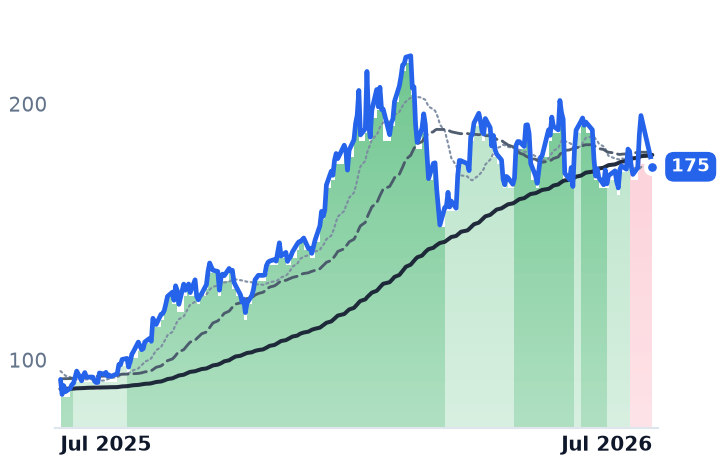
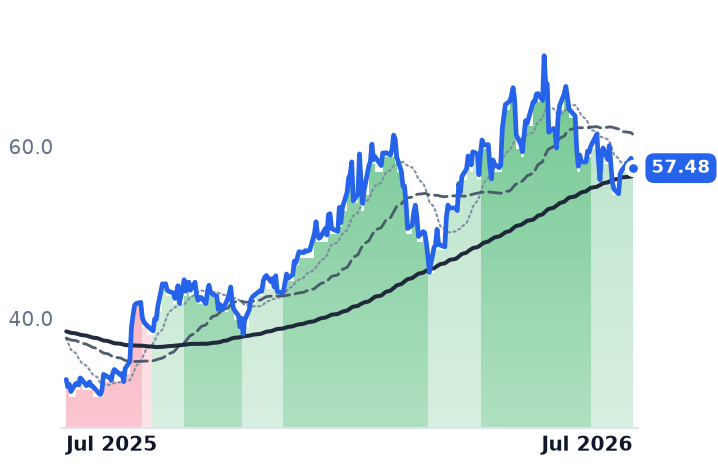
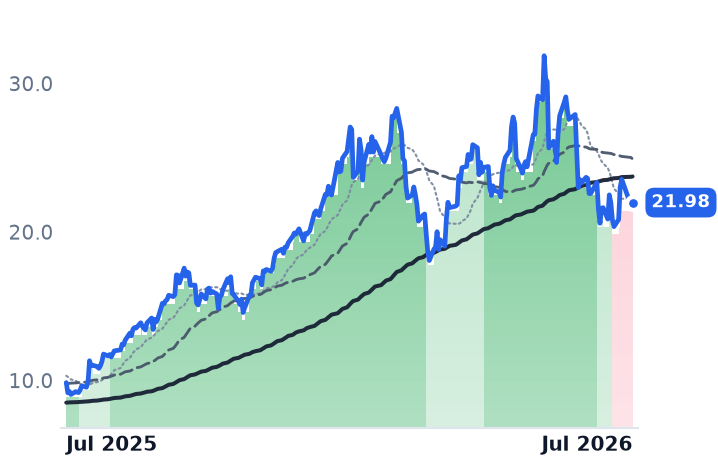
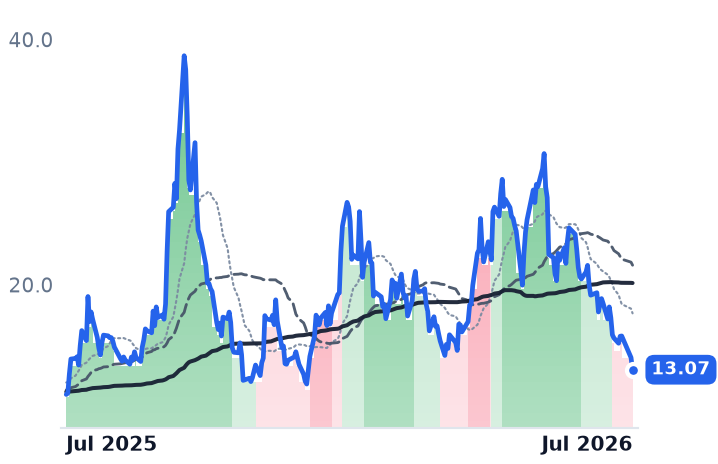
The premise that the copper/aluminum/rare-earth bucket is uniquely resilient doesn't hold up: as of 2026-07-29 only TECK and BHP remain in bull trend bands while FCX, HBM, RIO, SCCO, USAR sit in mildly bearish and AA/ERO in strongly bearish, with 30-day returns mostly negative — a broad, synchronized equity rollover that has decoupled sharply from still-firm physical copper fundamentals.
| Ticker | Company | Segment | Trend · 13mo | 30D | 1Y |
|---|---|---|---|---|---|
FCX | Freeport-McMoRan | Copper | 🟢 Cont. Bull | −2.6% | +39.9% |
SCCO | Southern Copper | Copper | 🟢 Cont. Bull | +4.2% | +90.0% |
TECK | Teck Resources | Major Diversified Mining | 🟢 Cont. Bull | −1.2% | +74.8% |
HBM | Hudbay Minerals | Copper | 🟢 Cont. Bull | −7.2% | +123.0% |
ERO | Ero Copper | Copper | 🟢 Cont. Bull | −2.6% | +84.7% |
RIO | Rio Tinto | Major Diversified Mining | 🟢 Cont. Bull | −0.7% | +58.4% |
BHP | BHP | Major Diversified Mining | 🟢 Cont. Bull | +1.7% | +60.8% |
AA | Alcoa | Aluminum | 🟢 Cont. Bull | −19.8% | +42.0% |
USAR | USA Rare Earth | Rare Earth & Magnets | 🟢 Cont. Bull | −37.9% | +18.3% |
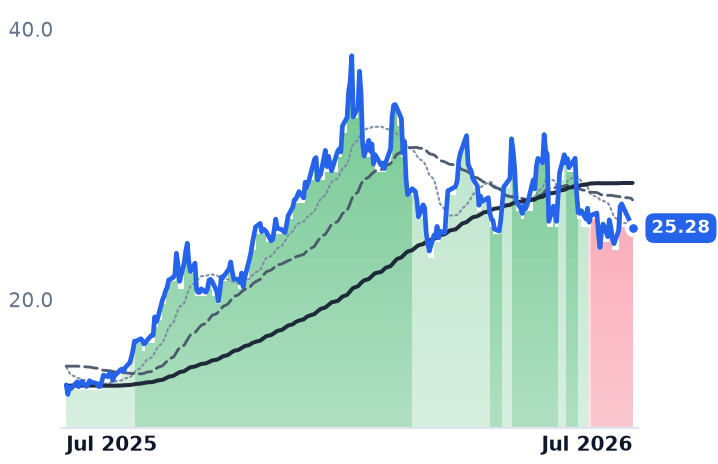
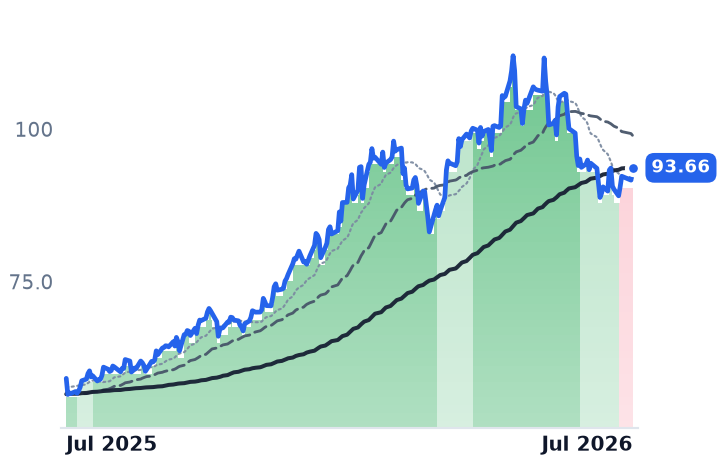
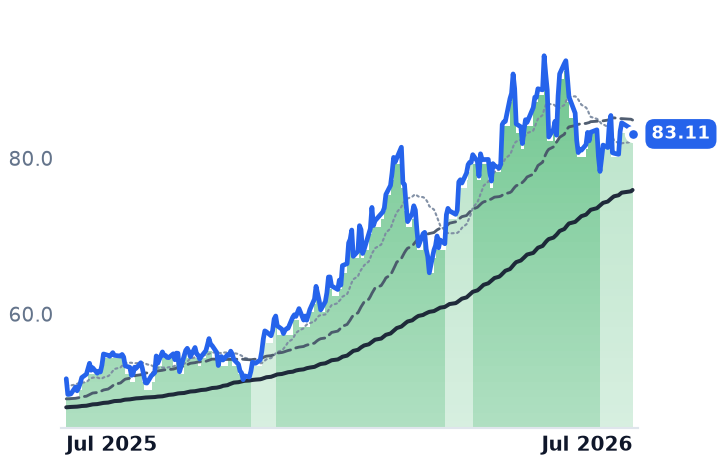
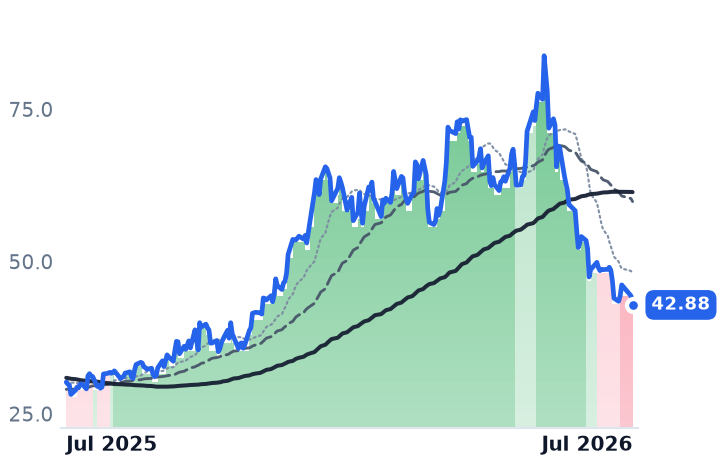
12-month price & trend
| Ticker | Mkt cap | P/E | P/E fwd | P/S | P/S fwd | P/GP | P/GP fwd | EV/EBITDA | FCF yld |
|---|---|---|---|---|---|---|---|---|---|
FCX | $95.6B | 32.8x | 22.8x | 3.7x | 3.3x | 13.8x | 12.1x | 11.3x | 6.2% |
SCCO | $154.0B | 27.0x | 24.1x | 9.8x | 9.2x | 15.7x | 14.7x | 15.8x | 3.9% |
TECK | $30.7B | 17.3x | 10.6x | 3.0x | 2.0x | 8.7x | 5.8x | 7.2x | 3.6% |
| Ticker | Mkt cap | P/E | P/E fwd | P/S | P/S fwd | P/GP | P/GP fwd | EV/EBITDA | FCF yld |
|---|---|---|---|---|---|---|---|---|---|
HBM | $11.9B | 15.8x | 17.7x | 4.8x | 4.1x | 12.2x | 10.4x | 7.1x | 2.1% |
ERO | $3.5B | 11.3x | 8.7x | 3.4x | 2.8x | 7.9x | 6.6x | 7.0x | 4.4% |
RIO | $155.5B | 12.9x | 11.5x | 2.5x | 2.4x | 9.2x | 8.9x | 7.0x | 3.7% |
| Ticker | Mkt cap | P/E | P/E fwd | P/S | P/S fwd | P/GP | P/GP fwd | EV/EBITDA | FCF yld |
|---|---|---|---|---|---|---|---|---|---|
BHP | $220.5B | 21.3x | 17.3x | 4.1x | 3.9x | 4.9x | 4.7x | 8.8x | 4.6% |
AA | $13.2B | 10.2x | 7.6x | 1.0x | 0.9x | 5.2x | 4.7x | 7.1x | 2.7% |
USAR | $2.6B | n/m | — | 194.4x | 32.3x | — | — | n/m | -9.6% |
Consensus projections
| Ticker | FY2026E | FY2027E | FY2028E | |
|---|---|---|---|---|
FCX | Revenue | +15.2% | +20.6% | +3.7% |
| EPS | +87.7% | +36.2% | +10.3% | |
SCCO | Revenue | +27.7% | −4.3% | +2.7% |
| EPS | +47.9% | −6.3% | −2.0% | |
TECK | Revenue | +42.9% | +0.6% | −15.6% |
| EPS | +127.1% | −14.6% | −25.9% | |
HBM | Revenue | +30.7% | +15.9% | +0.7% |
| EPS | +78.7% | +28.3% | +1.3% | |
ERO | Revenue | +59.9% | +9.5% | −4.0% |
| EPS | +74.0% | +20.4% | −3.4% | |
RIO | Revenue | +12.4% | +1.4% | +1.3% |
| EPS | +25.1% | −0.5% | −2.1% | |
BHP | Revenue | +13.3% | −1.9% | −1.0% |
| EPS | +23.8% | −0.2% | −2.5% | |
AA | Revenue | +17.1% | +2.4% | −6.2% |
| EPS | +84.0% | −5.4% | +4.0% | |
USAR | Revenue | +980.4% | +592.8% | +163.6% |
| EPS | −75.2% | −59.4% | −249.2% |
Forward fiscal years only. Blank means no analyst coverage for that year.
What the data actually shows
Across the nine-name cohort (FCX, SCCO, TECK, HBM, ERO, RIO, BHP, AA, USAR), trend bands as of 2026-07-29 show only TECK and BHP in mildly bullish territory; FCX, HBM, RIO, SCCO and USAR have all rolled into mildly bearish over the past two to three weeks, and AA and ERO sit in strongly bearish. Thirty-day returns are mixed-to-negative rather than uniformly resilient: AA -19.8%, USAR -37.9%, HBM -7.2%, FCX -2.6%, ERO -2.6%, RIO -0.7%, TECK -1.2%, against modest gains for BHP (+1.7%) and SCCO (+4.2%). The 180-day picture is similarly bifurcated — BHP +20.9% and TECK +6.9% versus AA -24.5%, ERO -24.6% and USAR -41.7% — undercutting any notion of a cohort-wide continued-bull streak. This looks like a broad, fairly synchronized de-rating, not a case of durable base-metal resilience standing apart from one broken rare-earth name.
Physical copper is holding up better than copper equities
The fundamental copper story retains real teeth. Treatment-and-refining charges have collapsed toward zero — Antofagasta agreed a $0/tonne TC/RC deal with a Chinese smelter for 2026, down from $21.25/t — a scarcity signal even if partly a function of Chinese smelting overcapacity. Mine-supply guidance has been cut hard: Freeport-McMoRan trimmed 2026 copper sales guidance roughly 300 million pounds after Grasberg force majeure, and Ivanhoe cut Kamoa-Kakula 2026-27 guidance following a seismic event. Teck's Q2 beat came with management explicitly citing AI/datacenter infrastructure as an emerging incremental demand source for copper. Yet copper miners as a group (COPX) traded 23% below 2026 highs even as futures held near records, with Comex copper still up over 12% year-to-date and only 5% off its June peak — equities have sold off far harder than the metal. That gap traces partly to record combined LME+SHFE+COMEX inventories, the highest since 2003, reigniting China-demand doubts, though a chunk of that COMEX build reflects tariff-hedging stockpiles rather than spot-available metal, and war jitters plus China demand fears have overshadowed earnings beats at Teck and Freeport.
Aluminum and rare earths tell separate stories
Alcoa shows the clearest decoupling: even with a record $2,182/tonne Midwest Premium cited as a profit driver, AA equity fell 19.8% in 30 days into strongly bearish — a tariff-arbitrage trade unwinding. USAR's collapse, meanwhile, traces to dilution from a 93.8-million-share resale registration, Russell index removal and an MP Materials lawsuit — idiosyncratic, not a base-metals read-through. Incentive-price analysis still suggests greenfield copper supply needs prices above current spot, meaning the physical deficit case survives even though the equity cohort itself is broadly de-rating on macro overhang rather than acting as the durable buildout trade the label implies.