

Two SaaS buckets, one real bottom: infra moats turn, back-office still bounces
Hypothesis Opus 5 · Research Sonnet 5 · Writing Sonnet 5 · Prompt v1.0
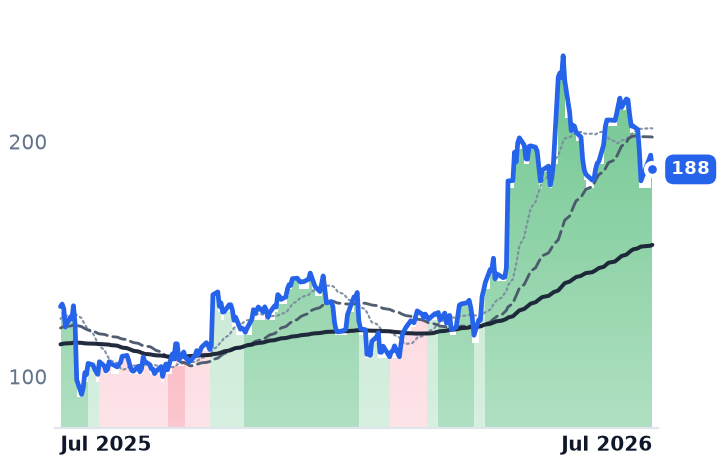
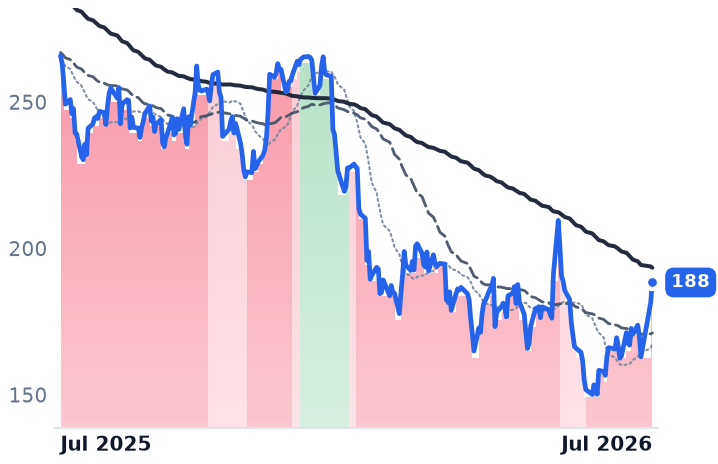
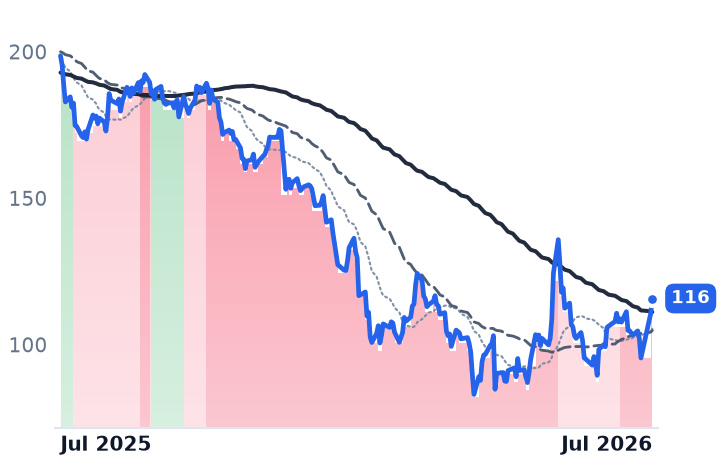
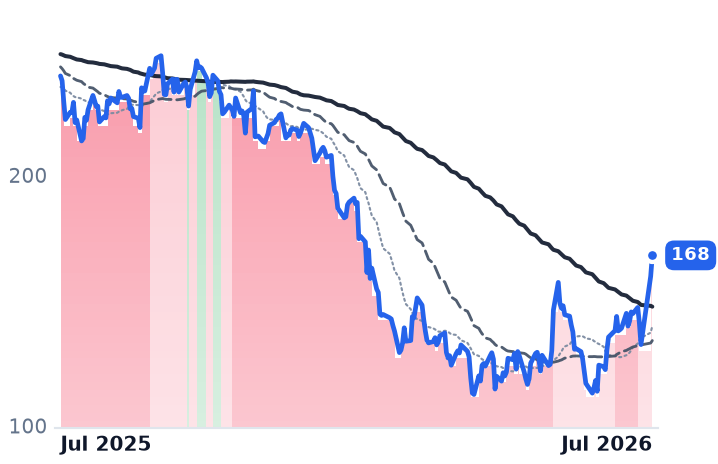
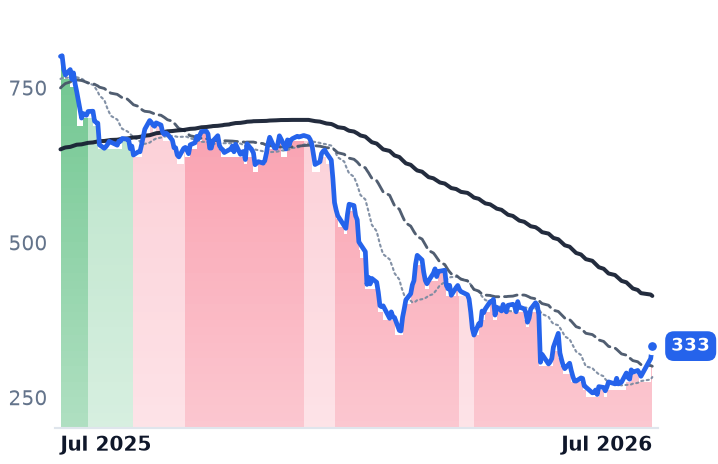
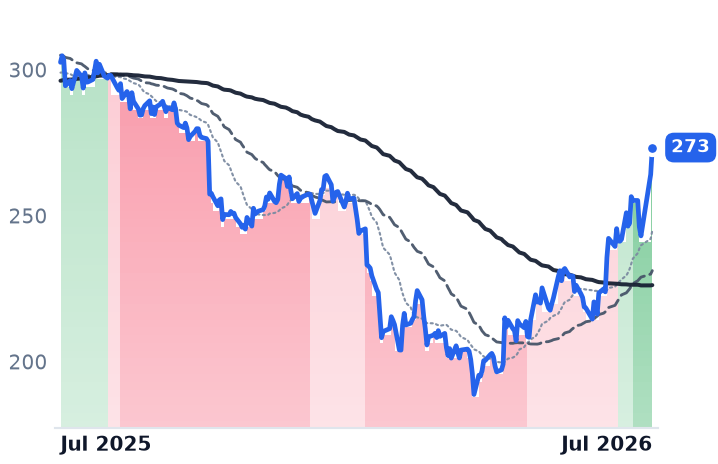
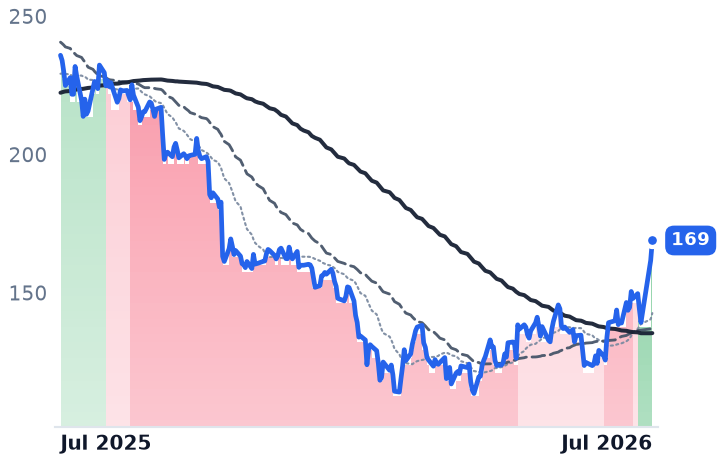
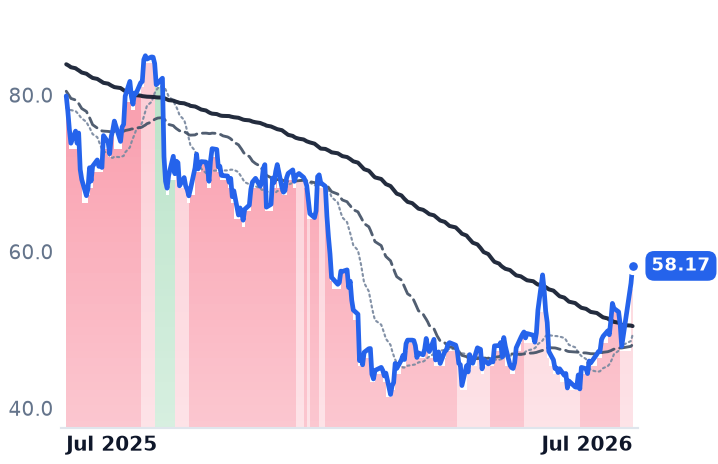
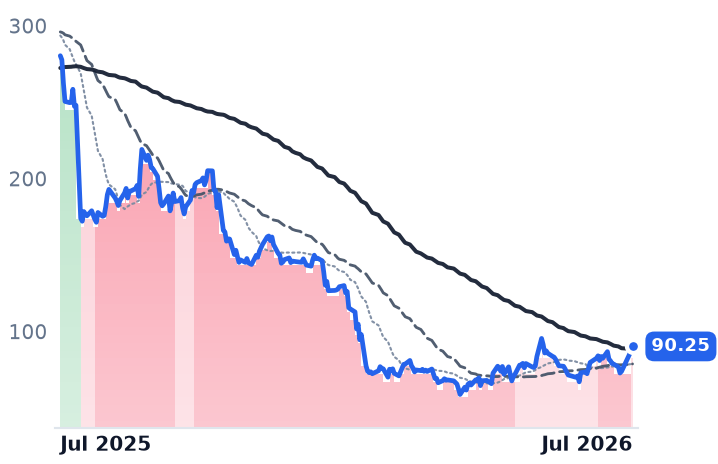
The "Strong Infrastructure Moats" SaaS bucket (TWLO, DT, FROG, NTNX, IOT, VEEV) has genuinely exited bear trend-bands on fundamentals since May-July, while the "Back-Office/Workflow" bucket's headline +19% month is mostly a single late-July rotation trade — most of its members, including ServiceNow post-earnings, are still stuck in bear bands.
| Ticker | Company | Segment | Trend · 13mo | 30D | 1Y |
|---|---|---|---|---|---|
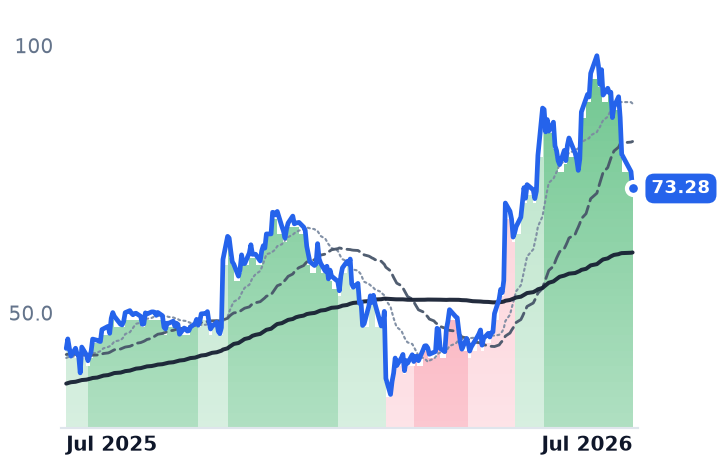
TWLO | Twilio | Communications & Messaging Platforms | 🟢 Cont. Bull | −5.3% | +45.0% |
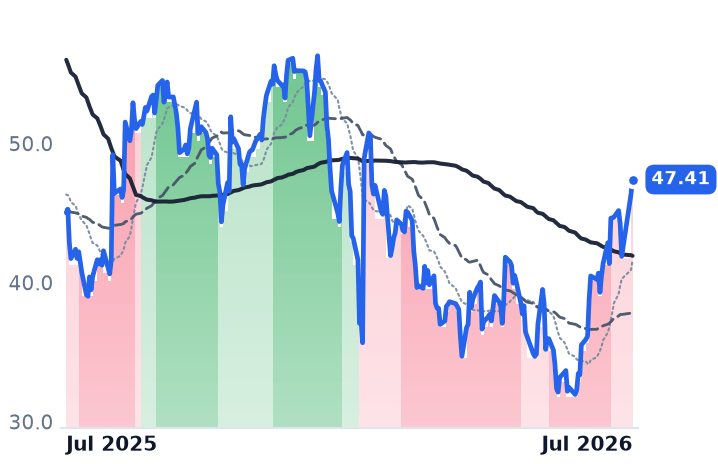
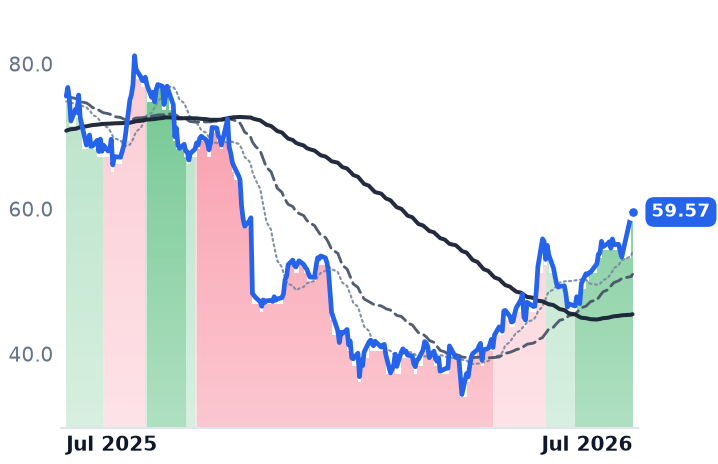
BILL | Bill.com | Fintech & Digital Finance | ⚠️ Emerging Bear | +32.0% | +5.3% |
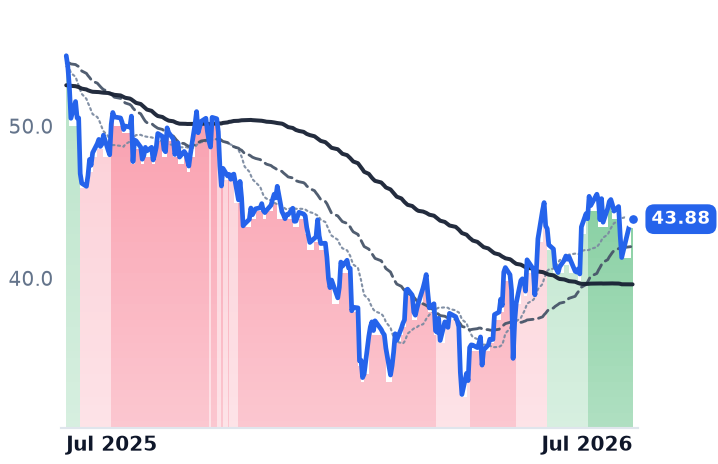
DT | Dynatrace | Other | 🌱 Emerging Bull | −0.8% | −19.7% |
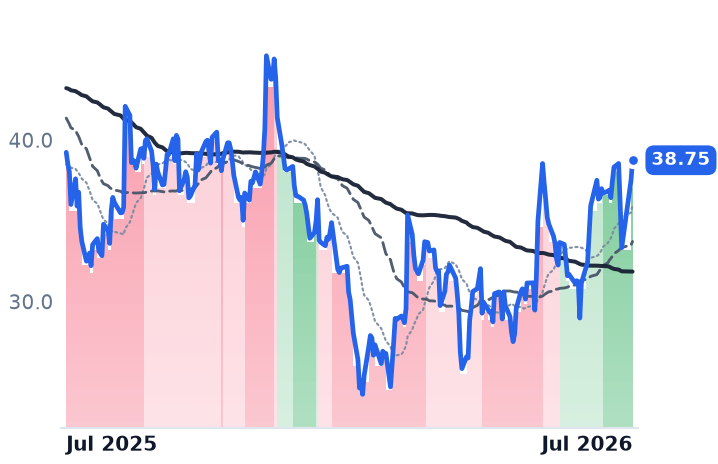
IOT | Samsara | IoT & Connected Operations | 🌱 Emerging Bull | +20.7% | −1.2% |
FROG | JFrog | Developer Tools & DevOps | 🟢 Cont. Bull | −18.7% | +69.0% |
NTNX | Nutanix | Cloud Infrastructure & Platforms | 🌱 Emerging Bull | +16.7% | −21.2% |
VEEV | Veeva Systems | Life Sciences Software & Data | 🔴 Cont. Bear | +18.0% | −27.6% |
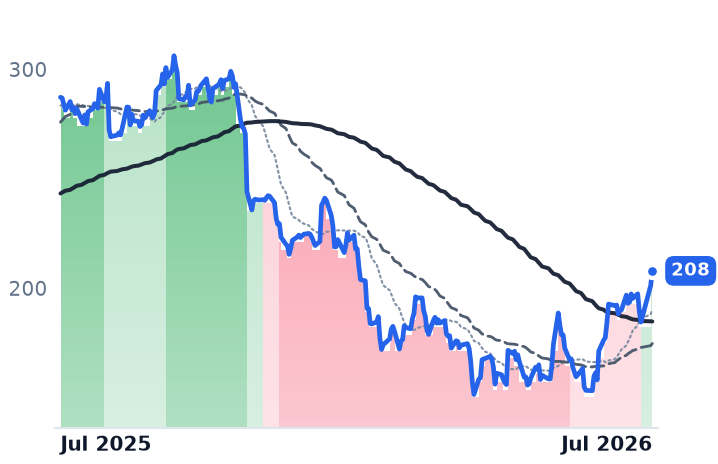
TEAM | Atlassian | Developer Tools & DevOps | 🔴 Cont. Bear | +31.6% | −47.9% |
CRM | Salesforce | Customer Experience & CRM | 🔴 Cont. Bear | +19.3% | −29.1% |
NOW | ServiceNow | Specialized Enterprise Solutions | 🔴 Cont. Bear | +15.8% | −41.7% |
WDAY | Workday | Enterprise Resource Planning | 🔴 Cont. Bear | +36.0% | −29.9% |
INTU | Intuit | Enterprise Resource Planning | 🔴 Cont. Bear | +25.0% | −58.4% |
ADP | Automatic Data Processing | HCM Software & Payroll | 🌱 Emerging Bull | +21.5% | −9.7% |
PAYC | Paycom Software | HR & Workforce Management | 🔴 Cont. Bear | +32.8% | −28.4% |
DOCU | DocuSign | Specialized Enterprise Solutions | 🔴 Cont. Bear | +29.2% | −27.2% |
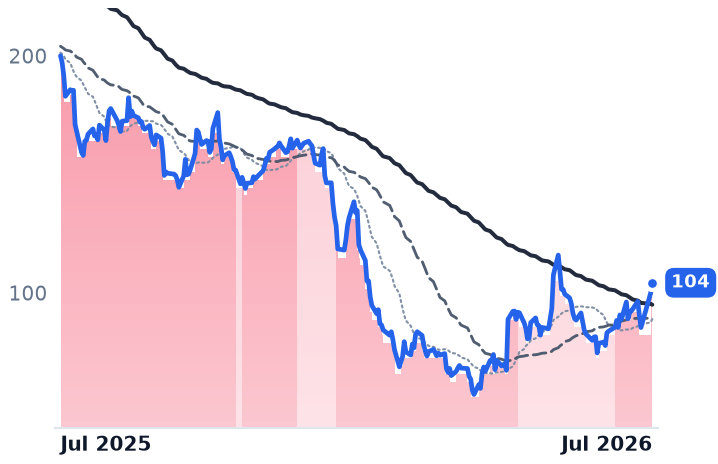
MNDY | monday.com | Other | 🔴 Cont. Bear | +22.6% | −67.8% |
12-month price & trend
| Ticker | Mkt cap | P/E | P/E fwd | P/S | P/S fwd | P/GP | P/GP fwd | EV/EBITDA | FCF yld |
|---|---|---|---|---|---|---|---|---|---|
TWLO | $35.2B | 30.9x | 40.6x | 6.3x | 6.0x | 13.0x | 12.5x | 96.8x | 3.1% |
BILL | $5.0B | n/m | 14.8x | 3.1x | 2.7x | 3.8x | 3.3x | 42.8x | 7.7% |
DT | $14.3B | 96.6x | 24.8x | 6.8x | 6.2x | 8.4x | 7.6x | 43.9x | 4.0% |
| Ticker | Mkt cap | P/E | P/E fwd | P/S | P/S fwd | P/GP | P/GP fwd | EV/EBITDA | FCF yld |
|---|---|---|---|---|---|---|---|---|---|
IOT | $23.0B | 389.3x | 55.9x | 13.3x | 11.4x | 17.4x | 15.0x | 234.7x | 1.0% |
FROG | $11.1B | n/m | 96.0x | 18.5x | 17.5x | 23.8x | 22.5x | n/m | 1.5% |
NTNX | $18.0B | 65.3x | 30.4x | 6.5x | 5.6x | 7.5x | 6.5x | 53.3x | 4.3% |
| Ticker | Mkt cap | P/E | P/E fwd | P/S | P/S fwd | P/GP | P/GP fwd | EV/EBITDA | FCF yld |
|---|---|---|---|---|---|---|---|---|---|
VEEV | $39.4B | 42.1x | 26.8x | 11.9x | 10.8x | 15.9x | 14.4x | 29.0x | 4.2% |
TEAM | $42.8B | n/m | 26.8x | 6.5x | 5.8x | 7.7x | 6.9x | 283.5x | 3.1% |
CRM | $160.7B | 22.6x | 13.9x | 3.8x | 3.5x | 4.8x | 4.5x | 13.8x | 9.1% |
| Ticker | Mkt cap | P/E | P/E fwd | P/S | P/S fwd | P/GP | P/GP fwd | EV/EBITDA | FCF yld |
|---|---|---|---|---|---|---|---|---|---|
NOW | $121.7B | 73.1x | 28.9x | 8.3x | 7.5x | 11.0x | 10.0x | 36.6x | 3.8% |
WDAY | $47.1B | 55.8x | 16.7x | 4.8x | 4.4x | 6.3x | 5.8x | 30.0x | 6.3% |
INTU | $89.0B | 19.7x | 11.9x | 4.3x | 3.7x | 5.2x | 4.6x | 13.0x | 8.7% |
| Ticker | Mkt cap | P/E | P/E fwd | P/S | P/S fwd | P/GP | P/GP fwd | EV/EBITDA | FCF yld |
|---|---|---|---|---|---|---|---|---|---|
ADP | $108.5B | 24.7x | 22.2x | 4.9x | 4.7x | 10.3x | 9.7x | 17.2x | 4.6% |
PAYC | $9.8B | 23.1x | 18.2x | 4.6x | 4.5x | 5.7x | 5.6x | 11.8x | 7.7% |
DOCU | $11.5B | 38.4x | 13.3x | 3.5x | 3.3x | 4.4x | 4.1x | 17.2x | 9.7% |
| Ticker | Mkt cap | P/E | P/E fwd | P/S | P/S fwd | P/GP | P/GP fwd | EV/EBITDA | FCF yld |
|---|---|---|---|---|---|---|---|---|---|
MNDY | $4.7B | 39.8x | 20.3x | 3.6x | 3.2x | 4.1x | 3.6x | 51.1x | 6.4% |
Consensus projections
| Ticker | FY2026E | FY2027E | FY2028E | |
|---|---|---|---|---|
TWLO | Revenue | +16.0% | +10.1% | +10.4% |
| EPS | +19.1% | +16.3% | +15.7% | |
BILL | Revenue | +13.2% | +12.2% | +12.0% |
| EPS | +26.0% | +27.2% | +20.5% | |
DT | Revenue | +18.9% | +15.5% | +14.8% |
| EPS | +22.8% | +17.7% | +15.3% | |
IOT | Revenue | +28.9% | +25.9% | +19.7% |
| EPS | +129.2% | +40.4% | +27.9% | |
FROG | Revenue | +20.6% | +17.5% | +19.4% |
| EPS | +20.4% | +17.6% | +27.4% | |
NTNX | Revenue | +12.1% | +12.8% | +12.5% |
| EPS | +10.9% | +13.6% | +16.3% | |
VEEV | Revenue | +16.3% | +15.1% | +12.0% |
| EPS | +22.7% | +14.1% | +10.7% | |
TEAM | Revenue | +24.7% | +13.4% | +15.9% |
| EPS | +55.5% | +10.5% | +18.0% | |
CRM | Revenue | +9.3% | +11.1% | +9.4% |
| EPS | +17.4% | +20.2% | +10.4% | |
NOW | Revenue | +22.4% | +18.7% | +18.6% |
| EPS | +17.1% | +23.2% | +21.4% | |
WDAY | Revenue | +13.4% | +11.8% | +11.0% |
| EPS | +26.5% | +18.5% | +17.3% | |
INTU | Revenue | +13.9% | +11.3% | +10.8% |
| EPS | +18.5% | +15.0% | +12.6% | |
ADP | Revenue | +7.0% | +5.9% | +5.7% |
| EPS | +11.0% | +10.6% | +9.3% | |
PAYC | Revenue | +7.6% | +7.1% | +8.5% |
| EPS | +29.5% | +15.1% | +10.5% | |
DOCU | Revenue | +8.4% | +8.9% | +7.6% |
| EPS | +6.9% | +19.5% | +12.6% | |
MNDY | Revenue | +19.8% | +16.1% | +16.1% |
| EPS | +7.0% | +21.4% | +10.9% |
Forward fiscal years only. Blank means no analyst coverage for that year.
Two buckets, two different stories
Six of the nine names in the "SAAS Tier 2 / Strong Infrastructure Moats" bucket — TWLO, DT, FROG, NTNX, IOT and VEEV — have actually crossed from bear into bull trend-bands, with five of those crossings clustering between mid-May and early July, well ahead of the late-July market-wide software rotation. Twilio has held a strongly bullish band since mid-April. These moves track real earnings: Nutanix posted ARR growth of 15% year-over-year and raised its full-year revenue and margin guidance; JFrog grew revenue 26% year-over-year with cloud revenue up 50% and now over half the mix, and raised full-year guidance alongside a new Nvidia AI-supply-chain partnership; and Twilio lifted FY26 growth guidance to 14-15% on its consumption-based 'User + Usage' pricing shift, though that same report flags the stock trading roughly 59% above SaaS-sector average P/E. Not every Tier 2 name is participating: TEAM actually backslid into strongly bearish despite a 26% 30-day pop, BILL only softened from strongly bearish to mildly bearish without exiting, and CRM has sat in strongly bearish continuously since January despite its Agentforce ARR narrative.
The back-office bucket's rally looks thinner
The "TechCollapse: Back-Office/Workflow" bucket's roughly +19% 30-day gain is concentrated almost entirely in the week of July 22-28, when enterprise software staged a coordinated rebound — Salesforce up 7%, ServiceNow up 8%, and Workday up 10% — explicitly framed by press coverage as capital rotating out of chip stocks into an "AI monetization" software trade rather than company-specific news, part of a bull case built partly on Salesforce's Agentforce ARR reaching $1.2 billion, up 205% year-over-year. Only ADP and PAYC have actually crossed into bull bands, and both did so in just the past two to three weeks. ServiceNow is the clearest counter-case: it beat and raised guidance on July 22 with subscription revenue up 24.5% and cRPO up 21% — yet its trend-band stayed strongly bearish through July 28. INTU, WDAY, DOCU, MNDY and BILL remain stuck in bear bands despite double-digit bounces.
What's next
Sector-wide, public SaaS EV/NTM-sales multiples have already re-rated roughly 90% off the 2023 trough to around 8.5x, undercutting a blanket "still at trough multiples" case, though legacy slow-growers remain cheap. PE appetite for sub-scale software persists — Dayforce, OneStream and Clearwater Analytics all closed take-privates in 2026 — but none touch these tickers yet. ADP reports July 29, while Workday and Intuit both report around August 20 — the next real tests of whether back-office SaaS follows infrastructure moats out of its bear bands, or stays a rotation-driven bounce.