

Freight Watchlist's Flat Month Hides a Real but Split Bull Turn
Hypothesis Opus 5 · Research Sonnet 5 · Writing Sonnet 5 · Prompt v1.0
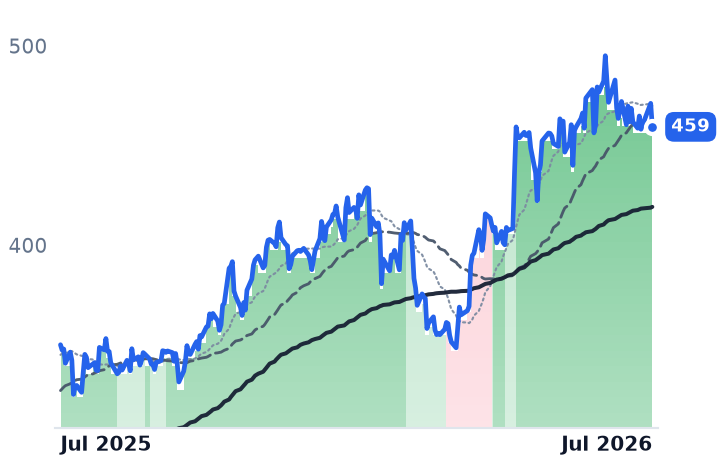
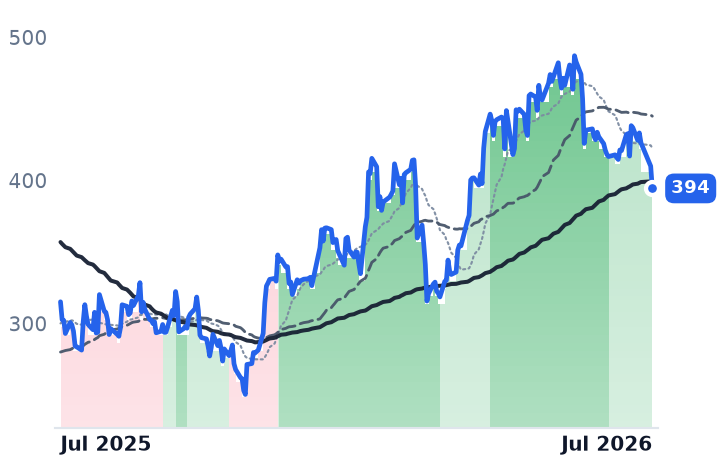
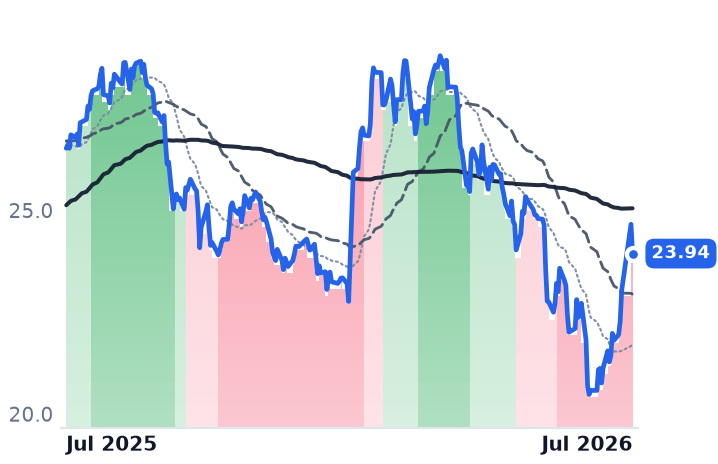
The 17-name Data Center/Logistics/Telecom cohort's headline "+26% year, flat month" masks a bifurcated tape: CSX, JBHT and Ryder carry genuine 100+ day strongly bullish streaks built on earnings-verified volume growth, while Union Pacific and Norfolk Southern's bull bands are only 2-4 weeks old and cluster with merger-review news, and the telecom leg (T, TMUS, VZ, CCOI) is openly bearish.
| Ticker | Company | Segment | Trend · 13mo | 30D | 1Y |
|---|---|---|---|---|---|
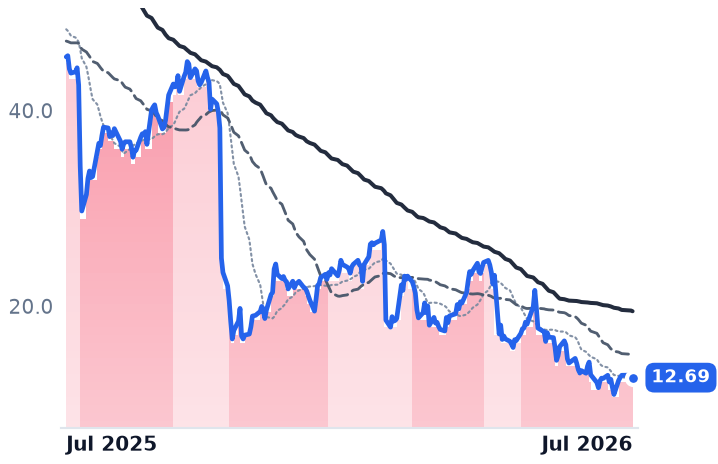
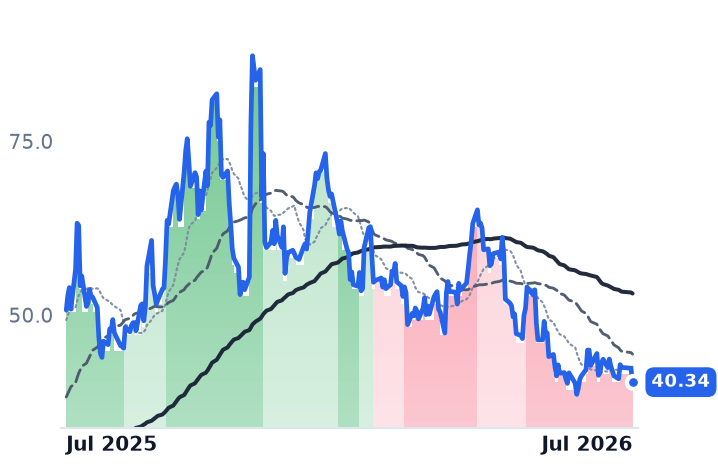
CCOI | Cogent Communications | Technology & Services | 🔴 Cont. Bear | −3.4% | −72.1% |
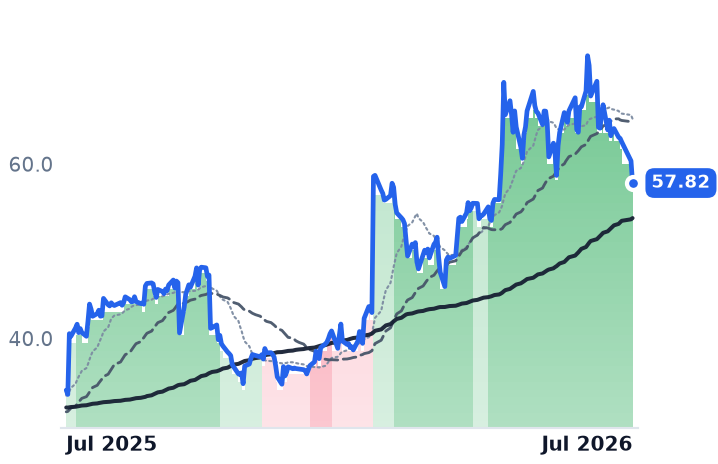
CGNX | Cognex | Precision Motion & Sensors | 🟢 Cont. Bull | −15.4% | +69.7% |
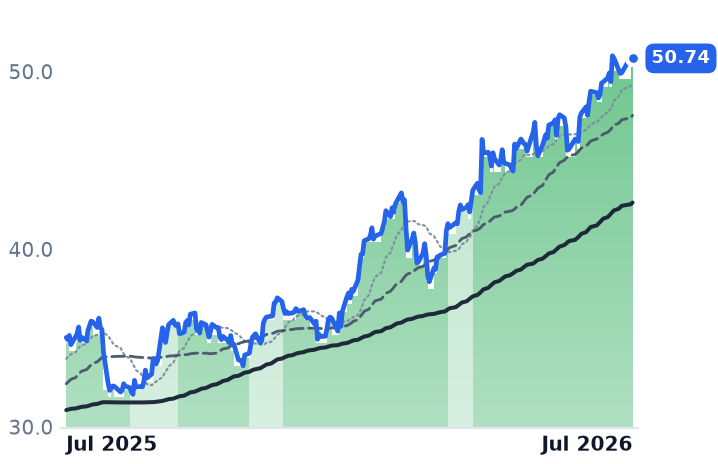
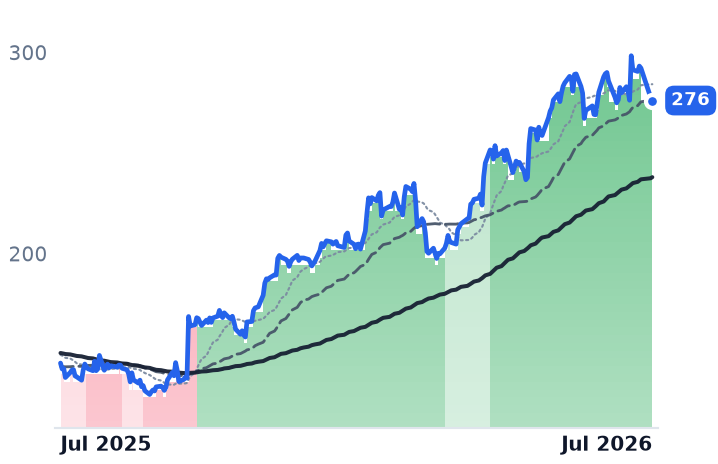
CSX | CSX | Class I Railroads | 🟢 Cont. Bull | +5.7% | +44.8% |
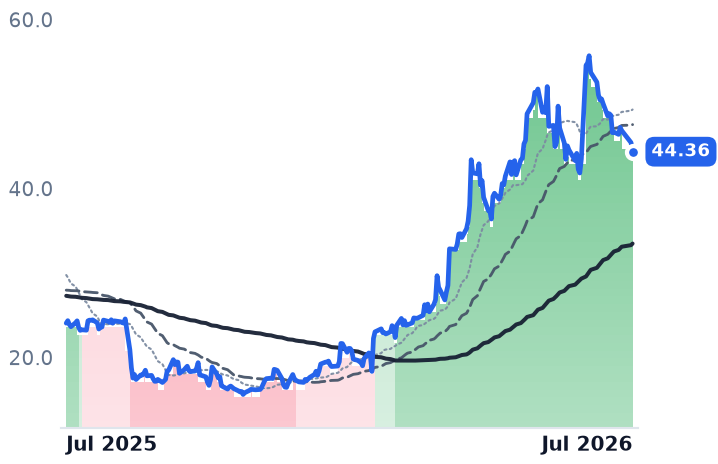
IRDM | Iridium Communications | Specialty & Small Carriers | 🌱 Emerging Bull | −18.7% | +84.4% |
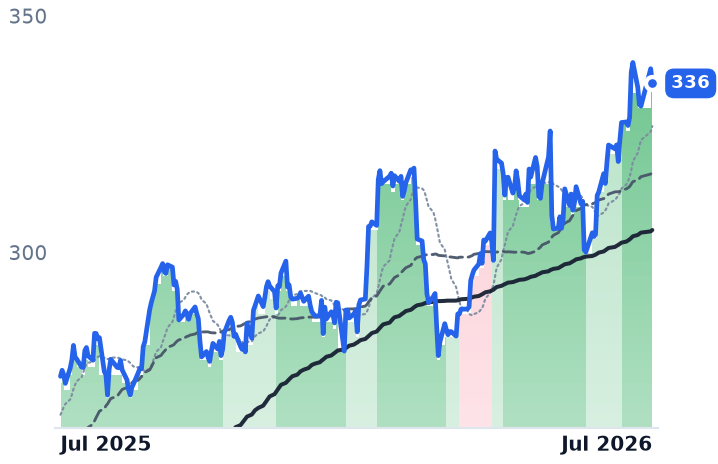
JBHT | J.B. Hunt Transport Services | Truckload & LTL | 🟢 Cont. Bull | −4.1% | +89.6% |
NSC | Norfolk Southern | Class I Railroads | 🟢 Cont. Bull | +6.0% | +22.6% |
ODFL | Old Dominion Freight Line | Less-Than-Truckload (LTL) | 🌱 Emerging Bull | +1.4% | +38.1% |
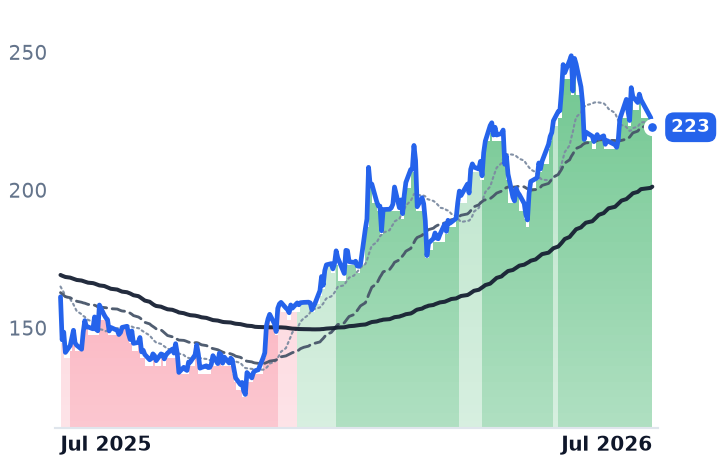
R | Ryder System | Vehicle & Truck Rental | 🟢 Cont. Bull | −2.4% | +46.1% |
ROK | Rockwell Automation | Industrial Automation & Controls | 🟢 Cont. Bull | −4.8% | +31.2% |
SAIA | Saia | Less-Than-Truckload (LTL) | 🟢 Cont. Bull | −7.3% | +25.1% |
SYM | Symbotic | Industrial Automation & Controls | ⚠️ Emerging Bear | −4.3% | −20.4% |
T | AT&T | Wireless Carriers | ⚠️ Emerging Bear | +9.7% | −9.7% |
TMUS | T-Mobile US | Wireless Carriers | 🔴 Cont. Bear | +4.3% | −23.1% |
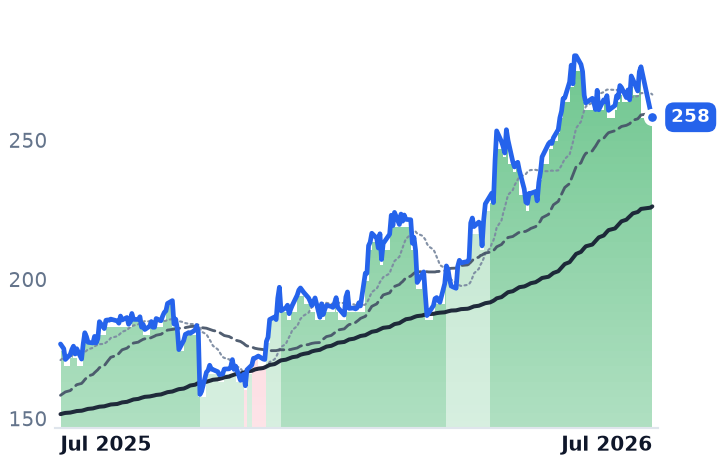
UNP | Union Pacific | Class I Railroads | 🟢 Cont. Bull | +7.1% | +32.9% |
VZ | Verizon Communications | Wireless Carriers | 🟢 Cont. Bull | +7.1% | +16.1% |
WSC | WillScot | Modular & Portable Storage | 🌱 Emerging Bull | −16.1% | −21.9% |
XPO | XPO Logistics | Truckload & LTL | 🟢 Cont. Bull | −3.3% | +48.3% |
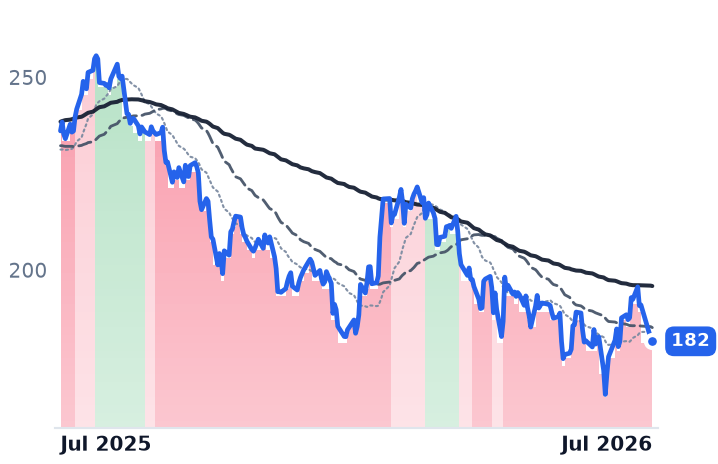
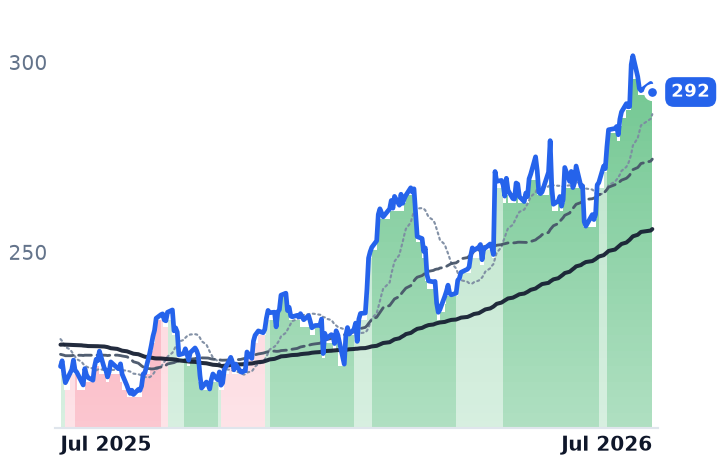
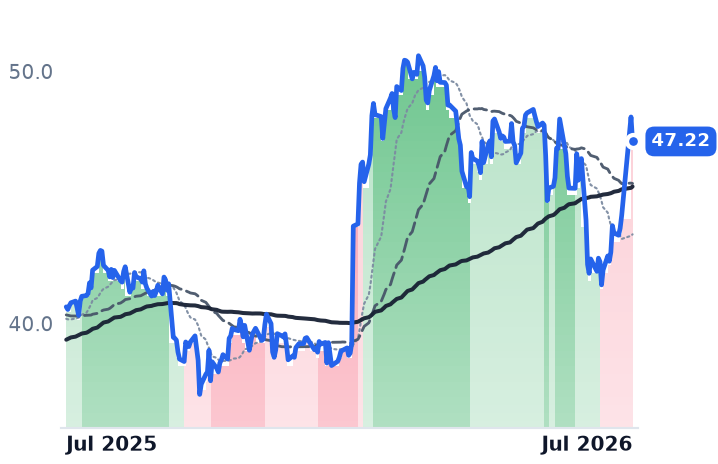
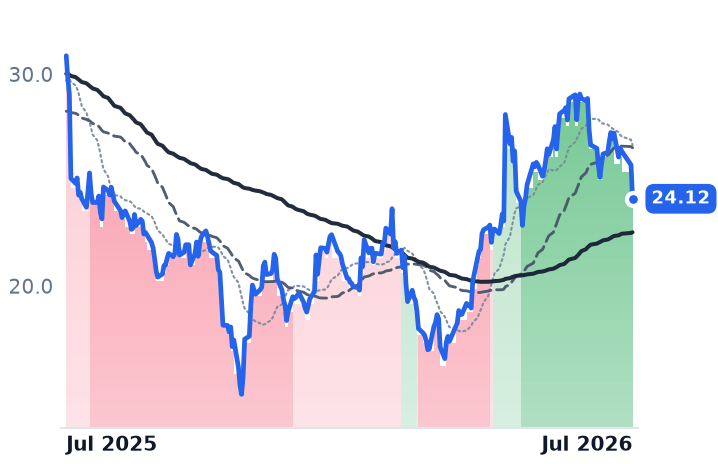
12-month price & trend
| Ticker | Mkt cap | P/E | P/E fwd | P/S | P/S fwd | P/GP | P/GP fwd | EV/EBITDA | FCF yld |
|---|---|---|---|---|---|---|---|---|---|
CCOI | $566.4M | n/m | — | 0.5x | 0.6x | 1.1x | 1.4x | 7.9x | -25.2% |
CGNX | $11.1B | 63.4x | 44.5x | 10.2x | 10.0x | 14.8x | 14.5x | 38.9x | 2.4% |
CSX | $92.9B | 29.0x | 25.0x | 6.4x | 6.1x | 11.7x | 11.1x | 16.6x | 5.4% |
| Ticker | Mkt cap | P/E | P/E fwd | P/S | P/S fwd | P/GP | P/GP fwd | EV/EBITDA | FCF yld |
|---|---|---|---|---|---|---|---|---|---|
IRDM | $5.3B | 57.0x | 48.9x | 6.0x | 5.8x | 8.5x | 8.2x | 16.3x | 5.4% |
JBHT | $26.3B | 39.7x | 35.7x | 2.1x | 1.9x | 12.7x | 11.8x | 16.7x | 4.2% |
NSC | $75.1B | 28.5x | 26.0x | 6.0x | 5.7x | 11.2x | 10.6x | 16.7x | 5.1% |
| Ticker | Mkt cap | P/E | P/E fwd | P/S | P/S fwd | P/GP | P/GP fwd | EV/EBITDA | FCF yld |
|---|---|---|---|---|---|---|---|---|---|
ODFL | $43.9B | 40.6x | 36.3x | 7.8x | 7.4x | 24.7x | 23.5x | 24.0x | 2.5% |
R | $10.1B | 21.4x | 18.0x | 0.8x | 0.8x | 4.2x | 4.0x | 7.1x | 6.8% |
ROK | $49.5B | 41.6x | 33.7x | 5.5x | 5.5x | 10.1x | 10.0x | 29.6x | 3.0% |
| Ticker | Mkt cap | P/E | P/E fwd | P/S | P/S fwd | P/GP | P/GP fwd | EV/EBITDA | FCF yld |
|---|---|---|---|---|---|---|---|---|---|
SAIA | $10.3B | 37.0x | 33.8x | 3.0x | 2.8x | 18.8x | 17.6x | 16.5x | 2.5% |
SYM | $27.2B | 442.1x | 77.9x | 10.3x | 9.7x | 47.6x | 44.9x | 420.0x | 2.7% |
T | $170.5B | 8.2x | 10.6x | 1.3x | 1.3x | 2.2x | 2.2x | 5.9x | 10.4% |
| Ticker | Mkt cap | P/E | P/E fwd | P/S | P/S fwd | P/GP | P/GP fwd | EV/EBITDA | FCF yld |
|---|---|---|---|---|---|---|---|---|---|
TMUS | $195.9B | 19.1x | 16.7x | 2.1x | 2.1x | 3.9x | 3.8x | 10.9x | 7.8% |
UNP | $174.5B | 23.7x | 22.5x | 6.9x | 6.5x | 15.1x | 14.3x | 15.3x | 3.7% |
VZ | $202.4B | 12.6x | 9.7x | 1.5x | 1.4x | 2.5x | 2.4x | 8.1x | 10.6% |
| Ticker | Mkt cap | P/E | P/E fwd | P/S | P/S fwd | P/GP | P/GP fwd | EV/EBITDA | FCF yld |
|---|---|---|---|---|---|---|---|---|---|
WSC | $4.3B | n/m | 21.9x | 1.9x | 1.9x | 3.9x | 3.9x | 22.6x | 12.5% |
XPO | $24.7B | 61.5x | 39.3x | 2.9x | 2.7x | 22.6x | 21.5x | 22.1x | 2.4% |
Consensus projections
| Ticker | FY2026E | FY2027E | FY2028E | |
|---|---|---|---|---|
CCOI | Revenue | −1.6% | +4.5% | +6.4% |
| EPS | −11.7% | −21.4% | −23.5% | |
CGNX | Revenue | +13.2% | +8.9% | +10.4% |
| EPS | +55.4% | +20.7% | +22.8% | |
CSX | Revenue | +7.5% | +5.0% | +3.7% |
| EPS | +22.5% | +13.3% | +10.5% | |
IRDM | Revenue | +4.5% | +4.9% | +9.7% |
| EPS | −4.2% | +33.5% | +20.3% | |
JBHT | Revenue | +13.9% | +9.2% | +7.8% |
| EPS | +29.6% | +29.6% | +19.3% | |
NSC | Revenue | +8.0% | +4.3% | +4.5% |
| EPS | +7.1% | +11.0% | +9.7% | |
ODFL | Revenue | +7.5% | +7.8% | +8.7% |
| EPS | +21.0% | +14.2% | +15.3% | |
R | Revenue | +6.5% | +6.1% | +5.9% |
| EPS | +13.9% | +20.8% | +18.6% | |
ROK | Revenue | +9.9% | +5.5% | +6.3% |
| EPS | +31.2% | +12.2% | +11.9% | |
SAIA | Revenue | +12.1% | +7.7% | +8.1% |
| EPS | +22.0% | +25.4% | +20.2% | |
SYM | Revenue | +25.7% | +29.1% | +23.6% |
| EPS | +123.9% | +54.0% | −2.4% | |
T | Revenue | +3.4% | +2.1% | +2.1% |
| EPS | +13.6% | +9.4% | +13.7% | |
TMUS | Revenue | +7.1% | +4.4% | +4.0% |
| EPS | +10.2% | +27.4% | +20.0% | |
UNP | Revenue | +9.0% | +4.4% | +9.3% |
| EPS | +11.6% | +8.5% | +10.8% | |
VZ | Revenue | +2.3% | +1.7% | +1.1% |
| EPS | +6.8% | +4.7% | +7.1% | |
WSC | Revenue | −0.0% | +3.3% | +4.9% |
| EPS | −3.3% | +22.3% | +34.3% | |
XPO | Revenue | +11.3% | +5.2% | +6.8% |
| EPS | +48.8% | +19.1% | +21.1% |
Forward fiscal years only. Blank means no analyst coverage for that year.
What's actually moving
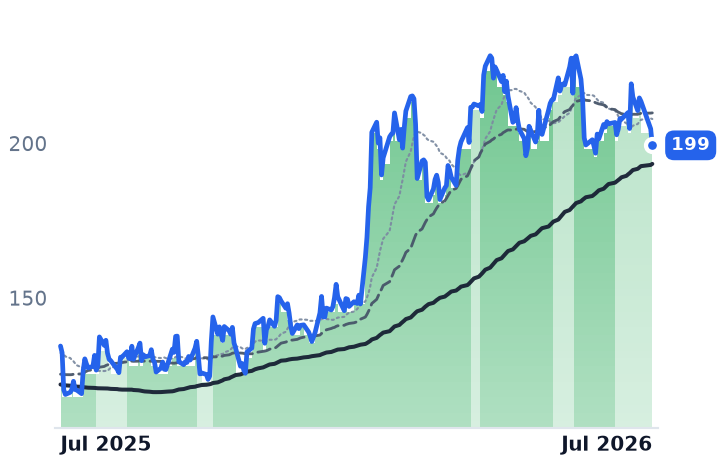
The cohort's trend bands (per trend readings run-length data) show a real cluster of freight names in strongly bullish posture, but the streak lengths matter. CSX has held strongly bullish since April 17 (~103 days) and J.B. Hunt since April 20 (~100 days), while truckload-adjacent Ryder has run strongly bullish since April 20 as well (~100 days). By contrast, Union Pacific flipped to strongly bullish on July 1 (~28 days) and Norfolk Southern on July 10 (~19 days) — both coinciding with Q2 earnings (~July 22-23) and an intensifying Surface Transportation Board review cycle. The STB confirmed UP-Norfolk Southern's merger application as complete effective May 28, with supplemental filings due July 27 and closing not expected until 2027, so a meaningful chunk of the rails' most recent leg looks catalyst-stacked (earnings + deal news) rather than a clean multi-month re-rating.
The fundamentals behind the earlier movers do check out
CSX's Q2 revenue rose 10% to $3.94B on 6% volume growth, and management raised full-year guidance to mid-to-high-single-digit revenue growth. J.B. Hunt posted its first double-digit intermodal volume growth quarter in over a decade, up 10% YoY. Union Pacific's domestic intermodal delivered a fourth consecutive record quarter, up 19%, though international intermodal and coal both fell.
LTL and capacity data are more mixed
Saia's tonnage per workday rose 7.6% in early Q2, genuine volume growth. Old Dominion's revenue gain, however, was almost entirely yield-driven — tons per day actually fell 4.1%, and XPO's tonnage was essentially flat. Market-wide, tender rejections and spot rates back a real capacity story: dry van tender rejections near 17.2%, spot rates at $3.78/mile, the highest since early 2022. The datacenter-freight link shows up concretely in flatbed, where spot rates jumped over 30% YoY in May on datacenter-linked construction demand, and WillScot guided its datacenter vertical to roughly 50% revenue growth — but no rail-carload-specific datacenter linkage was identified.
Why it matters
The telecom leg is the real outlier: T, TMUS and VZ sit in bear/mild-bear bands amid an aggressive wireless price war, and CCOI is down roughly 72% over the year on an unrelated securities-fraud dispute tied to dividend cuts and wavelength-business disclosures. The category-level "flat month, up year" framing obscures both a genuine, earlier-forming freight recovery in CSX/JBHT/Ryder and a much newer, catalyst-driven rail leg riding merger headlines — two different stories wearing one label.