

Software's +30% month is four sessions of rotation, not a band exit
Hypothesis Opus 5 · Research Opus 5 · Writing Opus 5 · Prompt v1.0
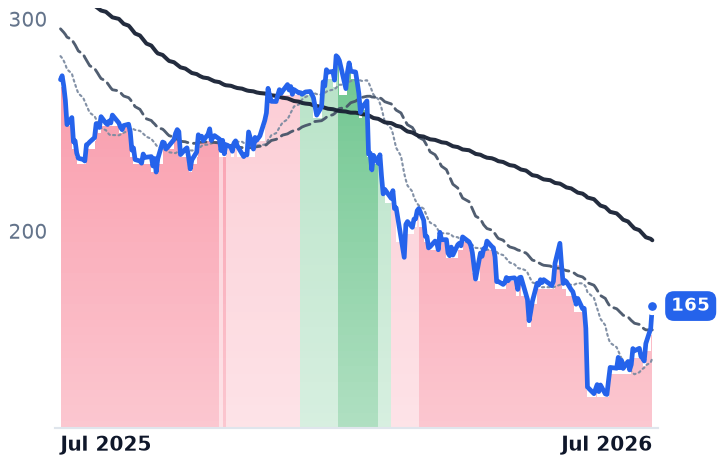
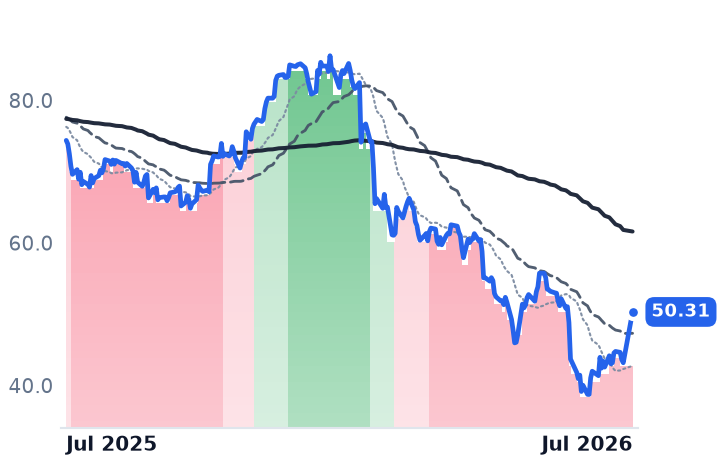
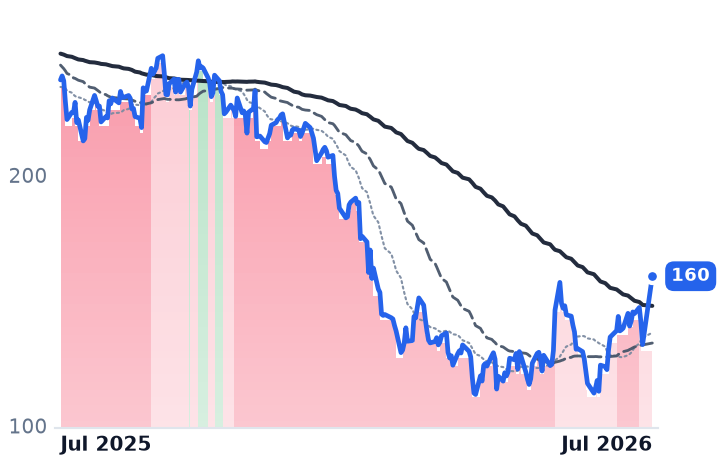
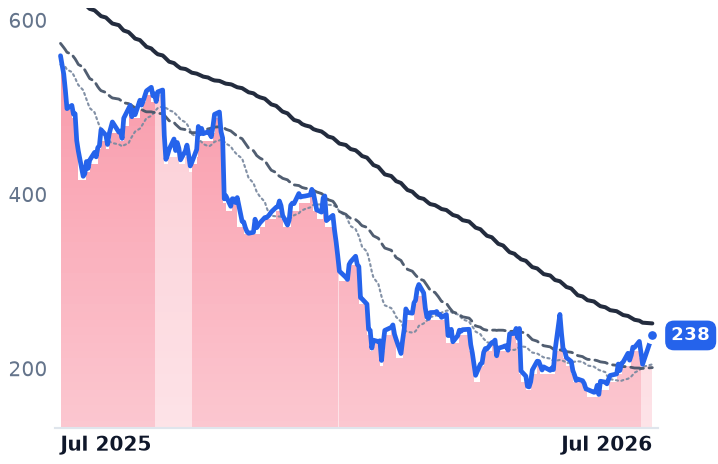
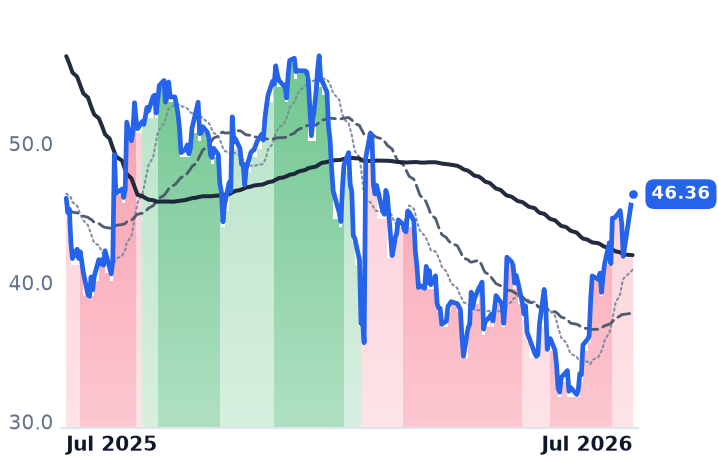
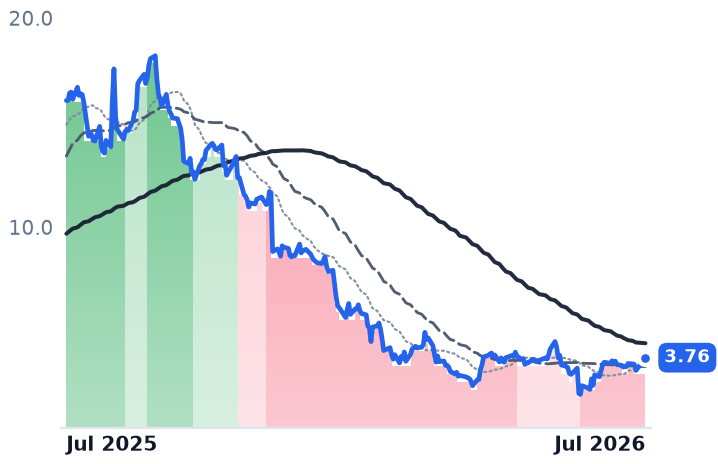
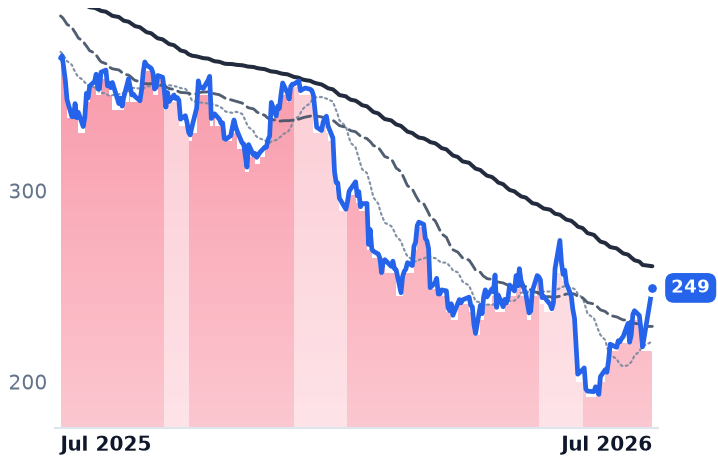
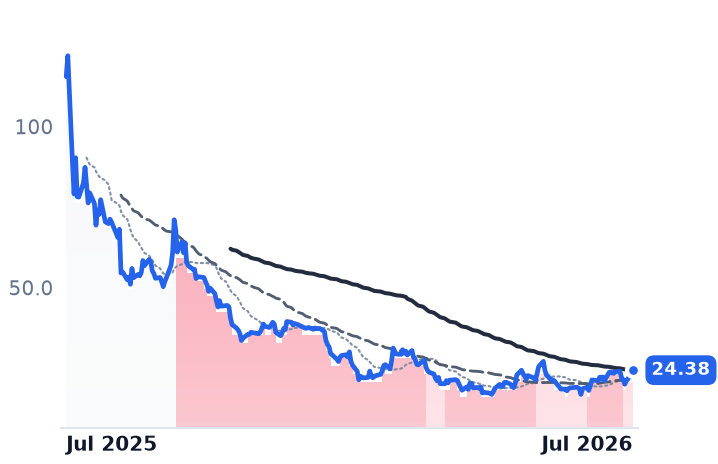
The enterprise-software cohort's ~30% one-month gain is real but compressed: 57-72% of it landed in four sessions from 22-28 July, and not one of the ten names has escaped a bear band. Zero cohort members sit in neutral or bull territory; the best any has managed is mildly bearish.
| Ticker | Company | Segment | Trend · 13mo | 30D | 1Y |
|---|---|---|---|---|---|
ACN | Accenture | Enterprise Consulting & Systems Integration | 🔴 Cont. Bear | +33.6% | −39.3% |
CTSH | Cognizant Technology Solutions | Enterprise Consulting & Systems Integration | 🔴 Cont. Bear | +29.9% | −32.4% |
WDAY | Workday | Enterprise Resource Planning | 🔴 Cont. Bear | +29.2% | −32.9% |
HUBS | HubSpot | Customer Experience & CRM | 🔴 Cont. Bear | +29.0% | −57.4% |
BILL | Bill.com | Fintech & Digital Finance | ⚠️ Emerging Bear | +29.0% | +0.6% |
DOMO | Domo | Software - Application | 🔴 Cont. Bear | +31.9% | −76.6% |
ADBE | Adobe | Design & Content Creation | 🔴 Cont. Bear | +20.7% | −32.6% |
FIG | Figma | Design & Content Creation | 🔴 Cont. Bear | +27.8% | −78.9% |
MNDY | monday.com | Other | 🔴 Cont. Bear | +18.3% | −69.3% |
ZS | Zscaler | AI & Data Intelligence | 🔴 Cont. Bear | +10.2% | −47.5% |
SAP | SAP | Enterprise Resource Planning | 🔴 Cont. Bear | +15.7% | −35.4% |
NOW | ServiceNow | Specialized Enterprise Solutions | 🔴 Cont. Bear | +10.7% | −43.9% |
CRM | Salesforce | Customer Experience & CRM | 🔴 Cont. Bear | +14.9% | −32.4% |
ORCL | Oracle | Cloud Infrastructure & Platforms | 🌱 Emerging Bull | −18.8% | −51.2% |
IBM | International Business Machines | IT Infrastructure & Operations | ⚠️ Emerging Bear | −18.1% | −11.3% |
NVDA | NVIDIA | AI & Data Center GPUs | 🟢 Cont. Bull | +1.0% | +11.5% |
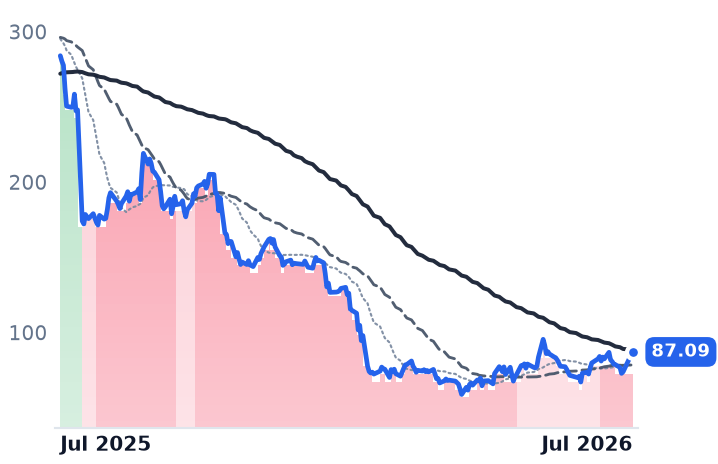
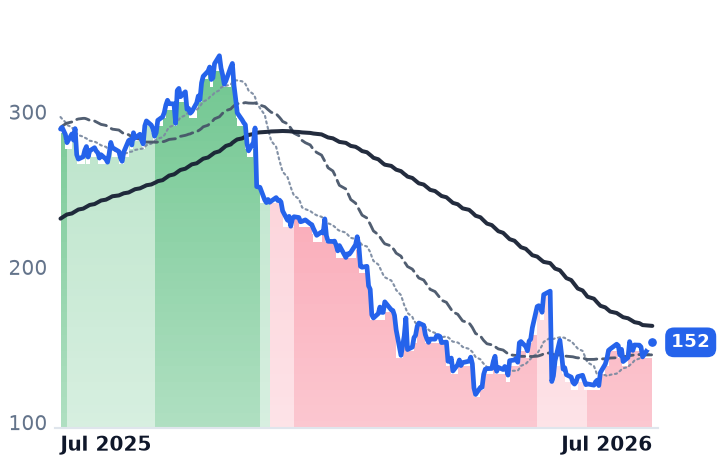
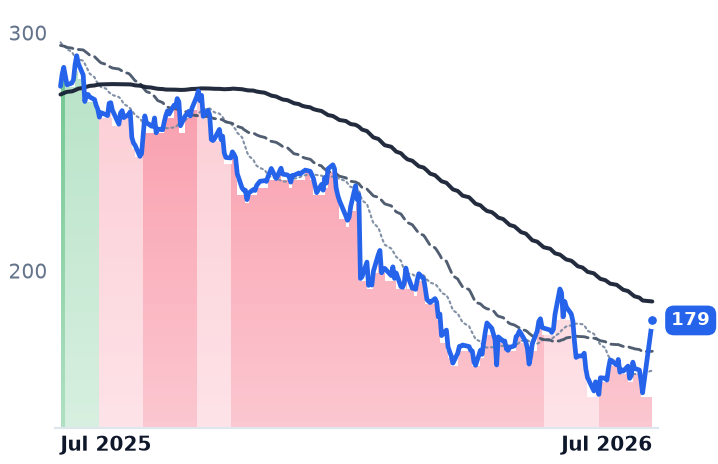
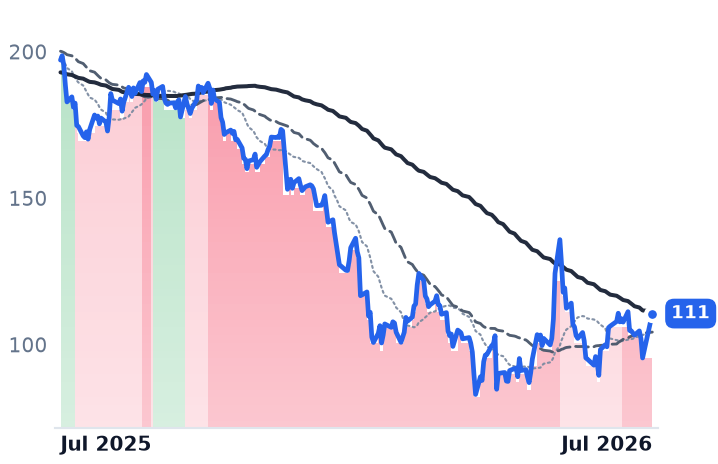
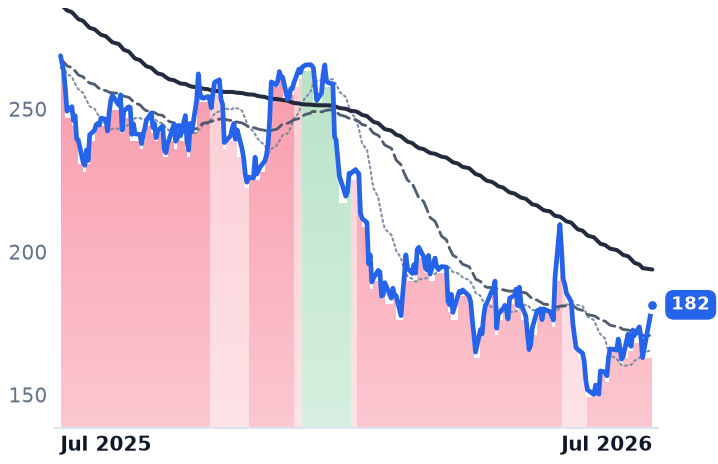
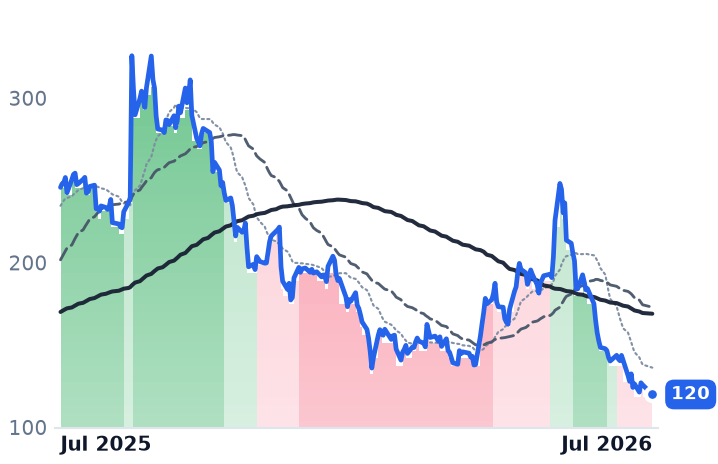
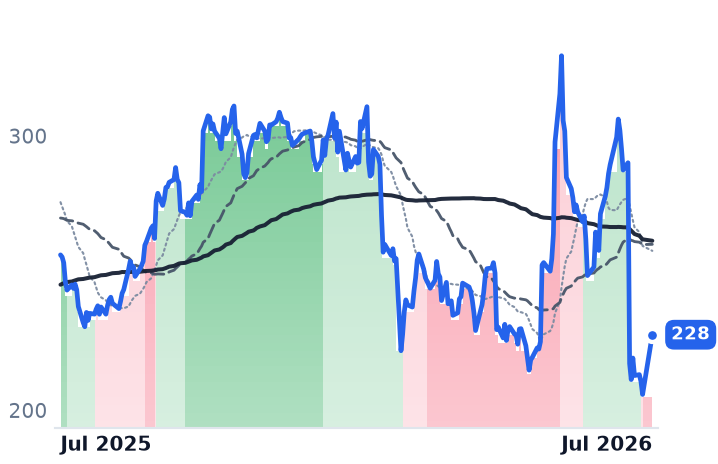
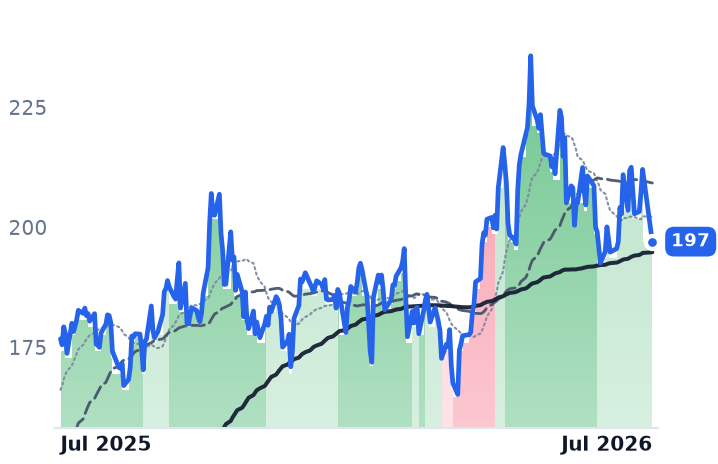
12-month price & trend
| Ticker | Mkt cap | P/E | P/E fwd | P/S | P/S fwd | P/GP | P/GP fwd | EV/EBITDA | FCF yld |
|---|---|---|---|---|---|---|---|---|---|
ACN | $104.0B | 13.5x | 12.3x | 1.4x | 1.4x | 4.5x | 4.4x | 8.1x | 12.1% |
CTSH | $25.5B | 12.1x | 9.8x | 1.2x | 1.1x | 3.7x | 3.6x | 6.7x | 10.2% |
WDAY | $47.1B | 55.8x | 16.7x | 4.8x | 4.4x | 6.3x | 5.8x | 30.0x | 6.3% |
| Ticker | Mkt cap | P/E | P/E fwd | P/S | P/S fwd | P/GP | P/GP fwd | EV/EBITDA | FCF yld |
|---|---|---|---|---|---|---|---|---|---|
HUBS | $11.5B | 79.1x | 17.0x | 3.3x | 3.1x | 4.0x | 3.7x | 37.9x | 6.7% |
BILL | $5.0B | n/m | 14.8x | 3.1x | 2.7x | 3.8x | 3.3x | 42.8x | 7.7% |
DOMO | $156.4M | n/m | 71.3x | 0.5x | 0.5x | 0.7x | 0.7x | n/m | 0.2% |
| Ticker | Mkt cap | P/E | P/E fwd | P/S | P/S fwd | P/GP | P/GP fwd | EV/EBITDA | FCF yld |
|---|---|---|---|---|---|---|---|---|---|
ADBE | $101.0B | 14.5x | 10.4x | 4.0x | 3.8x | 4.5x | 4.3x | 10.4x | 10.5% |
FIG | $12.7B | n/m | 90.8x | 9.9x | 8.6x | 12.5x | 10.9x | n/m | 1.8% |
MNDY | $4.7B | 39.8x | 20.3x | 3.6x | 3.2x | 4.1x | 3.6x | 51.1x | 6.4% |
| Ticker | Mkt cap | P/E | P/E fwd | P/S | P/S fwd | P/GP | P/GP fwd | EV/EBITDA | FCF yld |
|---|---|---|---|---|---|---|---|---|---|
ZS | $29.7B | n/m | 40.1x | 9.4x | 7.6x | 12.2x | 9.9x | 251.1x | 3.2% |
SAP | $217.1B | 23.7x | 26.1x | 5.0x | 5.4x | 6.8x | 7.4x | 12.8x | 4.6% |
NOW | $121.7B | 73.1x | 28.9x | 8.3x | 7.5x | 11.0x | 10.0x | 36.6x | 3.8% |
| Ticker | Mkt cap | P/E | P/E fwd | P/S | P/S fwd | P/GP | P/GP fwd | EV/EBITDA | FCF yld |
|---|---|---|---|---|---|---|---|---|---|
CRM | $160.7B | 22.6x | 13.9x | 3.8x | 3.5x | 4.8x | 4.5x | 13.8x | 9.1% |
ORCL | $433.0B | 25.3x | 18.7x | 6.4x | 4.8x | 9.8x | 7.3x | 17.4x | -5.5% |
IBM | $222.5B | 20.6x | 19.2x | 3.2x | 3.2x | 5.5x | 5.4x | 17.3x | 6.6% |
| Ticker | Mkt cap | P/E | P/E fwd | P/S | P/S fwd | P/GP | P/GP fwd | EV/EBITDA | FCF yld |
|---|---|---|---|---|---|---|---|---|---|
NVDA | $5.5T | 34.3x | 25.0x | 21.5x | 13.9x | 29.0x | 18.7x | 28.3x | 2.2% |
Consensus projections
| Ticker | FY2026E | FY2027E | FY2028E | |
|---|---|---|---|---|
ACN | Revenue | +6.0% | +4.1% | +5.3% |
| EPS | +7.6% | +5.9% | +7.3% | |
CTSH | Revenue | +5.3% | +4.7% | +5.2% |
| EPS | +10.8% | +9.8% | +10.4% | |
WDAY | Revenue | +13.4% | +11.8% | +11.0% |
| EPS | +26.5% | +18.5% | +17.3% | |
HUBS | Revenue | +18.5% | +14.9% | +14.0% |
| EPS | +37.2% | +22.5% | +18.5% | |
BILL | Revenue | +13.2% | +12.2% | +12.0% |
| EPS | +26.0% | +27.2% | +20.5% | |
DOMO | Revenue | +0.5% | −1.2% | +0.8% |
| EPS | −86.9% | −161.9% | +81.1% | |
ADBE | Revenue | +12.0% | +9.1% | +8.8% |
| EPS | +17.2% | +12.7% | +14.2% | |
FIG | Revenue | +40.5% | +23.8% | +24.2% |
| EPS | −24.5% | +26.7% | +34.4% | |
MNDY | Revenue | +19.8% | +16.1% | +16.1% |
| EPS | +7.0% | +21.4% | +10.9% | |
ZS | Revenue | +25.2% | +16.9% | +16.7% |
| EPS | +29.0% | +11.2% | +17.6% | |
SAP | Revenue | +9.3% | +11.6% | +12.1% |
| EPS | +18.7% | +17.0% | +18.3% | |
NOW | Revenue | +22.4% | +18.7% | +18.6% |
| EPS | +17.1% | +23.2% | +21.4% | |
CRM | Revenue | +9.3% | +11.1% | +9.4% |
| EPS | +17.4% | +20.2% | +10.4% | |
ORCL | Revenue | +17.8% | +33.2% | +45.5% |
| EPS | +25.3% | +7.6% | +35.6% | |
IBM | Revenue | +5.0% | +3.9% | +5.1% |
| EPS | +8.4% | +6.8% | +8.6% | |
NVDA | Revenue | +65.1% | +84.2% | +43.2% |
| EPS | +59.0% | +91.7% | +42.0% |
Forward fiscal years only. Blank means no analyst coverage for that year.
What the band data actually says
The hypothesis was that ACN +32%, DOMO +32%, CTSH +30%, WDAY +29%, HUBS +29% and BILL +29% marked a gradual, cohort-wide exit from bear bands. The trend-band history says otherwise. As of 28 July, none of the ten names is in a neutral or bull band. Six upgraded only from strongly bearish to mildly bearish inside two weeks — BILL 7/15, WDAY 7/20, HUBS 7/21, FIG 7/22, MNDY and ZS both 7/28. The two headline leaders, ACN and CTSH, plus ADBE and DOMO, have been strongly bearish on every session since mid-May without interruption.
Nor was the move gradual. Roughly 57-72% of each name's monthly gain occurred between the 22 July and 28 July closes: ACN +17.5%, CTSH +16.5%, WDAY +20.6%, HUBS +16.2%, DOMO +19.4%. SPY fell 0.9% over the same window. The mirror image is semis: MXL -32.1%, AMKR -31.8%, SNDK -31.5%, WOLF -25.2%, ALAB -21.4%, NVDA -7.1%.
The rotation is the story
This is a dateable flow event. IGV and SOXX moved in opposite directions on 32 of the past 60 sessions, the most since the ETFs' 2001 inception, with 60-day correlation near zero versus a 0.75 long-run average. On 27 July Salesforce rose ~7%, ServiceNow ~8% and Workday ~10%, explicitly attributed to rotation out of chips rather than company news. The funding source: the PHLX Semiconductor Index fell from a June peak of 14,655 to 11,194, erasing ~$3.3 trillion of chip market cap. The bounce began six days after OpenAI launched "Presence," the enterprise AI-agent platform TD Cowen blamed for the software selloff — the same shock that made the 22 July low.
The macro legs don't hold
There is no easing tailwind. The 10-year yield topped 4.7% on 23 July, its highest since January 2025, and bond investors are demanding wider spreads from Alphabet, Amazon and Meta over AI capex. Ahead of the 29 July FOMC, prediction markets priced roughly 36% odds of a hike, 64% hold. Fundamentals are thin too: Accenture's 18 June print showed bookings of $19.3bn, -2% YoY, with FY guidance cut and the stock down 18%; its 27 July pop came on AI momentum, leadership news and a $2bn buyback expansion, not new bookings. Cognizant's last print was Q1, with bookings +21%; Q2 lands 29 July, after the move. The genuine fundamental datapoint was SAP's 27% jump in cloud backlog to €22.9bn. And the re-rating is mostly multiple: average SaaS EV/2026E revenue rose from 3.9x to 4.7x while growth estimates moved just 1.2pts.
What's left
Runway exists — ACN sits 23% below its 200-day and 43% below its 52-week high; DOMO is -79.7% from its high. But CNBC notes durable software leadership has been in cybersecurity and data protection, and the bull-band names (DDOG, NET, PANW, SNOW, CRWD-adjacent) are a different cohort entirely. Prior desk analysis on this group conditioned everything on "wait for the trend flip." The bands say that flip has not happened.