

Nuclear's July flush is a lead-lag cascade, not a clean bucket split
Hypothesis Opus 5 · Research Sonnet 5 · Writing Sonnet 5 · Prompt v1.0
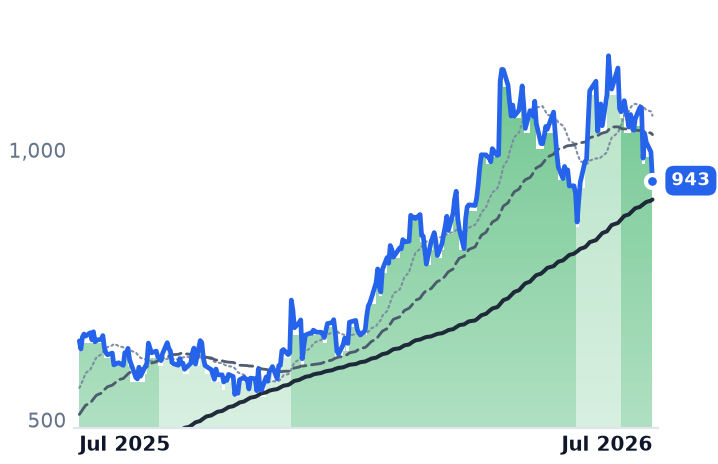
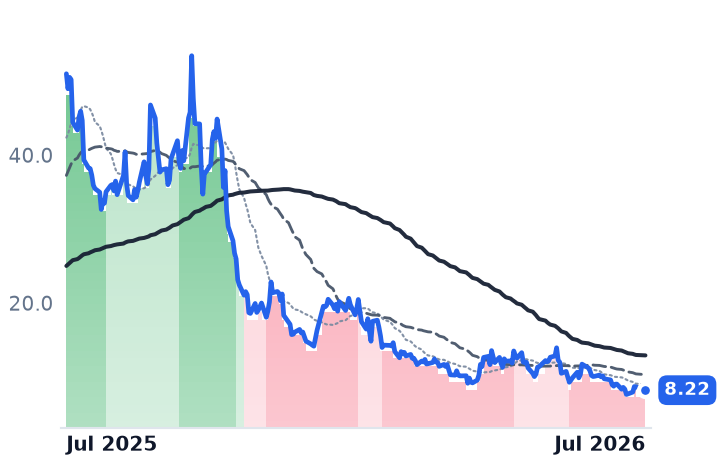
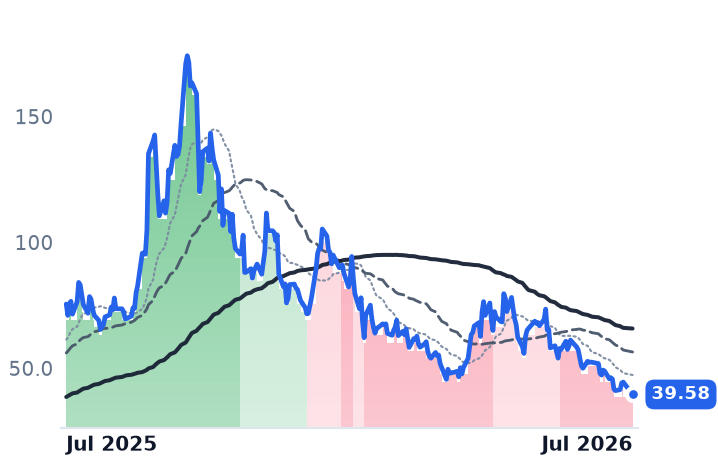
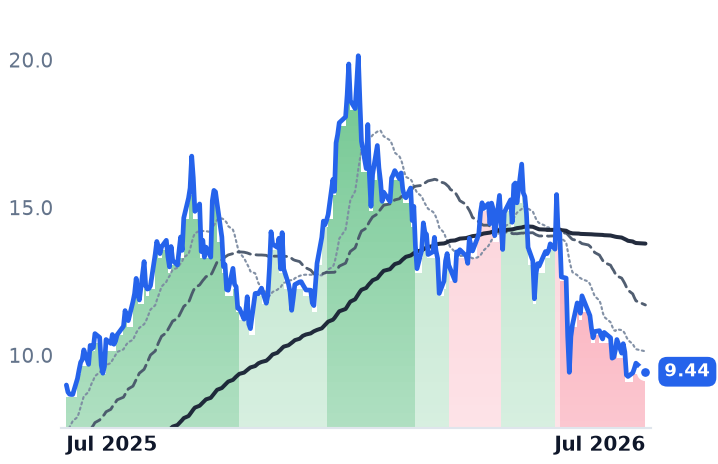
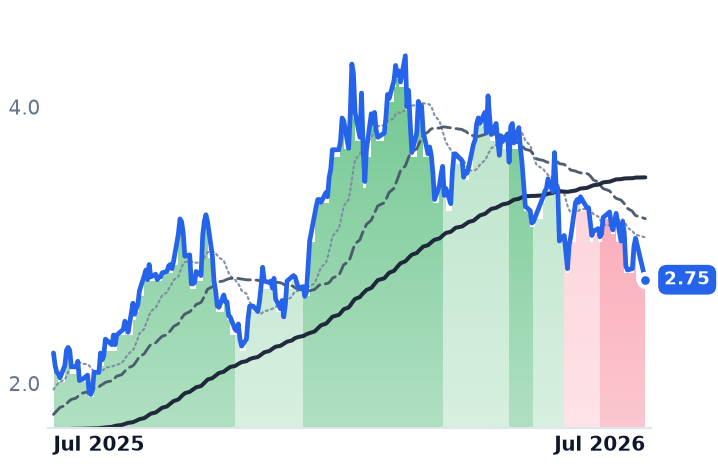
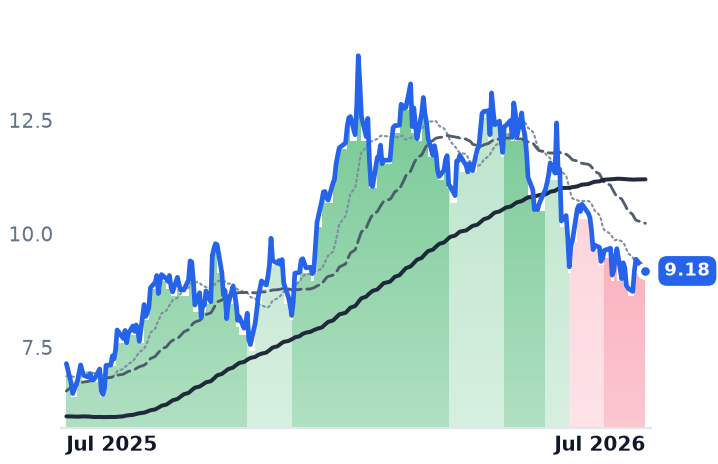
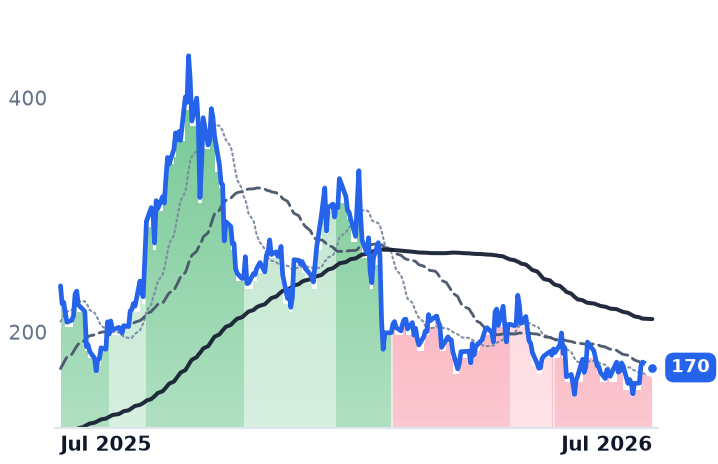
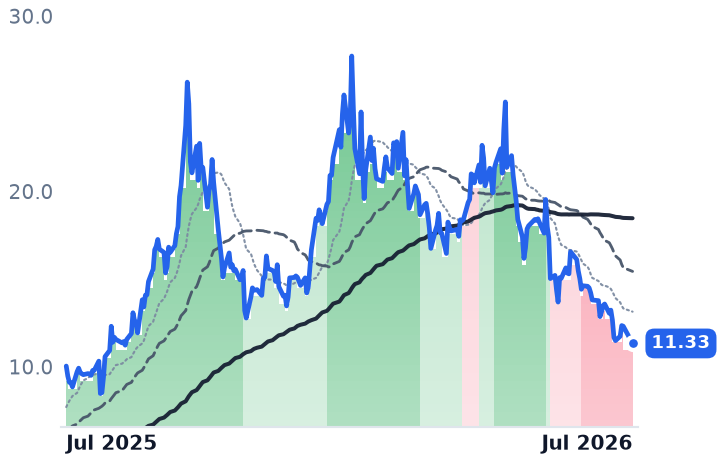
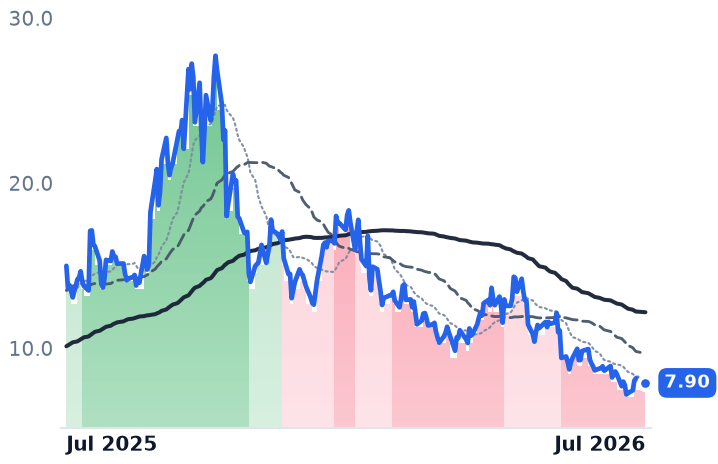
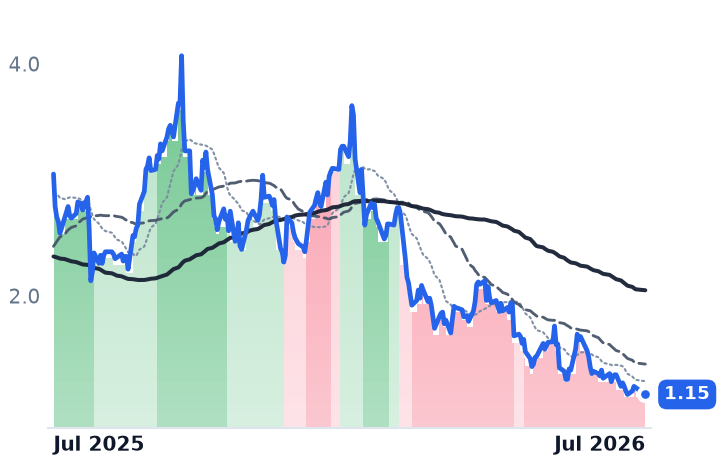
The premise that SMR developers have rolled over while the fuel/OEM leg (CCJ, BWXT, GEV) holds doesn't survive the band data — GE Vernova is still trend-strongly bullish despite an earnings-day EPS miss, while Cameco and BWXT both flipped to strongly bearish on July 7-8, seven months after the developers broke. Fundamentals (uranium term prices, BWXT backlog, hyperscaler PPA cadence, DOE loan support) mostly haven't deteriorated, framing this as a multiple reset with Cameco's Q2 print (7/31) and BWXT's (8/3) as the near-term arbiters.
| Ticker | Company | Segment | Trend · 13mo | 30D | 1Y |
|---|---|---|---|---|---|
| The subject · what this brief is about | |||||
GEV | GE Vernova | GE Vernova Integrated | 🟢 Cont. Bull | −14.4% | +45.9% |
SMR | NuScale Power | Advanced Nuclear | 🔴 Cont. Bear | −19.9% | −83.9% |
OKLO | Oklo | Emerging & Specialized Energy | ⚠️ Emerging Bear | −25.0% | −47.6% |
XE | X-Energy | Power & Propulsion Systems | 🔴 Cont. Bear | −16.1% | −45.9% |
NNE | Nano Nuclear Energy | Power & Propulsion Systems | ⚠️ Emerging Bear | −24.7% | −57.6% |
CCJ | Cameco | Uranium | ⚠️ Emerging Bear | −16.0% | +10.1% |
BEP | Brookfield Renewable Partners | Diversified Renewable Generators | 🟢 Cont. Bull | −8.3% | +18.1% |
BWXT | BWX Technologies | Naval & Shipbuilding | ⚠️ Emerging Bear | −10.3% | +13.7% |
| Compared against · context, not the story | |||||
UEC | Uranium Energy | Uranium | ⚠️ Emerging Bear | −12.8% | +5.0% |
DNN | Denison Mines | Uranium | ⚠️ Emerging Bear | −11.9% | +23.9% |
NXE | NexGen Energy | Uranium | ⚠️ Emerging Bear | −5.4% | +28.6% |
LEU | Centrus Energy | Uranium | ⚠️ Emerging Bear | +5.9% | −29.1% |
UUUU | Energy Fuels | Uranium | ⚠️ Emerging Bear | −22.3% | +12.8% |
LTBR | Lightbridge | Electrical Equipment & Parts | ⚠️ Emerging Bear | −9.9% | −47.3% |
EU | enCore Energy | Uranium | ⚠️ Emerging Bear | −13.5% | −62.3% |
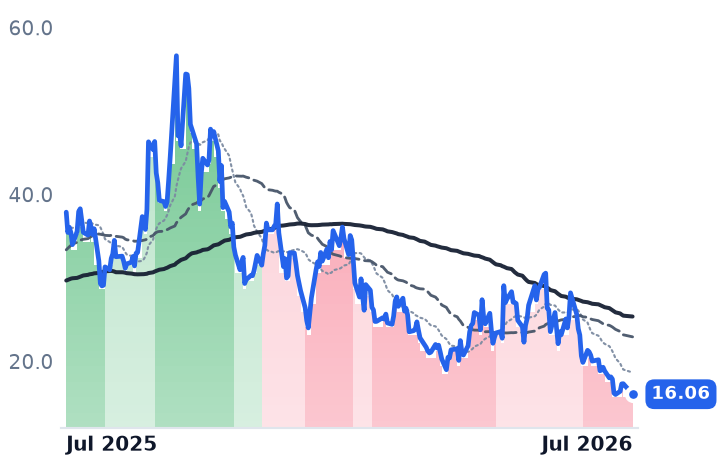
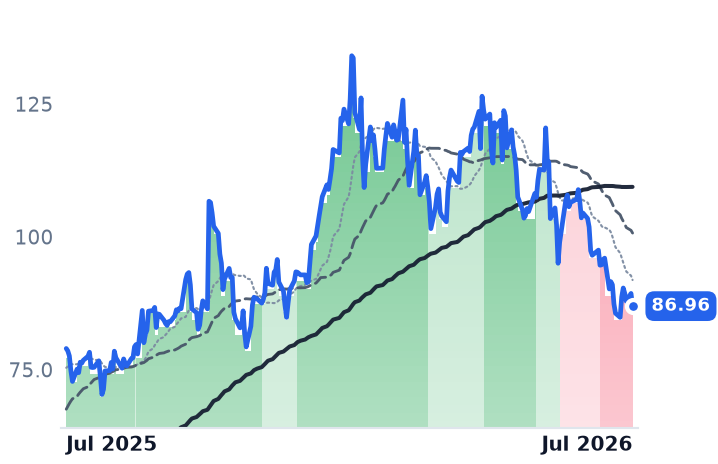
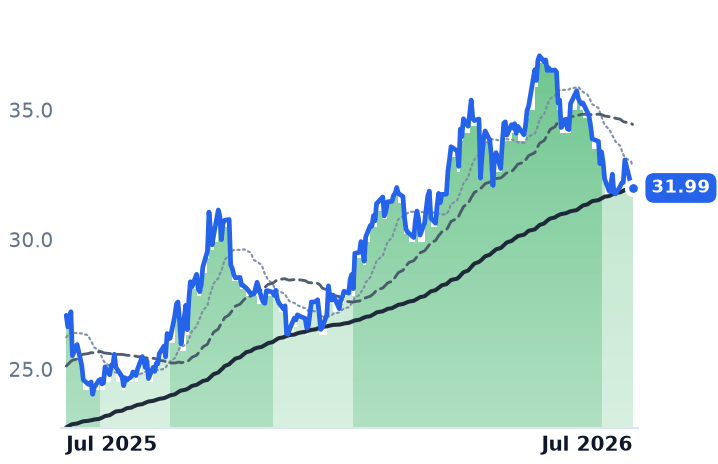
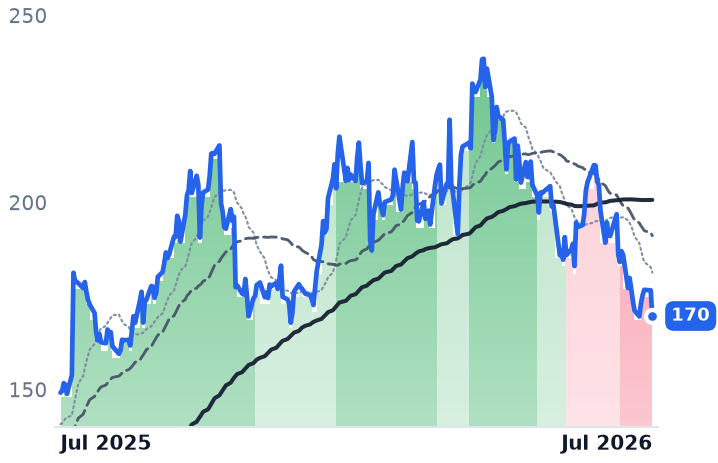
12-month price & trend
| Ticker | Mkt cap | P/E | P/E fwd | P/S | P/S fwd | P/GP | P/GP fwd | EV/EBITDA | FCF yld |
|---|---|---|---|---|---|---|---|---|---|
GEV | $268.1B | 28.6x | 32.8x | 6.5x | 5.8x | 32.1x | 28.8x | 29.9x | 4.6% |
SMR | $2.8B | n/m | — | 261.9x | 91.1x | — | 432.7x | n/m | -27.7% |
OKLO | $7.7B | n/m | — | — | — | — | — | n/m | -3.6% |
| Ticker | Mkt cap | P/E | P/E fwd | P/S | P/S fwd | P/GP | P/GP fwd | EV/EBITDA | FCF yld |
|---|---|---|---|---|---|---|---|---|---|
XE | $381.7M | n/m | — | 3.5x | 1.8x | — | — | 0.3x | -70.0% |
NNE | $1.1B | n/m | — | — | 887.7x | — | — | n/m | -3.7% |
CCJ | $42.6B | 165.8x | 59.6x | 17.0x | 12.1x | 61.6x | 43.8x | 68.3x | 0.9% |
| Ticker | Mkt cap | P/E | P/E fwd | P/S | P/S fwd | P/GP | P/GP fwd | EV/EBITDA | FCF yld |
|---|---|---|---|---|---|---|---|---|---|
BEP | $10.6B | 75.5x | — | 1.7x | 1.6x | 6.9x | 6.4x | 10.0x | -44.4% |
BWXT | $15.9B | 44.6x | 36.5x | 4.5x | 4.2x | 20.5x | 19.0x | 31.2x | 2.0% |
UEC | $5.5B | n/m | — | 274.6x | 55.3x | 648.9x | 130.6x | n/m | -2.2% |
| Ticker | Mkt cap | P/E | P/E fwd | P/S | P/S fwd | P/GP | P/GP fwd | EV/EBITDA | FCF yld |
|---|---|---|---|---|---|---|---|---|---|
DNN | $2.9B | n/m | — | 988.4x | 120.1x | — | — | n/m | -4.1% |
NXE | $6.9B | n/m | — | n/m | — | — | — | n/m | -2.5% |
LEU | $3.6B | 75.8x | 74.3x | 7.6x | 7.9x | 32.7x | 33.8x | 40.1x | -6.2% |
| Ticker | Mkt cap | P/E | P/E fwd | P/S | P/S fwd | P/GP | P/GP fwd | EV/EBITDA | FCF yld |
|---|---|---|---|---|---|---|---|---|---|
UUUU | $3.7B | n/m | — | 35.0x | 25.0x | 80.8x | 57.9x | n/m | -3.0% |
LTBR | $297.0M | n/m | — | n/m | — | — | — | n/m | -5.7% |
EU | $363.2M | n/m | — | 8.8x | 4.1x | 39.1x | 18.2x | n/m | -12.1% |
Consensus projections
| Ticker | FY2026E | FY2027E | FY2028E | |
|---|---|---|---|---|
GEV | Revenue | +23.4% | +14.6% | +15.3% |
| EPS | +322.4% | −19.0% | +40.3% | |
SMR | Revenue | −26.7% | +434.9% | +101.2% |
| EPS | −74.7% | +33.4% | −18.3% | |
OKLO | Revenue | — | +364.3% | +700.0% |
| EPS | +20.2% | +14.2% | +12.2% | |
XE | Revenue | +83.1% | +253.8% | +46.2% |
| EPS | −98.0% | −1.4% | −33.6% | |
NNE | Revenue | +1684.0% | +356.5% | +39.0% |
| EPS | −23.4% | +55.2% | +34.3% | |
CCJ | Revenue | +2.8% | +10.6% | +9.5% |
| EPS | +14.2% | +60.9% | +20.5% | |
BEP | Revenue | +6.1% | +11.0% | −0.0% |
| EPS | +4.7% | −20.8% | +4.8% | |
BWXT | Revenue | +20.2% | +9.9% | +7.5% |
| EPS | +24.1% | +11.5% | +11.3% | |
UEC | Revenue | −59.3% | +272.6% | +157.9% |
| EPS | +58.7% | −79.8% | −647.6% | |
DNN | Revenue | +394.2% | −27.3% | +1699.7% |
| EPS | −30.5% | −73.1% | −363.0% | |
NXE | Revenue | −68.7% | +131.4% | +32282.1% |
| EPS | −9.1% | −31.8% | +23.4% | |
LEU | Revenue | +2.5% | +5.4% | −12.9% |
| EPS | −42.9% | +7.1% | −26.3% | |
UUUU | Revenue | +152.8% | +63.3% | +59.0% |
| EPS | −52.3% | −188.4% | +252.4% | |
EU | Revenue | +101.0% | +20.6% | +72.5% |
| EPS | −66.0% | −114.4% | +1843.9% |
Forward fiscal years only. Blank means no analyst coverage for that year.
The hypothesis frames the nuclear trade as splitting into two buckets — pre-revenue SMR developers breaking while fuel and large-reactor OEM names hold. The trend-band data says otherwise: this looks like a single cohort rolling over in sequence, not a fundamentals-driven bifurcation.
The bands don't split cleanly
GE Vernova's own trend band is still strongly bullish as of today, unchanged despite Wednesday's -5.3% single-day move. That move was an earnings-day reaction — GEV's Q2 2026 adjusted EPS of $2.47 missed the $3.04 consensus on a -$275M Wind-segment loss, even as revenue beat, orders jumped 88% YoY to $24.2B, and backlog hit a record $176B. The company also signed two additional SMR early-work agreements and continues advancing its BWRX-300 project — the nuclear-adjacent leg is expanding, not shrinking.
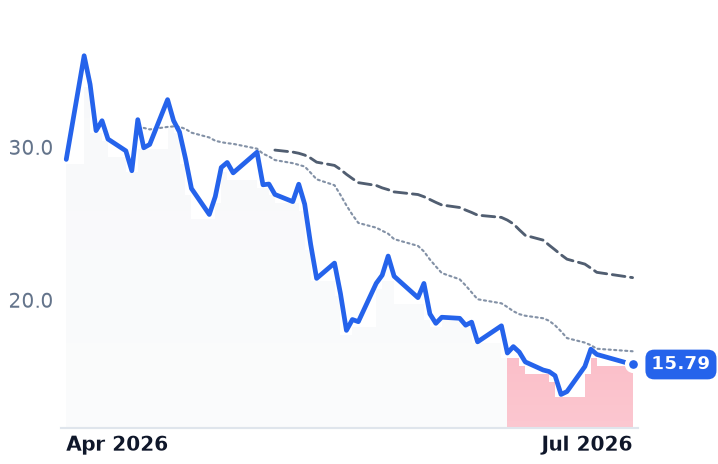
Meanwhile the "still bullish" label on the CCJ/BWXT/BEP bucket is stale for two of three names. CCJ and BWXT both flipped to strongly bearish on July 7 and July 8 respectively, over 30-day windows both are down double digits (CCJ -16.0%, BWXT -10.3% against BEP's milder -8.3%), and only BEP still sits in an unambiguous bull band (downgraded from strongly bullish to mildly bullish on July 8). That's not "fuel/OEM holding" — it's the same rollover arriving later. SMR developers (SMR, OKLO, XE, NNE) entered strongly bearish between December 2025 and February 2026; uranium miners followed in June; Cameco and BWXT broke last, in early July. All ten-plus names in the complex now sit at the bottom trend score.
Fundamentals haven't moved in step with price
The underlying data mostly contradicts a fundamental turn. Uranium term pricing has ground up to roughly $86/lb, up 8.86% year-to-date, even as spot slid from above $101 to the mid-$80s. Cameco reaffirmed 2026 production guidance after a brief, supply-side Cigar Lake suspension. BWXT raised 2026 EBITDA guidance to $650-665M on a 77% backlog jump to $8.65B, yet still fell nearly 14% on doubled volume. Hyperscaler nuclear demand hasn't cooled either — all four major hyperscalers had signed nuclear deals by May 2026, totaling 9.8-10 GW, and DOE has committed $17.5B in loans to the nuclear supply chain.
The one clear exception is NuScale: quarterly revenue collapsed from roughly $8M to $0.6M, alongside securities-fraud litigation — a genuine operational break rather than pure multiple compression. The broader developer-cohort flush also has a dated trigger: Truist initiated coverage of the pre-revenue SMR names at Hold in mid-July, and each fell 8-9% that session.
What's next
Consensus price targets still sit well above spot for both CCJ ($133.78) and BWXT ($229), even as BofA trimmed its Cameco target. Cameco reports Q2 results before the open on July 31, and BWXT follows on August 3 — the two prints most likely to determine whether the complex's de-rating is a valuation reset or the start of a fundamentals-driven turn.