

The AI content/data-services cohort has no breadth — and Indian IT is bouncing
Prompt v1.0
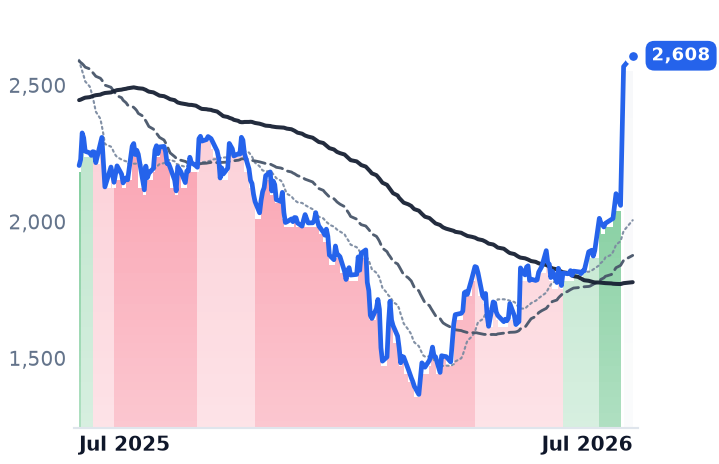
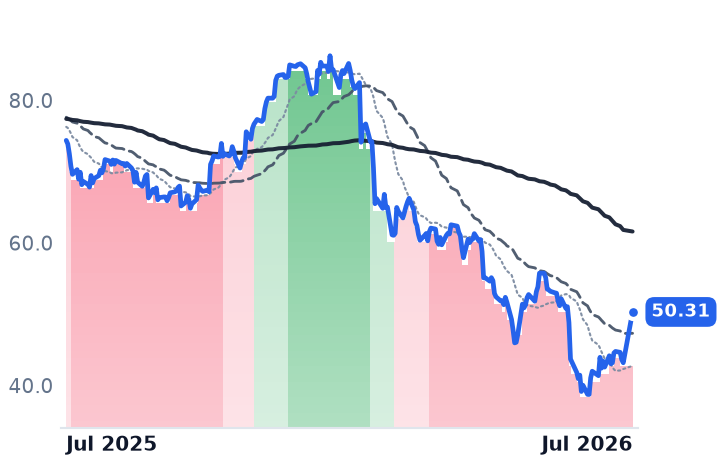
MPS's +42% month is really two sessions at a 20% upper circuit on 80x volume, and the cohort meant to confirm it doesn't exist: Tata Elxsi is at a 52-week low, TaskUs is 71% below its high, Firstsource is -26% on the year. Meanwhile large-cap Indian IT rose 12.2% in July on a broker upgrade — a sector-wide bounce, not a rotation into content operations.
| Ticker | Company | Segment | Trend · 13mo | 30D | 1Y |
|---|---|---|---|---|---|
MPSLTD.BO | MPS | Publishing | 🔴 Cont. Bear | +38.0% | +18.2% |
ECLERX.NS | ECLERX.NS | — | 🔴 Cont. Bear | — | — |
FSL.NS | FSL.NS | — | 🔴 Cont. Bear | — | — |
TATAELXSI.NS | TATAELXSI.NS | — | 🔴 Cont. Bear | — | — |
TASK | TASK | — | 🔴 Cont. Bear | — | — |
IBEX | IBEX | — | 🔴 Cont. Bear | — | — |
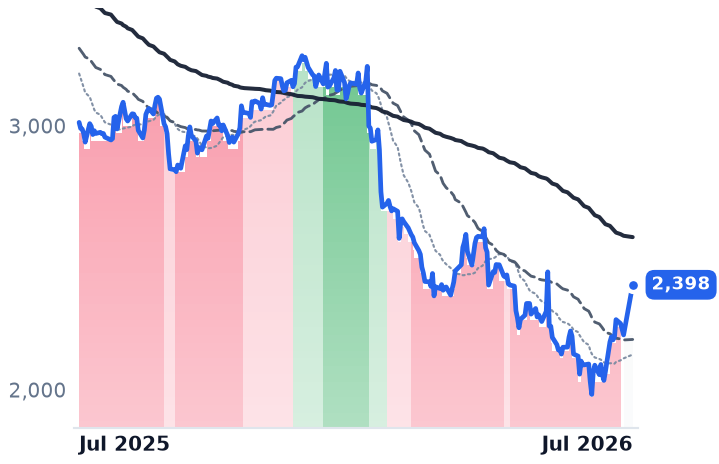
TCS.NS | Tata Consultancy Services | Information Technology Services | 🔴 Cont. Bear | +14.3% | −20.4% |
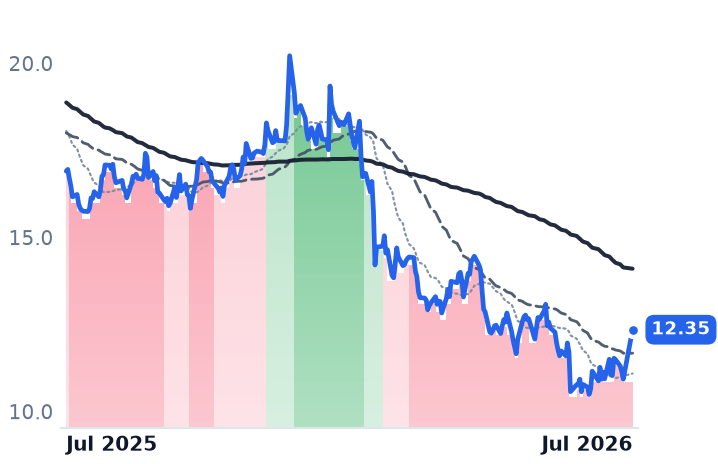
INFY | Infosys | Enterprise Consulting & Systems Integration | 🔴 Cont. Bear | +15.4% | −26.9% |
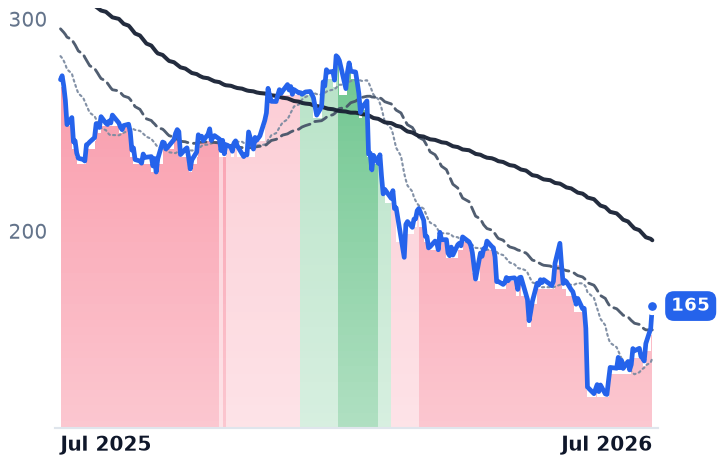
ACN | Accenture | Enterprise Consulting & Systems Integration | 🔴 Cont. Bear | +33.6% | −39.3% |
CTSH | Cognizant Technology Solutions | Enterprise Consulting & Systems Integration | 🔴 Cont. Bear | +29.9% | −32.4% |
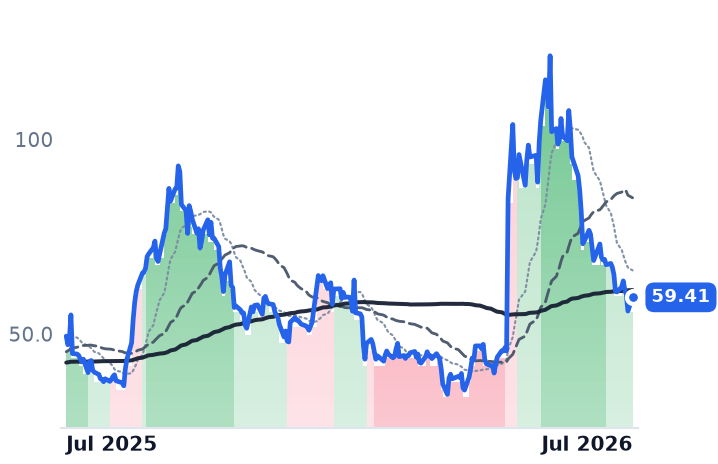
INOD | Innodata | Business Process & Analytics Services | 🟢 Cont. Bull | — | — |
12-month price & trend
| Ticker | Mkt cap | P/E | P/E fwd | P/S | P/S fwd | P/GP | P/GP fwd | EV/EBITDA | FCF yld |
|---|---|---|---|---|---|---|---|---|---|
MPSLTD.BO | $31.1B | 17.9x | 16.3x | 4.2x | 3.4x | 5.2x | 4.2x | 12.9x | 3.2% |
ECLERX.NS | — | — | — | — | — | — | — | — | — |
FSL.NS | — | — | — | — | — | — | — | — | — |
| Ticker | Mkt cap | P/E | P/E fwd | P/S | P/S fwd | P/GP | P/GP fwd | EV/EBITDA | FCF yld |
|---|---|---|---|---|---|---|---|---|---|
TCS.NS | $8.6T | 17.2x | 15.4x | 3.1x | 2.9x | 8.2x | 7.8x | 11.8x | 5.8% |
INFY | $47.1B | 14.2x | 14.6x | 2.3x | 2.3x | 7.7x | 7.7x | 9.1x | 8.1% |
ACN | $104.0B | 13.5x | 12.3x | 1.4x | 1.4x | 4.5x | 4.4x | 8.1x | 12.1% |
| Ticker | Mkt cap | P/E | P/E fwd | P/S | P/S fwd | P/GP | P/GP fwd | EV/EBITDA | FCF yld |
|---|---|---|---|---|---|---|---|---|---|
CTSH | $25.5B | 12.1x | 9.8x | 1.2x | 1.1x | 3.7x | 3.6x | 6.7x | 10.2% |
INOD | $2.1B | 44.7x | 59.1x | 6.6x | 5.8x | 15.4x | 13.7x | 27.4x | 10.5% |
Consensus projections
| Ticker | FY2026E | FY2027E | FY2028E | FY2029E | |
|---|---|---|---|---|---|
MPSLTD.BO | Revenue | +5.5% | +17.7% | +14.1% | — |
| EPS | +14.0% | +16.8% | +18.4% | — | |
TCS.NS | Revenue | +4.0% | +8.9% | +3.9% | — |
| EPS | +4.0% | +9.1% | +4.0% | — | |
INFY | Revenue | +1.6% | +4.0% | +3.7% | — |
| EPS | +2.3% | +4.3% | +4.6% | — | |
ACN | Revenue | +6.0% | +4.1% | +5.3% | — |
| EPS | +7.6% | +5.9% | +7.3% | — | |
CTSH | Revenue | +5.3% | +4.7% | +5.2% | — |
| EPS | +10.8% | +9.8% | +10.4% | — | |
INOD | Revenue | +43.5% | +28.4% | — | −64.1% |
| EPS | +23.0% | +60.1% | — | −53.9% |
Forward fiscal years only. Blank means no analyst coverage for that year.
The cohort doesn't hold together
The test for an early sub-sector uptrend is breadth: three or more names moving to better trend bands and sitting above their 200-day averages. It fails on inspection. Tata Elxsi hit a 52-week low on 15 July and is down 44% over twelve months, after a Q1 FY27 in which revenue crossed ₹1,000 crore for the first time but EBITDA margin fell 340bps QoQ to 21.2%. TaskUs traded at $5.31 against a $18.39 52-week high. Firstsource sat at ₹253.6, down 25.9% over twelve months, with Q1 not due until 6 August — no catalyst inside the window at all.
Only eClerx moved with MPS, rallying over 27% in July while still ~29% below its own 52-week high — and it has the most substantive AI leg of the group: FY26 revenue +22%, a first large-scale Agentic AI win, and an Automation & Analytics segment near US$90 million. IBEX confirms the AI-BPO demand but dates to May, not July: record $164.4m revenue, raised guidance, a Sierra.ai partnership.
The rotation leg is contradicted outright
Legacy Indian IT did not stay down. Nifty IT gained 12.2% in July, its best month in two years, with HCL Tech and Tech Mahindra up 20% from 52-week lows, and the proximate catalyst was not AI but a foreign brokerage upgrade to Neutral from Underweight that drove a ~7% three-session rally. On 27 July OFSS +3.9%, Infosys +3.6%, TCS +2.2% led the tape, while Tech Mahindra's Q1 showed $1,078 million of total contract value. The currency tailwind is real but shared by every dollar-revenue exporter: USD/INR peaked at 96.84 in May before easing to ~94.35. Our own price table agrees — over the trailing month TCS +3.8%, ACN +12.2%, CTSH +3.2%, INFY +1.5%, even as all four remain in strongly bearish bands over 90 days (INFY -22.3%, ACN -28.0%, CTSH -28.6%).
Where the AI data money actually landed
MPS itself: 24.7 of ~42 points came in two sessions, locked at a 20% upper circuit on Q1 revenue +20.4% and net profit +43%, on 96,087 shares against a 1,205-share average. It has since traded to ₹2,683 on 27 July, roughly 19–29% above the sell-side targets that sparked the move, on ~$25,000 of daily turnover. Management framed AI as a margin lever inside existing work; the licensing pool sits upstream, where Wiley booked $49 million of AI licensing revenue. The $3bn annotation market is shifting toward expert and regulated-domain work rather than offshore labour arbitrage, and content licensing stays concentrated at publishers — Meta with seven, News Corp ~$50m/yr, Reddit ~$130m/yr, only 4 in 10 deals with training rights. TaskUs shows the shape of the problem: AI Services +36.1% YoY but only ~18% of revenue. The listed vehicle capturing the theme is Innodata, +66.6% YTD with Q1 revenue +54% and $68m of pre-training data wins, reporting Q2 on 30 July.