

Brazil's Breadth Is Deteriorating While UGP Runs Past Fair Value
Prompt v1.0
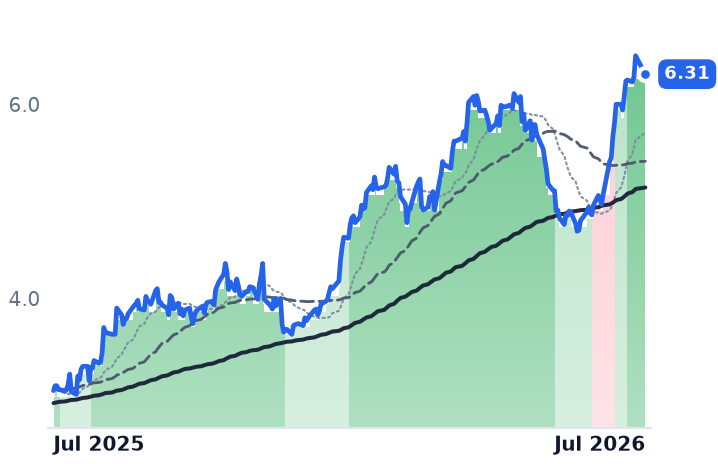
Ultrapar's +32.9% month is the loudest thing in Brazilian equities, but the cohort behind it is going the other way: nine of twelve Brazil names moved into worse trend bands between 11 May and 21 July, and UGP itself now trades above its consensus 12-month target.
| Ticker | Company | Segment | Trend · 13mo | 30D | 1Y |
|---|---|---|---|---|---|
UGP | Ultrapar Participações | Fuel Distributors & Retailers | 🟢 Cont. Bull | +24.7% | +106.9% |
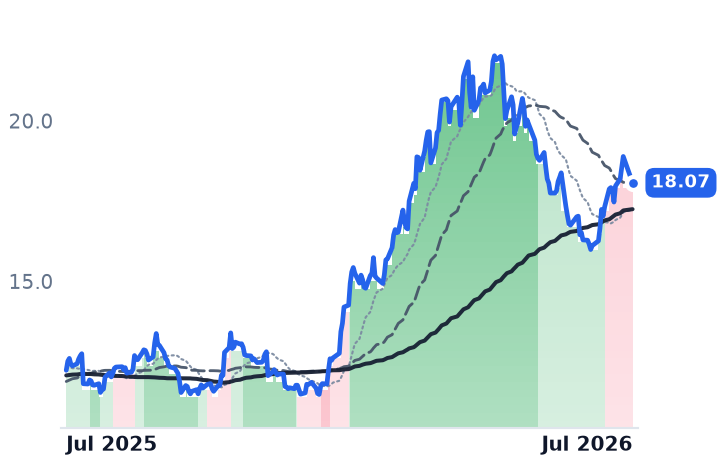
PBR | Petróleo Brasileiro S.A. - Petrobras | Upstream Exploration & Production | 🟢 Cont. Bull | +11.0% | +47.8% |
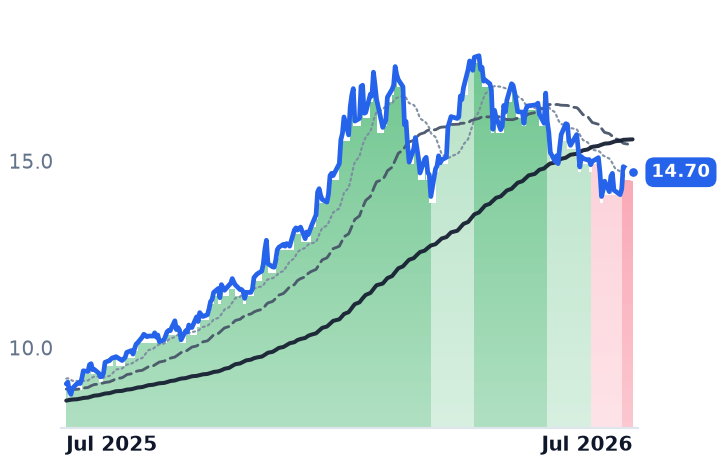
VALE | Vale | Major Diversified Mining | 🟢 Cont. Bull | −2.2% | +62.7% |
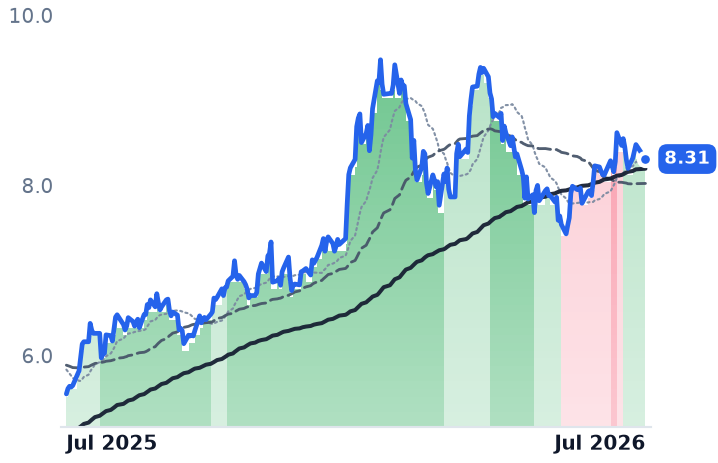
ITUB | Itaú Unibanco | Major International Banks | 🟢 Cont. Bull | +1.1% | +49.8% |
BBD | Banco Bradesco | Latin America & Caribbean Banks | ⚠️ Emerging Bear | +5.9% | +34.3% |
BSBR | Banco Santander (Brasil) | Latin America & Caribbean Banks | ⚠️ Emerging Bear | +4.8% | +17.9% |
ABEV | Ambev | Global Brewers | 🟢 Cont. Bull | −1.6% | +37.5% |
EWZ | iShares MSCI Brazil ETF | Asset Management | ⚠️ Emerging Bear | +4.3% | +40.7% |
NU | Nu | Emerging Markets & Specialized Banking | ⚠️ Emerging Bear | +11.8% | +16.4% |
XP | XP | Diversified Financial Services | ⚠️ Emerging Bear | +3.0% | +4.6% |
CIG | Companhia Energética de Minas Gerais | Brazilian Integrated Utilities | ⚠️ Emerging Bear | +5.0% | +22.1% |
SBS | Companhia de Saneamento Básico do Estado de São Paulo - SABESP | International & Diversified Water | ⚠️ Emerging Bear | −5.0% | −71.0% |
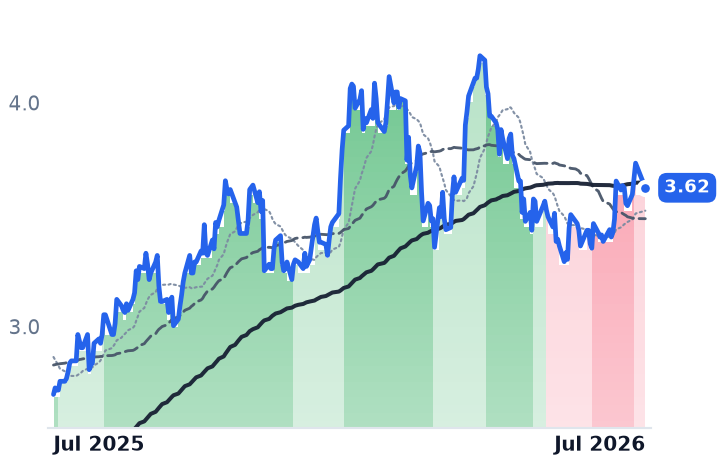
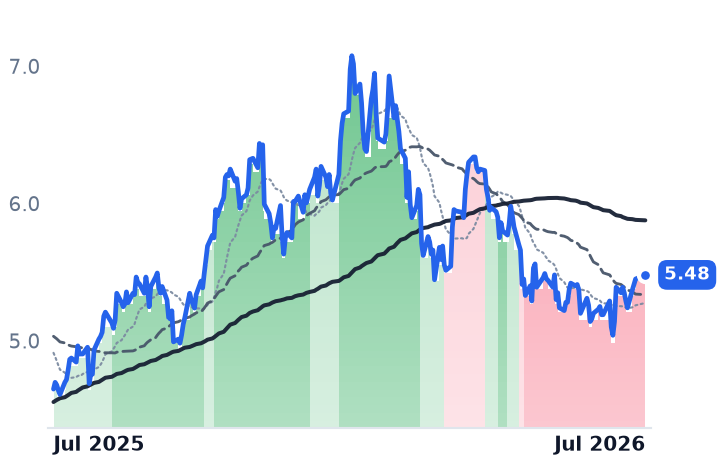
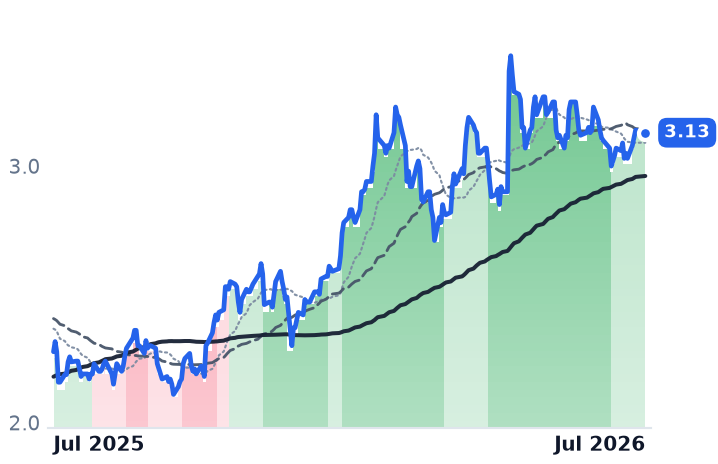
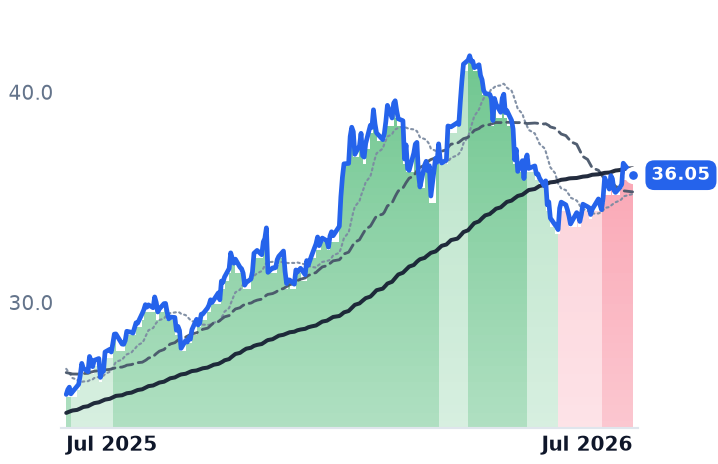
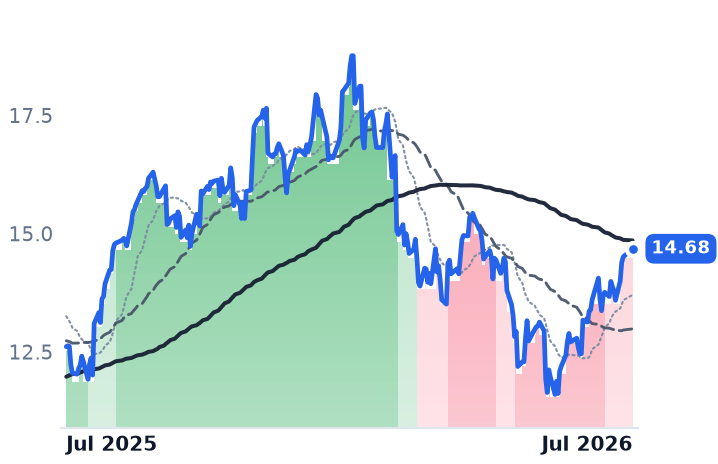
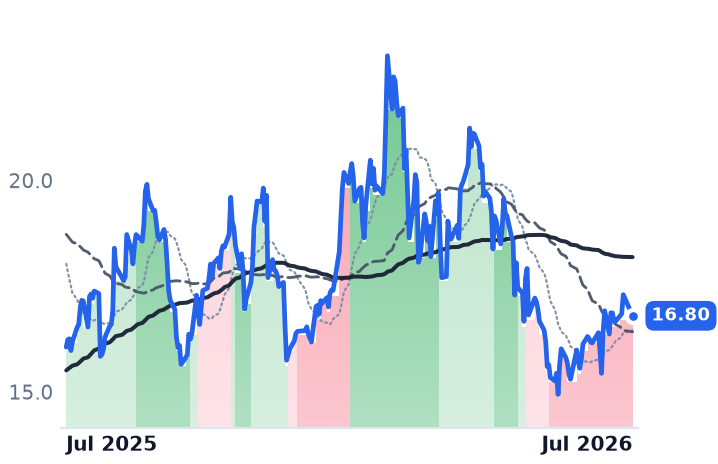
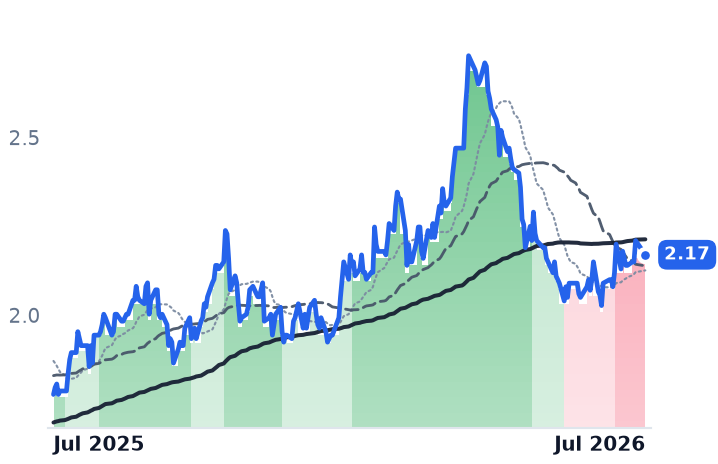
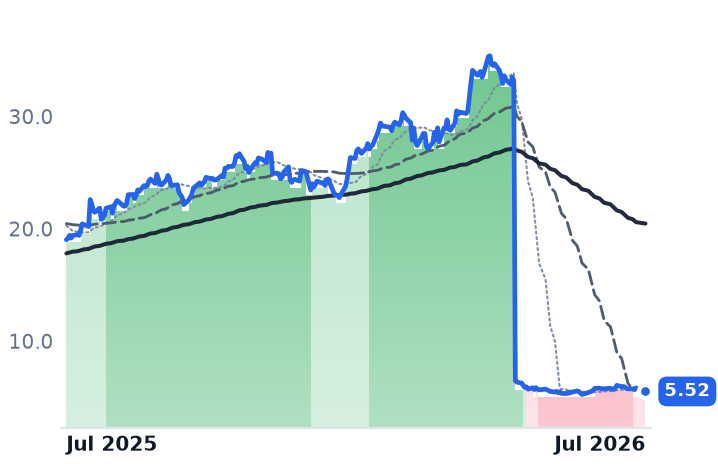
12-month price & trend
| Ticker | Mkt cap | P/E | P/E fwd | P/S | P/S fwd | P/GP | P/GP fwd | EV/EBITDA | FCF yld |
|---|---|---|---|---|---|---|---|---|---|
UGP | $6.2B | 10.4x | — | 0.2x | — | 3.0x | — | 6.7x | 10.8% |
PBR | $128.4B | 5.7x | 4.8x | 1.2x | 1.1x | 2.7x | 2.4x | 4.5x | 12.8% |
VALE | $69.6B | 24.3x | 8.1x | 1.8x | 1.7x | 5.2x | 4.9x | 6.2x | 4.8% |
| Ticker | Mkt cap | P/E | P/E fwd | P/S | P/S fwd | P/GP | P/GP fwd | EV/EBITDA | FCF yld |
|---|---|---|---|---|---|---|---|---|---|
ITUB | $86.4B | 9.5x | — | 1.1x | — | 3.3x | — | 24.2x | 8.0% |
BBD | $36.7B | 8.0x | — | 0.5x | — | 1.7x | — | 34.5x | 109.2% |
BSBR | $39.9B | 15.5x | — | 1.1x | — | 2.8x | — | 1.4x | 2.9% |
| Ticker | Mkt cap | P/E | P/E fwd | P/S | P/S fwd | P/GP | P/GP fwd | EV/EBITDA | FCF yld |
|---|---|---|---|---|---|---|---|---|---|
ABEV | $47.9B | 15.7x | — | 2.8x | — | 5.6x | — | 8.1x | 9.1% |
EWZ | $7.4B | — | — | — | — | — | — | — | — |
NU | $58.9B | 18.6x | 14.0x | 3.4x | 2.7x | 7.7x | 6.2x | 21.4x | 6.4% |
| Ticker | Mkt cap | P/E | P/E fwd | P/S | P/S fwd | P/GP | P/GP fwd | EV/EBITDA | FCF yld |
|---|---|---|---|---|---|---|---|---|---|
XP | $9.2B | 9.0x | — | 2.5x | — | 3.8x | — | 19.3x | 25.1% |
CIG | $6.3B | 9.7x | — | 1.1x | — | 7.8x | — | 10.3x | 6.7% |
SBS | $19.5B | 11.7x | — | 2.6x | — | 7.0x | — | 9.1x | 7.6% |
Consensus projections
| Ticker | FY2026E | FY2027E | FY2028E | |
|---|---|---|---|---|
UGP | Revenue | +15.0% | −0.4% | +0.2% |
| EPS | +17.4% | +3.9% | +18.2% | |
PBR | Revenue | +27.3% | −4.1% | −1.9% |
| EPS | +33.2% | −9.4% | −5.2% | |
VALE | Revenue | +8.3% | −0.4% | +2.6% |
| EPS | +0.3% | −4.0% | +0.4% | |
ITUB | Revenue | +8.3% | +8.5% | +7.1% |
| EPS | +9.7% | +11.3% | +9.9% | |
BBD | Revenue | +11.9% | +8.3% | +7.3% |
| EPS | +15.4% | +13.6% | +8.3% | |
BSBR | Revenue | +5.4% | +8.0% | +6.4% |
| EPS | +6.4% | +13.3% | +9.2% | |
ABEV | Revenue | +5.7% | +4.4% | +5.3% |
| EPS | +7.1% | +7.0% | +5.1% | |
NU | Revenue | +54.4% | +21.7% | +14.0% |
| EPS | +42.6% | +32.7% | +26.4% | |
XP | Revenue | +17.2% | +13.8% | +12.0% |
| EPS | +14.0% | +14.3% | +14.3% | |
CIG | Revenue | −5.0% | −2.8% | +4.3% |
| EPS | −18.2% | −5.6% | +36.1% | |
SBS | Revenue | +11.4% | +18.9% | +10.4% |
| EPS | −1.5% | +27.5% | +12.6% |
Forward fiscal years only. Blank means no analyst coverage for that year.
The breadth test fails
The tempting read on Ultrapar's +32.9% month ($4.89 on 22 June to $6.50 on 22 July) is that it front-runs a Brazil re-rating. The band data says the opposite. Between 11 May and 21 July, nine of twelve Brazil names deteriorated: BSBR to strongly bearish on 14 May, SBS on 21 May, XP on 4 June, BBD on 25 June, ABEV out of strongly bullish on 7 July, EWZ to strongly bearish on 8 July, CIG on 9 July, PBR out of mildly bullish on 10 July, VALE on 21 July. Only UGP (mildly bullish 9 July, strongly bullish 17 July) and ITUB (14 July) improved. As of 22 July, EWZ, VALE, XP, BSBR and CIG were all strongly bearish.
The return spread confirms it. Over 30 days the cohort managed single digits — PBR +11.1%, BBD +8.7%, EWZ +6.9%, ITUB +6.9%, VALE −5.5% — and over 90 days almost everything is negative: EWZ −8.7%, PBR −11.2%, XP −11.9%, VALE −13.4%, Ibovespa −7.2%. That is a bounce inside a drawdown. UGP's own July move is also a resumption, not a birth: it was in strongly bullish until 2 June and spent only 25 June to 8 July in mildly bearish.
Not currency, not a country trade
Over 30 days the Ibovespa rose 4.2% in BRL while EWZ rose 6.9% in USD — roughly 2.6pp of FX. UGP's remaining ~30pp is stock-specific: Ipiranga's Q1 delivered net profit of R$914m, up 151%, on Brazil's fuel-fraud crackdown, though management conceded the R$275/m³ margin was amplified by inventory gains on elevated import stocks.
The macro backdrop hasn't turned in the same window. Copom's third consecutive 25bp cut, to 14.25% on 17 June, came despite CPI near 4.7–4.8%, above the tolerance band, and August is now roughly a coin flip. A 25% Section 301 tariff took effect 22 July, July foreign inflows of ~R$4.2bn were called "a respite that won't last", and the election trade broke when Tarcísio stood aside and Lula regained his lead — the same three premises behind this desk's 9 May EWZ call have now all reversed.
Runway is gone
UGPA3 closed R$33.26 on 23 July, through its February-2018 all-time high, against a 12-month consensus target of R$32.18. The ADR set a 52-week high on 22 July, within ~2% of the top of its range, sits 34.1% above its 200-day average, and carries Goldman at $7.30 Neutral versus Jefferies at $5.60, below spot. InfoMoney's technical screen flags it as overbought. A 9.02x trailing P/E looks cheap only if a crackdown-inflated margin is the run-rate. Meanwhile EWZ sits 12.2% below its 52-week high and the Ibovespa 10.6% below its own — the cohort never left the drawdown.