

China internet rallies 15%+ in a month — but every band still reads bear
Hypothesis Opus 5 · Research Sonnet 5 · Writing Sonnet 5 · Prompt v1.0
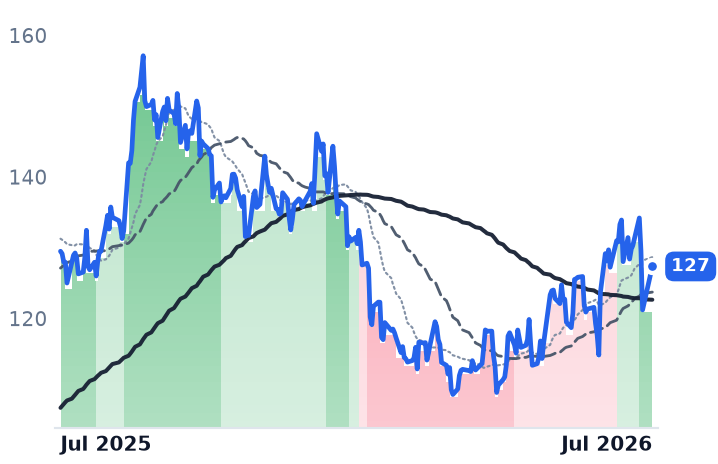
The eight-name China Internet & Consumer 52-week-low bucket (BABA, PDD, TME, BZ, YMM, BEKE, TAL, VIPS) is up roughly 15-16% over the trailing 30 days on a Beijing-tech-thaw catalyst, yet every single member remains in a bear trend-band as of July 28 — identical in composition to a month ago — with PDD locked in strongly bearish for about 196 straight sessions. That combination points to an oversold, catalyst-driven bounce inside intact downtrends rather than a confirmed cohort bottom.
| Ticker | Company | Segment | Trend · 13mo | 30D | 1Y |
|---|---|---|---|---|---|
| The subject · what this brief is about | |||||
BABA | Alibaba | Online Marketplaces | ⚠️ Emerging Bear | +20.6% | −5.7% |
PDD | PDD | Online Marketplaces | ⚠️ Emerging Bear | +12.0% | −26.6% |
TME | Tencent Music Entertainment | Music & Entertainment Streaming | 🔴 Cont. Bear | +12.7% | −54.7% |
BZ | Kanzhun | Online Job Marketplace | ⚠️ Emerging Bear | +22.0% | −19.7% |
YMM | Full Truck Alliance | Transportation & Logistics | 🔴 Cont. Bear | +16.1% | −18.5% |
BEKE | KE | Residential Real Estate Platforms | 🔴 Cont. Bear | +14.4% | −12.6% |
TAL | TAL Education | K-12 Tutoring (China) | ⚠️ Emerging Bear | +10.1% | +1.9% |
VIPS | Vipshop | Online Marketplaces | ⚠️ Emerging Bear | +14.5% | −1.1% |
| Compared against · context, not the story | |||||
NTES | NetEase | Diversified Gaming & Services | 🟢 Cont. Bull | −1.4% | −1.7% |
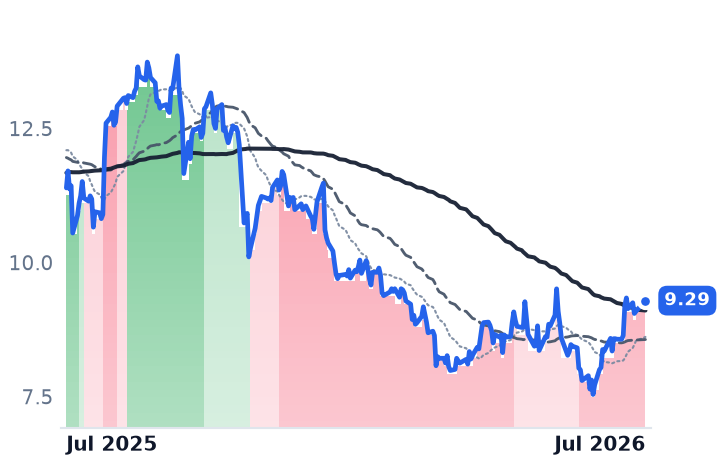
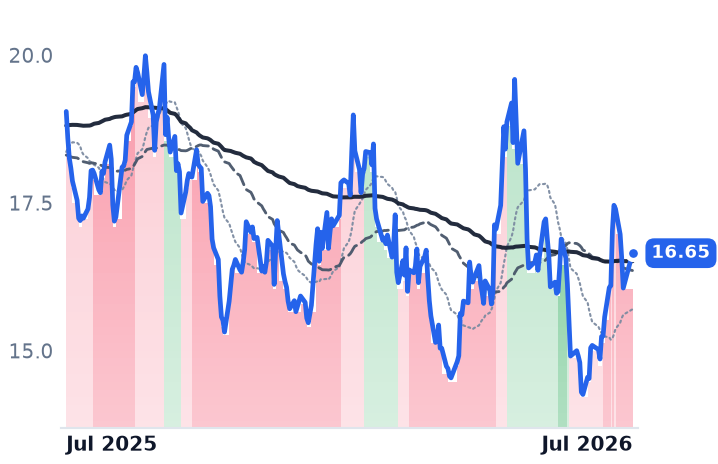
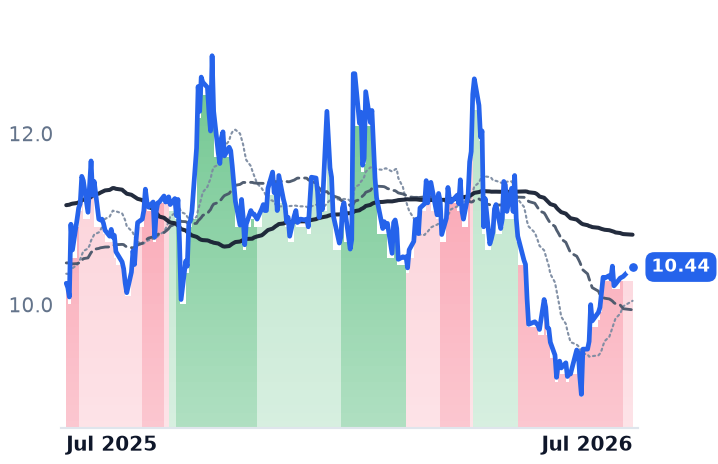
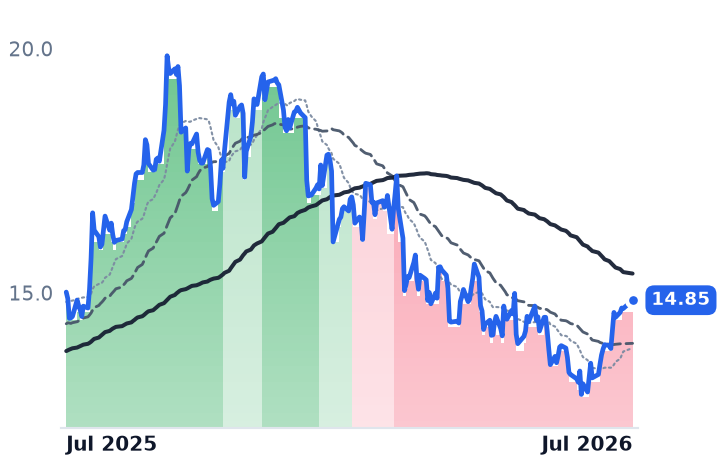
12-month price & trend
| Ticker | Mkt cap | P/E | P/E fwd | P/S | P/S fwd | P/GP | P/GP fwd | EV/EBITDA | FCF yld |
|---|---|---|---|---|---|---|---|---|---|
BABA | $307.9B | 20.7x | — | 2.2x | — | 5.5x | — | 18.6x | -2.7% |
PDD | $136.4B | 9.2x | — | 2.2x | — | 3.8x | — | 7.2x | 11.5% |
TME | $13.0B | 10.3x | — | 2.7x | — | 5.8x | — | 6.7x | 8.6% |
| Ticker | Mkt cap | P/E | P/E fwd | P/S | P/S fwd | P/GP | P/GP fwd | EV/EBITDA | FCF yld |
|---|---|---|---|---|---|---|---|---|---|
BZ | $6.5B | 16.3x | — | 5.4x | — | 6.3x | — | 16.2x | 10.0% |
YMM | $9.1B | 14.0x | — | 5.0x | — | 7.8x | — | 12.2x | 0.0% |
BEKE | $21.1B | 46.5x | — | 1.5x | — | 7.0x | — | 38.3x | -2.0% |
| Ticker | Mkt cap | P/E | P/E fwd | P/S | P/S fwd | P/GP | P/GP fwd | EV/EBITDA | FCF yld |
|---|---|---|---|---|---|---|---|---|---|
TAL | $6.6B | 3.7x | 13.0x | 2.2x | 1.8x | 3.9x | 3.2x | 18.8x | 5.0% |
VIPS | $7.0B | 6.6x | — | 0.4x | — | 1.9x | — | 3.1x | 0.0% |
NTES | $72.4B | 14.7x | — | 4.4x | — | 6.9x | — | 11.9x | 9.8% |
Consensus projections
| Ticker | FY2026E | FY2027E | FY2028E | |
|---|---|---|---|---|
BABA | Revenue | +2.3% | +12.1% | +11.6% |
| EPS | −49.0% | +39.5% | +36.2% | |
PDD | Revenue | +15.9% | +13.2% | +10.1% |
| EPS | +10.4% | +17.8% | +15.1% | |
TME | Revenue | +11.1% | +9.2% | +8.6% |
| EPS | −8.0% | +9.9% | +14.2% | |
BZ | Revenue | +14.4% | +12.7% | +11.5% |
| EPS | +10.8% | +15.2% | +13.4% | |
YMM | Revenue | −5.4% | +12.8% | +15.3% |
| EPS | +4.5% | +23.3% | +14.1% | |
BEKE | Revenue | −4.9% | +5.2% | +5.1% |
| EPS | +22.1% | +19.4% | +9.2% | |
TAL | Revenue | +31.9% | +24.0% | +17.6% |
| EPS | +188.3% | +32.0% | +25.5% | |
VIPS | Revenue | +2.3% | +2.2% | +2.2% |
| EPS | +6.6% | +5.9% | +3.7% | |
NTES | Revenue | +7.0% | +8.2% | +8.0% |
| EPS | +3.6% | +10.3% | +9.1% |
Forward fiscal years only. Blank means no analyst coverage for that year.
What's happening
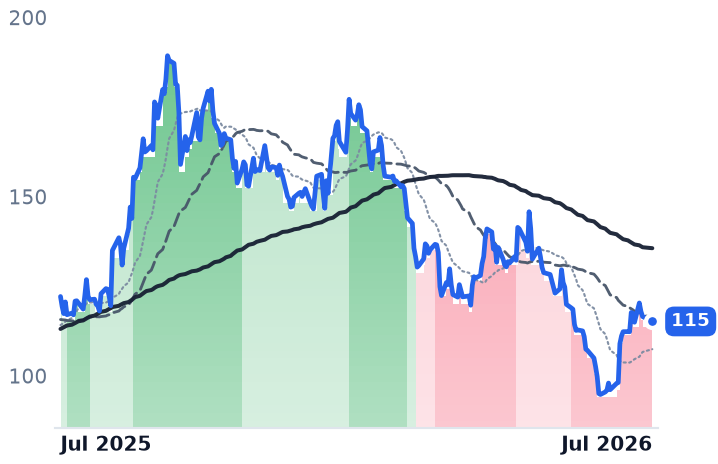
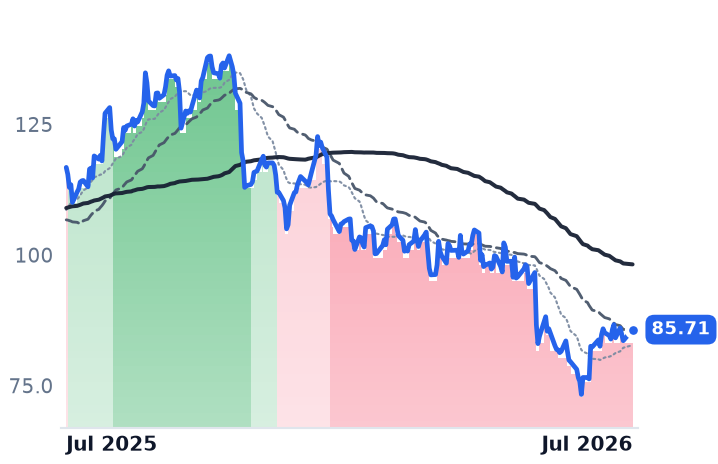
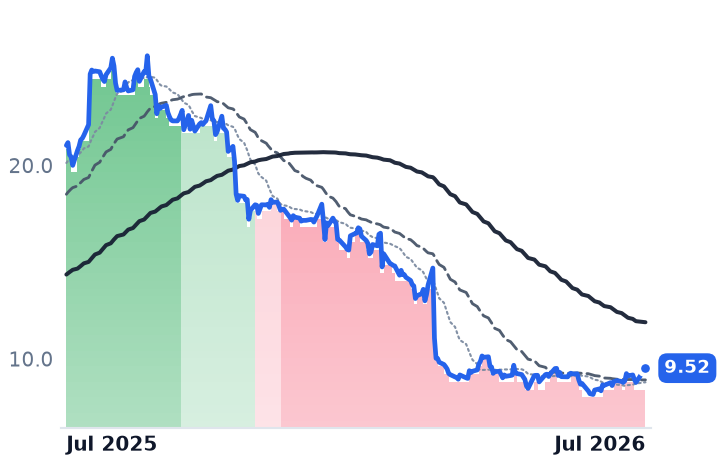
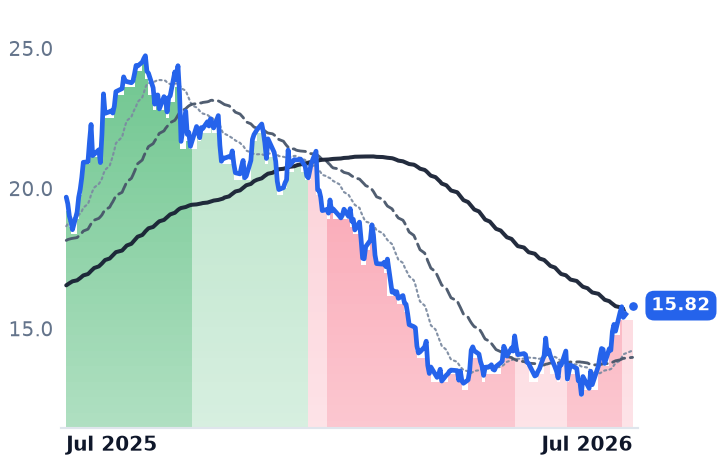
All eight names in the bucket gained double digits off their 52-week lows between June 26 and July 28 — BABA +21.5%, YMM +20.3%, BZ +19.0%, BEKE +16.8%, TME +13.5%, VIPS +13.0%, PDD +12.0%, TAL +10.1% — a broad, not concentrated, move averaging roughly 15-16%. But trend-band data tells a different story: on July 28, five names (BABA, PDD, TME, BEKE, VIPS) sit in strongly bearish and three (BZ, TAL, YMM) sit in mildly bearish. That is essentially the same lineup as June 26, when the group was nearly all strongly bearish. Zero members crossed into neutral or bull territory over the window. PDD alone has now logged roughly 196 consecutive sessions in strongly bearish dating back to mid-January.
The catalyst behind the bounce
The rally traces to a datable event: China's approval of Apple Intelligence integration using Alibaba's Qwen model across iPhone, iPad and Mac in the mainland market in mid-July, which markets read as a signal that Beijing is turning friendlier toward its largest domestic tech names — Alibaba jumped as the approval revived a broader China tech rally, and the whole China internet complex caught what Bloomberg called an 'AI lift' as Beijing warmed to tech. Underneath that, Alibaba's own cloud business gave the move fundamental cover: Cloud Intelligence Group revenue grew 34% year-over-year with AI products posting triple-digit growth for a ninth straight quarter, even as non-GAAP EPS fell sharply on AI capex spend.
Why the fundamentals stay cautious
The macro backdrop is tepid rather than a re-acceleration story: China's H1 retail sales grew just 2.7% year-over-year, with June rebounding to only +1% after a May contraction — the weakest reading in three years. The e-commerce/instant-retail price war that has pressured margins across the group is still live, not resolved: regulators fined seven major platforms roughly $528M in April and summoned platforms again in June over 618 marketing practices, and Alibaba's instant-retail unit is targeting break-even economics only by fiscal 2027 after a steep operating-margin loss. PDD's own numbers underscore the point: Q1 2026 profit missed consensus by roughly 45% on Temu margin compression, EU fines and loss of US de minimis treatment. Tencent Music's collapse toward its 52-week low reflects its own idiosyncratic pressures — competition from Soda Music and AI-piracy fears — rather than a sector-wide phenomenon now reversing. On the delisting-risk side, audit-access risk for China ADRs has structurally eased since the PCAOB's 2022 inspection-access determination, though the framework remains revocable and US policy scrutiny has resurfaced.
The gap between price and label
All eight names still trade well below their 52-week highs — BABA -39%, PDD -38%, TME -64%, BZ -37%, YMM -34%, VIPS -28%, TAL -19%, BEKE -18% — leaving nominal room to run, but with no band confirmation anywhere in the cohort, that distance reads as unrealized recovery from an intact downtrend rather than validated upside. A companion same-day analysis of BABA alone found that most of its 30-day move traced to a single gap session around July 8, reinforcing that this looks like an event-driven bounce layered on still-bearish underlying trends rather than a cohort-wide re-rating.