

Alt managers are the weak leg of the AI-power trade, not the early one
Prompt v1.0
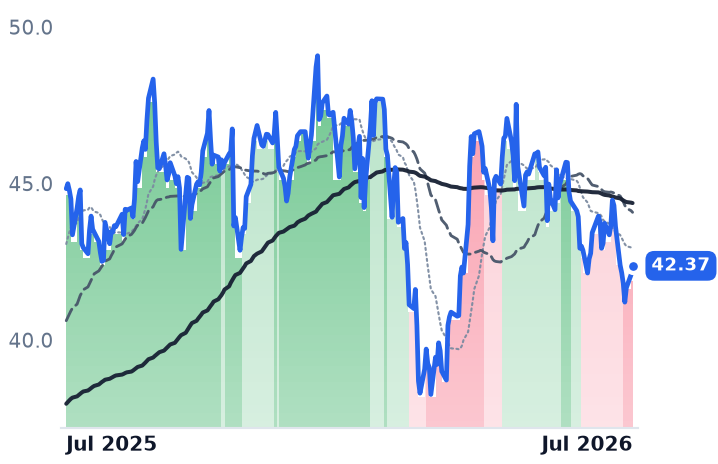
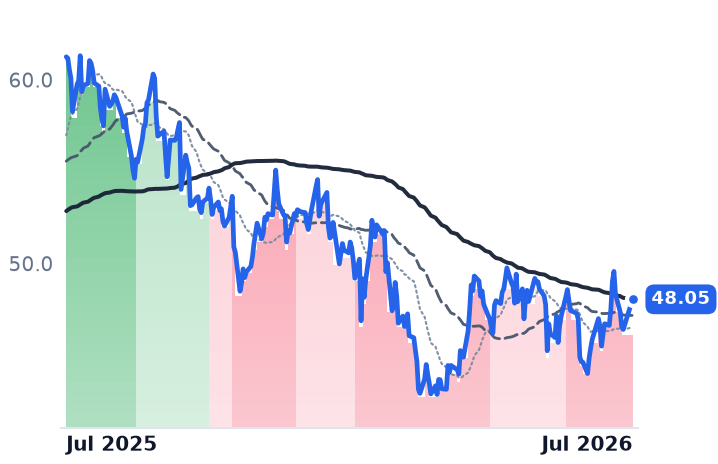
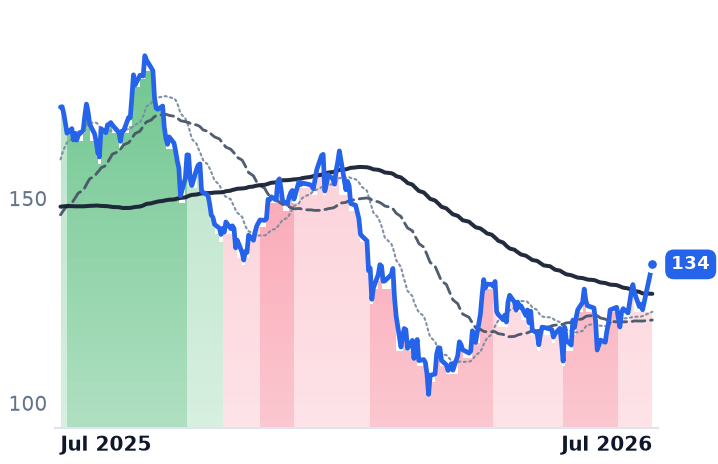
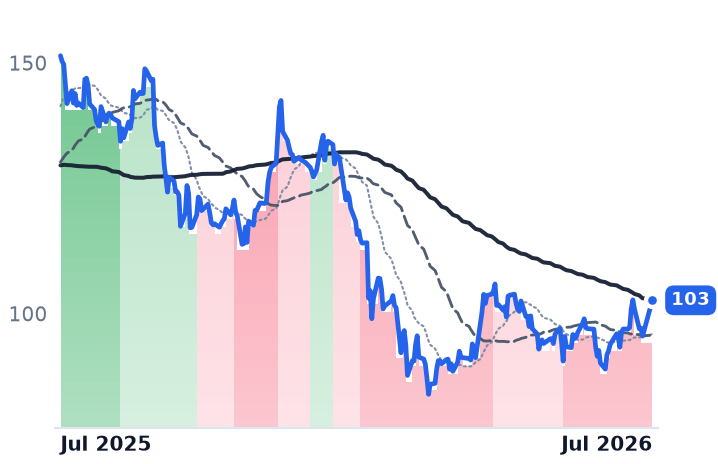
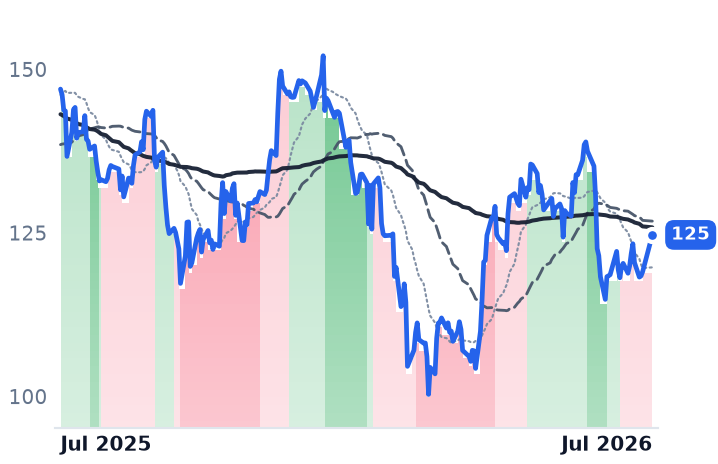
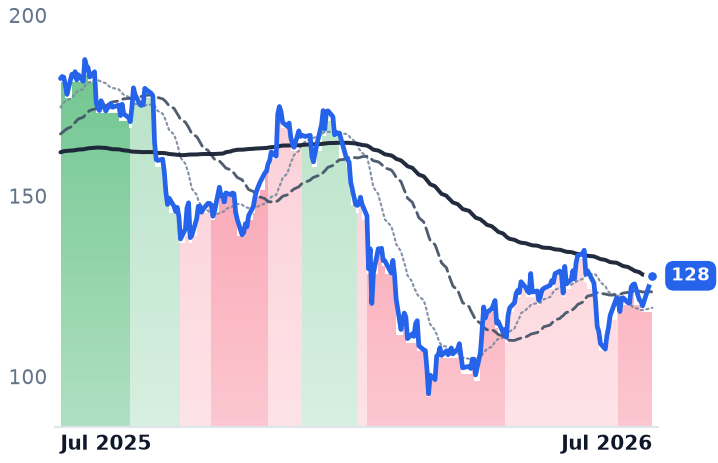
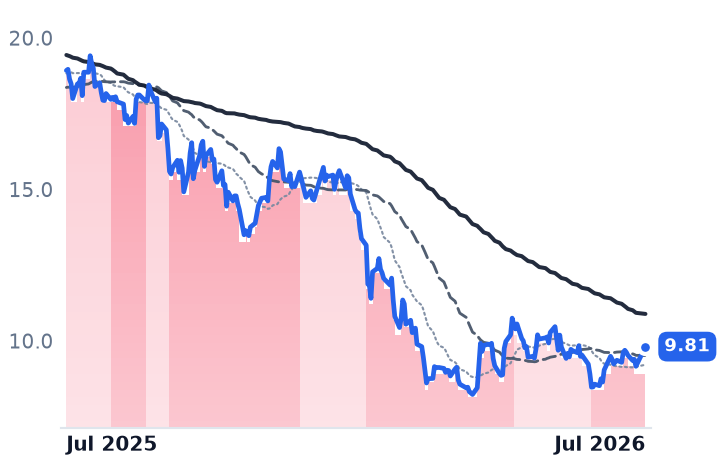
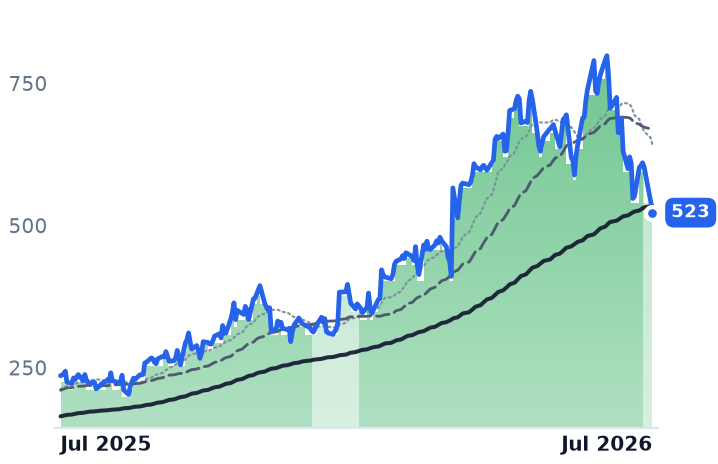
Zero of seven alternative-asset managers (BN, BAM, BX, KKR, APO, ARES, OWL) sit in a bull band, all seven are below their 200-day averages and negative over 30, 90 and 180 days — while the AI-power assets they finance still hold bull bands above their 200-days. BN's "+2.1%" is a two-session bounce off a three-month low that came the same week its band was cut to strongly bearish.
| Ticker | Company | Segment | Trend · 13mo | 30D | 1Y |
|---|---|---|---|---|---|
BN | Brookfield | Real Estate & Infrastructure | ⚠️ Emerging Bear | +0.5% | −5.5% |
BAM | Brookfield Asset Management | Real Estate & Infrastructure | 🔴 Cont. Bear | +9.2% | −21.6% |
BX | Blackstone | Alternative & Private Capital | 🔴 Cont. Bear | +16.6% | −22.3% |
KKR | KKR | Alternative & Private Capital | 🔴 Cont. Bear | +15.4% | −32.2% |
APO | Apollo Global Management | Alternative & Private Capital | 🌱 Emerging Bull | +8.6% | −15.2% |
ARES | Ares Management | Alternative & Private Capital | 🔴 Cont. Bear | +18.9% | −29.9% |
OWL | Blue Owl Capital | Alternative & Private Capital | 🔴 Cont. Bear | +15.1% | −48.2% |
DBRG | DigitalBridge | Real Estate & Infrastructure | 🟢 Cont. Bull | — | — |
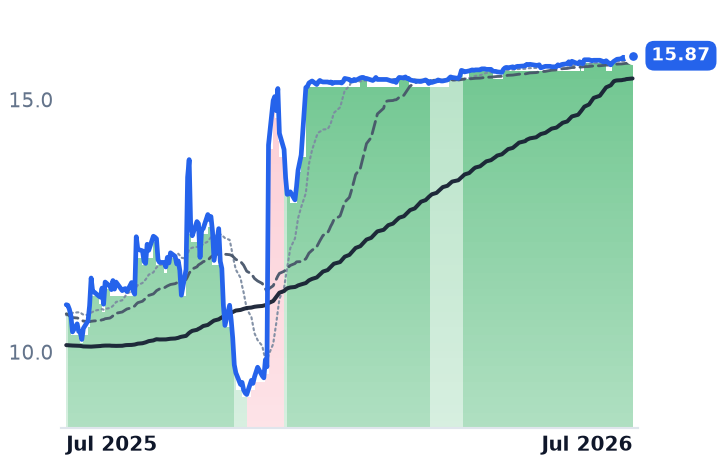
AGX | Argan | Energy & Power Project Solutions | 🟢 Cont. Bull | −34.0% | +121.5% |
BE | Bloom Energy | Fuel Cell & Hydrogen | 🟢 Cont. Bull | −39.3% | +379.7% |
GEV | GE Vernova | GE Vernova Integrated | 🟢 Cont. Bull | −14.4% | +45.9% |
WMB | The Williams Companies | Natural Gas Pipelines & Transmission | 🟢 Cont. Bull | −6.5% | +24.9% |
PPL.TO | Pembina Pipeline | Oil & Gas Midstream | 🟢 Cont. Bull | +6.2% | +46.1% |
12-month price & trend
| Ticker | Mkt cap | P/E | P/E fwd | P/S | P/S fwd | P/GP | P/GP fwd | EV/EBITDA | FCF yld |
|---|---|---|---|---|---|---|---|---|---|
BN | $99.3B | 84.0x | 16.2x | 1.3x | 13.0x | 3.7x | 36.9x | 10.5x | -7.3% |
BAM | $86.7B | 31.2x | 29.5x | 16.0x | 14.2x | 20.0x | 17.8x | 90.0x | 2.5% |
BX | $173.9B | 32.0x | 24.3x | 10.8x | 11.9x | 12.2x | 13.4x | 22.0x | 2.5% |
| Ticker | Mkt cap | P/E | P/E fwd | P/S | P/S fwd | P/GP | P/GP fwd | EV/EBITDA | FCF yld |
|---|---|---|---|---|---|---|---|---|---|
KKR | $102.4B | 33.9x | 18.4x | 4.8x | 9.7x | 10.4x | 20.8x | 15.1x | 8.3% |
APO | $81.1B | 30.5x | 16.0x | 2.4x | 3.5x | 3.0x | 4.4x | 5.8x | 9.9% |
ARES | $47.3B | 62.9x | 24.5x | 7.4x | 8.4x | 11.8x | 13.4x | 24.3x | 1.8% |
| Ticker | Mkt cap | P/E | P/E fwd | P/S | P/S fwd | P/GP | P/GP fwd | EV/EBITDA | FCF yld |
|---|---|---|---|---|---|---|---|---|---|
OWL | $19.1B | 102.3x | 13.8x | 6.4x | 6.8x | 10.5x | 11.1x | 24.3x | 6.9% |
DBRG | $2.9B | 19.0x | 44.7x | 5.9x | 6.7x | 6.6x | 7.5x | 17.8x | 5.9% |
AGX | $8.0B | 49.0x | 47.2x | 7.7x | 6.2x | 36.7x | 29.8x | 40.7x | 6.1% |
| Ticker | Mkt cap | P/E | P/E fwd | P/S | P/S fwd | P/GP | P/GP fwd | EV/EBITDA | FCF yld |
|---|---|---|---|---|---|---|---|---|---|
BE | $67.7B | 275.0x | 87.8x | 21.7x | 16.7x | 69.6x | 53.5x | 194.0x | 0.9% |
GEV | $268.1B | 28.6x | 32.8x | 6.5x | 5.8x | 32.1x | 28.8x | 29.9x | 4.6% |
WMB | $90.1B | 29.2x | 30.4x | 7.4x | 7.3x | 10.0x | 10.0x | 16.2x | -0.2% |
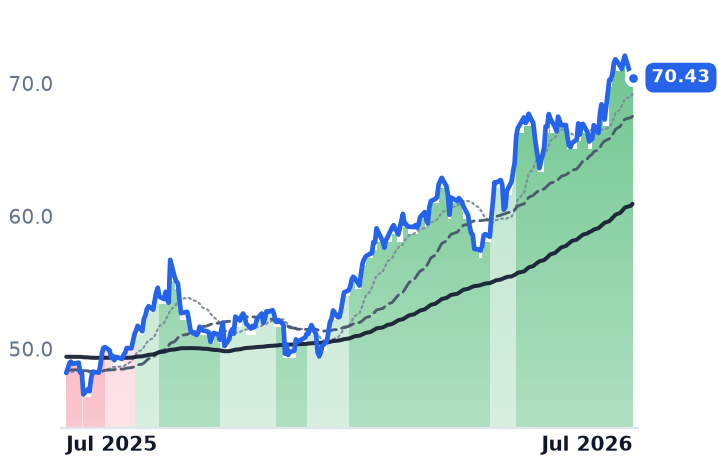
| Ticker | Mkt cap | P/E | P/E fwd | P/S | P/S fwd | P/GP | P/GP fwd | EV/EBITDA | FCF yld |
|---|---|---|---|---|---|---|---|---|---|
PPL.TO | $39.6B | 24.0x | 22.0x | 5.0x | 4.6x | 13.4x | 12.3x | 14.2x | 5.2% |
Consensus projections
| Ticker | FY2026E | FY2027E | FY2028E | |
|---|---|---|---|---|
BN | Revenue | −6.8% | +21.4% | +21.7% |
| EPS | +13.2% | +23.7% | +15.4% | |
BAM | Revenue | +12.2% | +16.1% | +12.9% |
| EPS | +12.9% | +17.8% | +16.8% | |
BX | Revenue | +15.0% | +24.4% | +4.9% |
| EPS | +10.7% | +25.2% | +10.8% | |
KKR | Revenue | +33.9% | +17.8% | +32.9% |
| EPS | +26.0% | +18.0% | +15.7% | |
APO | Revenue | +27.3% | +16.0% | +13.9% |
| EPS | +10.8% | +21.4% | +16.1% | |
ARES | Revenue | +22.9% | +19.5% | +9.3% |
| EPS | +17.7% | +23.8% | +17.7% | |
OWL | Revenue | +5.9% | +10.5% | +16.1% |
| EPS | +7.9% | +11.4% | +14.5% | |
DBRG | Revenue | +185.5% | +14.7% | +18.0% |
| EPS | +51.4% | +231.4% | −19.8% | |
AGX | Revenue | +12.1% | +36.2% | +25.4% |
| EPS | +65.8% | +44.2% | +29.3% | |
BE | Revenue | +112.4% | +65.1% | +46.0% |
| EPS | +374.5% | +83.5% | +60.7% | |
GEV | Revenue | +23.4% | +14.6% | +15.3% |
| EPS | +322.4% | −19.0% | +40.3% | |
WMB | Revenue | +7.4% | +9.9% | +12.7% |
| EPS | +14.1% | +4.5% | +18.3% | |
PPL.TO | Revenue | +9.3% | +4.2% | +4.6% |
| EPS | +15.8% | +2.2% | +5.3% |
Forward fiscal years only. Blank means no analyst coverage for that year.
The divergence runs the other way
The capital layer is not emerging from a bottom — it is the deeper drawdown. Across the seven listed alternative managers, none prints a bull band: BN, BAM, KKR, OWL and ARES are strongly bearish, BX and APO mildly bearish. All seven trade below their 200-day averages (BX 122.82 vs 133.15; KKR 95.53 vs 108.03; OWL 9.16 vs 12.18), and only BX is above its 50-day. Three-month returns are negative across the board — KKR -8.5%, BN -7.2%, OWL -7.2%, APO -6.5%, BX -4.4%, BAM -3.8%, ARES -0.2% — as are 90- and 180-day windows. Twelve-month damage: OWL -54.1%, KKR -34.1%, ARES -32.9%. Distance from 52-week highs runs -54.9% (OWL) to -14.4% (BN).
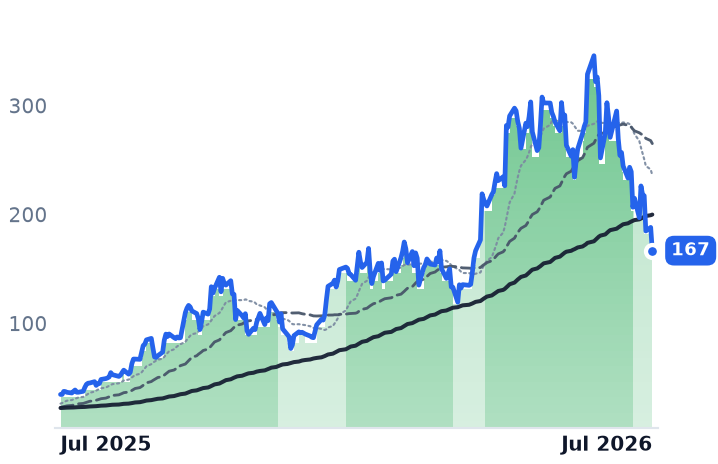
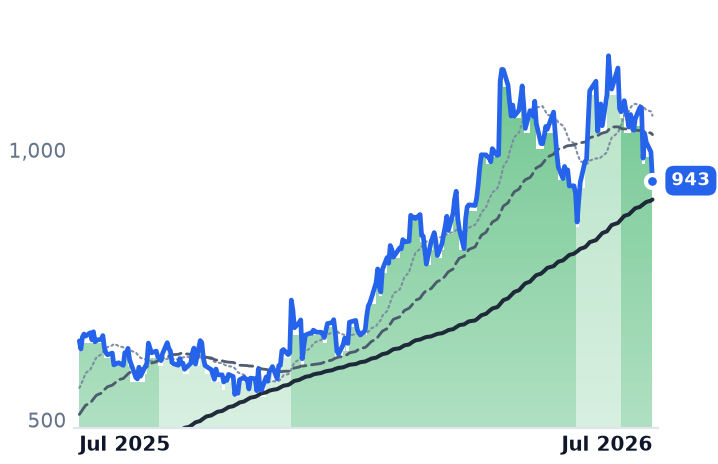
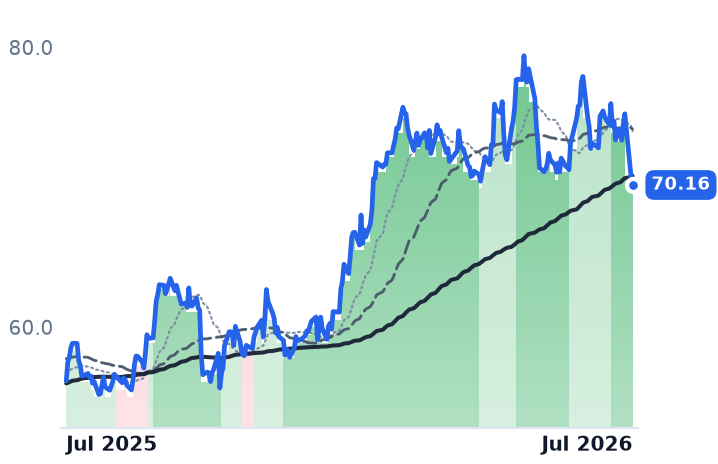
The assets they fund look nothing like that. GEV, WMB and PPL.TO are strongly bullish, AGX and BE mildly bullish, and all five sit above their 200-day averages even after the recent selloff. Over twelve months BE is +448% and AGX +141.8%.
BN's cited strength doesn't survive inspection: 41.21 on 7/23 to 42.08 on 7/27, off a three-month low, after peaking at 44.47 on 7/15 — a true trailing five-session return of -0.73%. It maps to the 27 July NAVER, NVIDIA and Brookfield expansion of Korea's national AI factory, with Brookfield as exclusive capital partner for up to $9bn of a $10bn project. Real news — but BN was cut to strongly bearish on 22 July, mid-bounce. Note also that peer price series end 7/22 versus BN's 7/27, and DBRG's data stops 5/19.
The macro legs fail
Policy is not easing into this: the FOMC held at 3.50–3.75% unanimously in June with hawkish dots against 4.2% inflation. Credit is widening, not tightening — BDCs trade at their deepest NAV discounts in over five years, new private-credit deals price 50–100bp wider with Golub marking down existing investments, and PIMCO notes withdrawal requests still exceed available liquidity. Blue Owl logged $4.7bn of redemption requests against its 5% cap, and private credit stocks fell again in June on Cliffwater redemptions. Morningstar ties the de-rating to underwriting quality, retail redemption caps and software-borrower concentration.
Fundamentals confirm; prices don't
Blackstone posted record $1.35T AUM, FRE +22% and ~$70bn of inflows — and the stock closed down 0.72% at $121.94 with FRE margin flat. BAM raised $21bn in the quarter and $67bn YTD, its biggest fundraising year ever. Deal flow is real too: the $100bn AI Infrastructure Fund with $5bn committed and the Bloom Energy framework raised fivefold to $25bn on 30 June — dated to the exact cohort peak, before BE's -39% month. The Desk's own May shortlist already had BAM, BX and KKR pending a band flip that still hasn't come. The test isn't over: KKR reports 30 July, APO 4 August and Brookfield Corporation 13 August.