

Gas E&Ps: a two-stock bounce, not a sector turn
Prompt v1.0
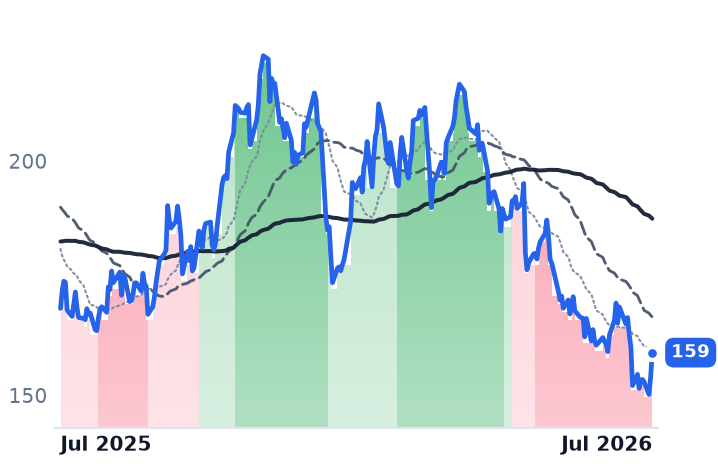
The natural-gas "early uptrend" is really two non-gas stories — SM Energy on oil and capital returns, Venture Global on contracts and arbitration wins. Every actual gas producer in the cohort (EQT, EXE, RRC, AR, CNX, GPOR) is in a strongly bearish band, down 7-16% over 90 days and 19-29% off 52-week highs, with the working parts of the complex sitting in LNG infrastructure and midstream instead.
| Ticker | Company | Segment | Trend · 13mo | 30D | 1Y |
|---|---|---|---|---|---|
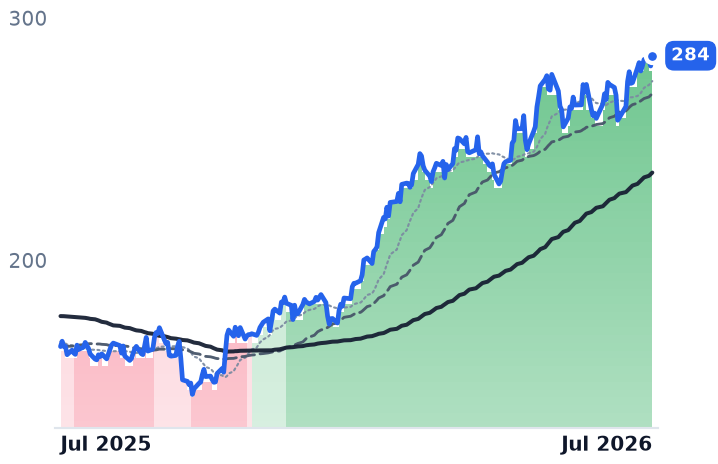
SM | SM Energy | Permian Basin Focused | 🌱 Emerging Bull | +27.0% | +18.7% |
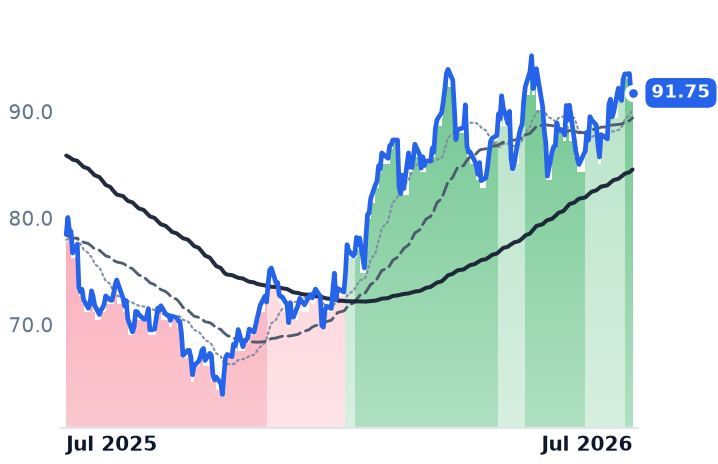
VG | Venture Global | LNG Export & Infrastructure | 🌱 Emerging Bull | +32.9% | −1.8% |
EQT | EQT | Appalachian Shale Gas | ⚠️ Emerging Bear | +0.0% | +1.1% |
EXE | Expand Energy | Appalachian Shale Gas | ⚠️ Emerging Bear | +3.4% | −4.8% |
RRC | Range Resources | Appalachian Shale Gas | 🔴 Cont. Bear | +4.2% | +7.3% |
LNG | Cheniere Energy | LNG Export & Infrastructure | 🟢 Cont. Bull | +4.9% | +12.8% |
AR | Antero Resources | Appalachian Shale Gas | 🔴 Cont. Bear | −1.7% | +3.7% |
CNX | CNX Resources | Appalachian Shale Gas | ⚠️ Emerging Bear | +4.0% | +13.2% |
GPOR | Gulfport Energy | Appalachian Shale Gas | ⚠️ Emerging Bear | −4.1% | −5.6% |
TRGP | Targa Resources | Natural Gas Gathering & Processing | 🟢 Cont. Bull | +4.8% | +73.0% |
OKE | ONEOK | Natural Gas Gathering & Processing | 🌱 Emerging Bull | +3.4% | +16.9% |
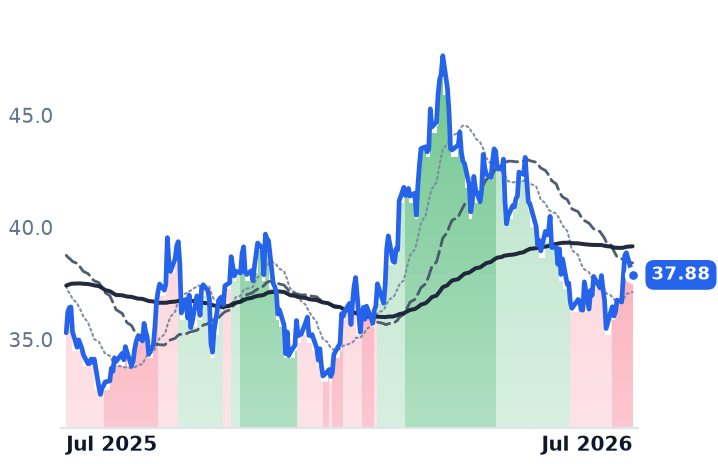
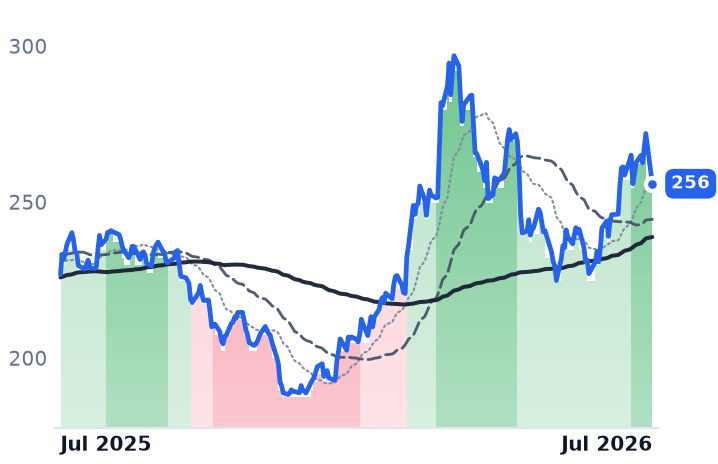
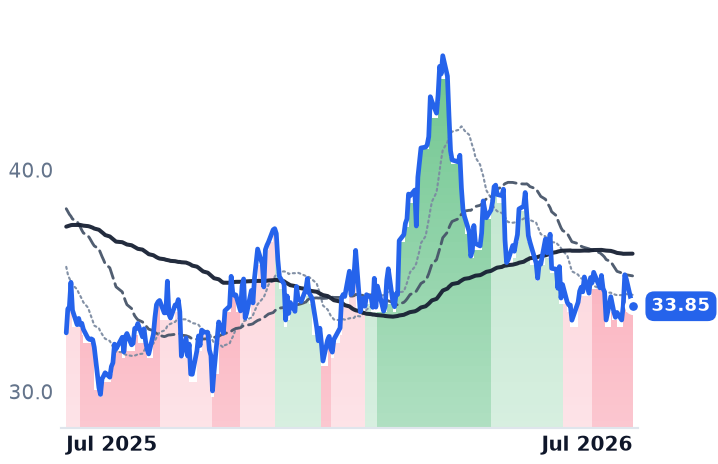
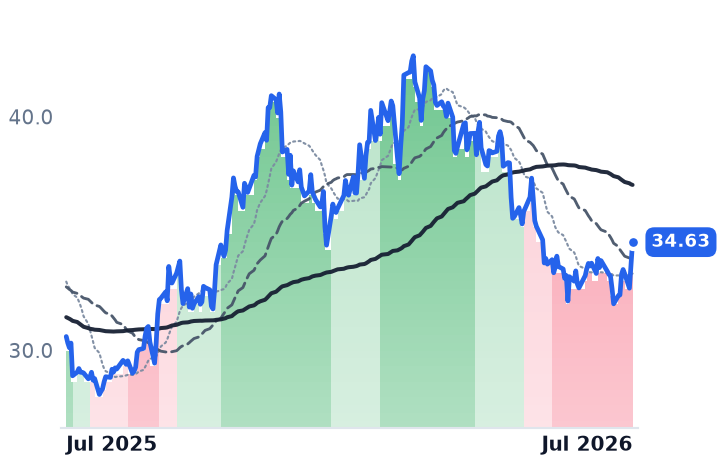
12-month price & trend
| Ticker | Mkt cap | P/E | P/E fwd | P/S | P/S fwd | P/GP | P/GP fwd | EV/EBITDA | FCF yld |
|---|---|---|---|---|---|---|---|---|---|
SM | $3.7B | 28.7x | 4.6x | 1.0x | 0.5x | 2.2x | 1.2x | 4.9x | -6.0% |
VG | $34.2B | 10.3x | 9.2x | 2.0x | 1.9x | 4.2x | 3.9x | 4.4x | -27.5% |
EQT | $33.8B | 11.9x | 12.8x | 3.6x | 3.6x | 5.3x | 5.2x | 6.4x | 11.1% |
| Ticker | Mkt cap | P/E | P/E fwd | P/S | P/S fwd | P/GP | P/GP fwd | EV/EBITDA | FCF yld |
|---|---|---|---|---|---|---|---|---|---|
EXE | $21.9B | 8.1x | 10.3x | 1.6x | 1.6x | 2.6x | 2.6x | 3.8x | 11.6% |
RRC | $9.3B | 11.0x | 9.7x | 2.8x | 2.6x | 5.9x | 5.5x | 7.2x | 12.6% |
LNG | $56.9B | 20.1x | — | 2.6x | 2.6x | 4.8x | 4.8x | 10.0x | 12.4% |
| Ticker | Mkt cap | P/E | P/E fwd | P/S | P/S fwd | P/GP | P/GP fwd | EV/EBITDA | FCF yld |
|---|---|---|---|---|---|---|---|---|---|
AR | $11.6B | 10.8x | 9.0x | 2.0x | 1.7x | 4.4x | 3.8x | 6.8x | 12.1% |
CNX | $5.3B | 5.3x | 11.6x | 2.2x | 2.4x | 4.5x | 4.9x | 4.1x | 9.8% |
GPOR | $3.1B | 6.8x | 7.3x | 2.1x | 2.0x | 3.4x | 3.3x | 4.3x | 8.1% |
| Ticker | Mkt cap | P/E | P/E fwd | P/S | P/S fwd | P/GP | P/GP fwd | EV/EBITDA | FCF yld |
|---|---|---|---|---|---|---|---|---|---|
TRGP | $55.1B | 24.4x | 23.6x | 3.3x | 2.8x | 9.0x | 7.6x | 15.5x | 1.1% |
OKE | $54.5B | 14.9x | 15.1x | 1.4x | 1.3x | 6.3x | 6.0x | 11.0x | 5.3% |
Consensus projections
| Ticker | FY2026E | FY2027E | FY2028E | |
|---|---|---|---|---|
SM | Revenue | +119.1% | +3.2% | +1.1% |
| EPS | +30.2% | +5.8% | +4.3% | |
VG | Revenue | +33.3% | −12.6% | +29.6% |
| EPS | +83.8% | −52.8% | +75.1% | |
EQT | Revenue | +12.9% | −0.5% | +9.5% |
| EPS | +43.8% | −5.2% | +31.6% | |
EXE | Revenue | +17.6% | −3.0% | +4.6% |
| EPS | +52.6% | −4.4% | +15.1% | |
RRC | Revenue | +17.7% | +2.8% | +7.2% |
| EPS | +41.8% | −3.5% | +16.8% | |
LNG | Revenue | +11.9% | +6.0% | +3.4% |
| EPS | −141.4% | −345.2% | −8.0% | |
AR | Revenue | +30.3% | +0.3% | +7.0% |
| EPS | +130.9% | +1.8% | +26.1% | |
CNX | Revenue | +6.9% | +0.7% | +5.8% |
| EPS | +42.1% | +37.2% | +18.2% | |
GPOR | Revenue | +10.7% | +1.2% | +5.4% |
| EPS | +8.7% | +18.6% | +31.9% | |
TRGP | Revenue | +16.8% | +16.2% | +10.1% |
| EPS | +27.5% | +14.5% | +17.8% | |
OKE | Revenue | +25.2% | −5.2% | +2.7% |
| EPS | +6.0% | +9.1% | +10.8% |
Forward fiscal years only. Blank means no analyst coverage for that year.
The breadth test fails
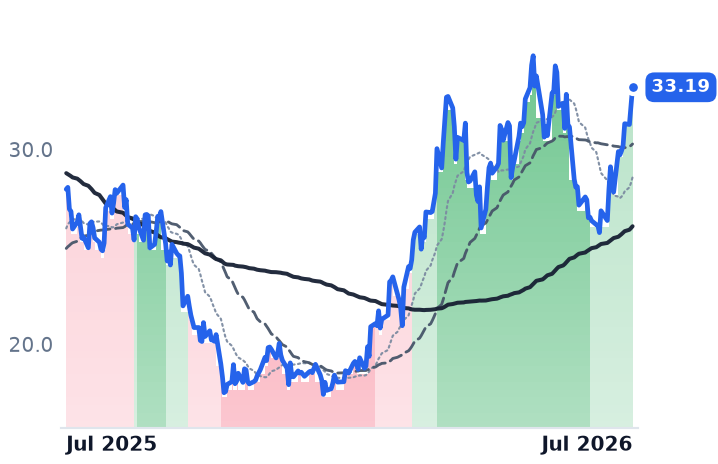
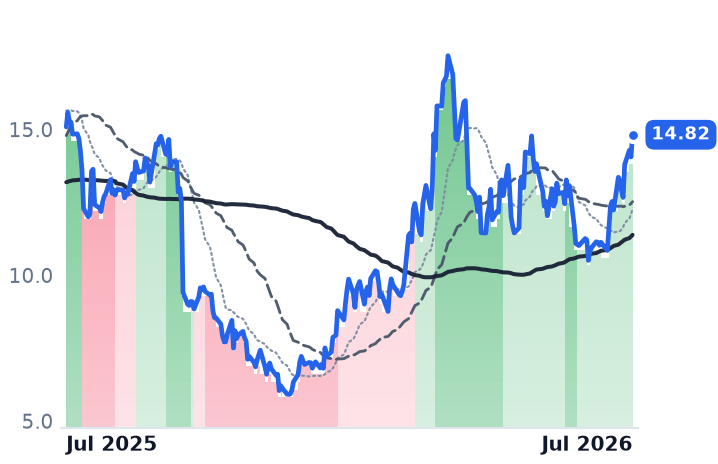
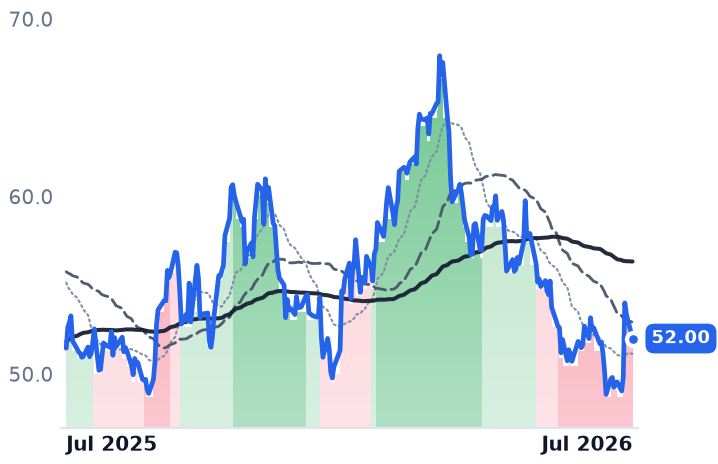
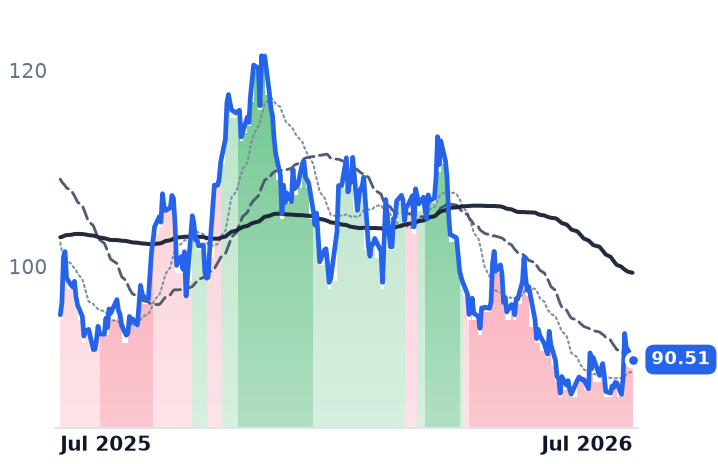
Over the trailing 30 days only SM Energy (+20.4%) and Venture Global (+31.6%) cleared a double-digit gain. Every actual gas producer was flat: EQT -1.3%, Expand Energy +2.3%, Range +0.8%, Antero +3.6%, CNX +4.3%, Gulfport -2.0%. Over 90 days the group is down 7-16%, and each name sits 19-29% below its 52-week high. All six are in a strongly bearish SMA-crossover band — EXE since April 14 (72 sessions), GPOR since May 12, CNX since June 1, EQT since June 9, AR since July 1, RRC since July 14. EXE closed at a 52-week low of $86.95 on July 20. The last five sessions' 3-6% gains came off those fresh lows: an oversold bounce inside bear bands, not a broadening advance. Notably, SM's own trend band downgraded from strongly bullish to mildly bullish on June 25 even as price rallied 20%, and VG's 31.6% move never produced strongly bullish confirmation.
The two leaders aren't gas stories
SM is a Permian, oil-weighted name; its July surge followed a double-digit dividend hike and debt reduction against FY26 guidance built on a $60/Bbl WTI deck while WTI ran above $92 on Middle East supply fears. Venture Global's re-rating is contract- and litigation-specific: a second ICC arbitration win, this one against Repsol, plus CP2 Phase 2 FID and $8.6B of project financing.
The macro leg is softer than assumed
Henry Hub prompt settled at $2.94/MMBtu on July 10 after 30 straight days above $3, with the 12-month strip softening more than 2% and Lower-48 output at ~110.4 Bcf/d. EIA sees 2027 averaging about $3.49/MMBtu against record production of 120.8 and 122.3 Bcf/d in 2026-27. Even record summer heat failed to spark a rally, and producers are openly waiting for demand to absorb supply as 2027 prices enter a "red zone". The demand milestones are real — feedgas above 20 Bcf/d, Plaquemines past 4 Bcf/d, Golden Pass in service — yet the curve stayed flat. The user's own notes describe a mid-$3s strip out to the 2030s that embeds no recognition of a coming deficit.
Where it is working
Cheniere upgraded to strongly bullish on July 14 and raised FY26 EBITDA guidance to $7.25-7.75B. Targa is at a 52-week high (+48.5% over 180 days); OKE is +6.3% over 30 days. The datacenter gas trade is landing with midstream and utilities — Meta backing ten Louisiana gas plants and a Williams-operated facility in Ohio, against ~62 GW of Lower-48 datacenter additions through 2030.
The honest framing: EXE at roughly 4x forward EBITDA, CEO-less, holding ~70% of remaining core Haynesville locations, is a deep-value dislocation set against a bearish tape — not a confirmed uptrend.