

CrowdStrike's -58.6% "slide" is a stock split; the security cohort is in a bull run
Prompt v1.0
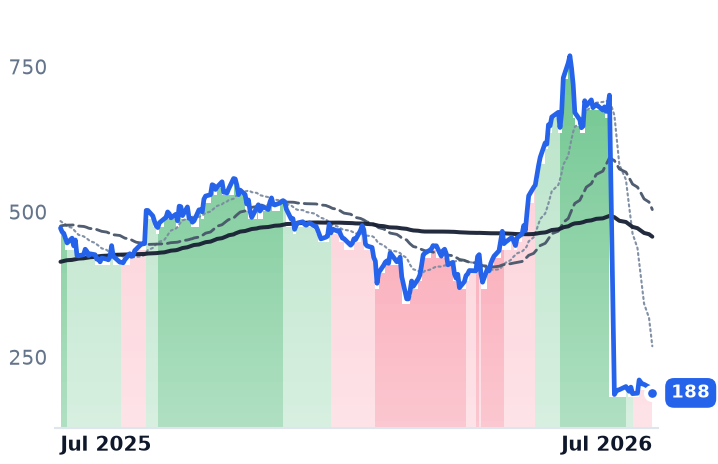
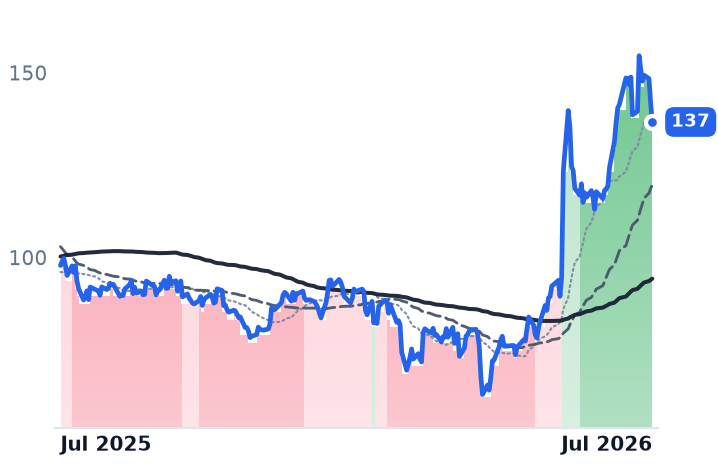
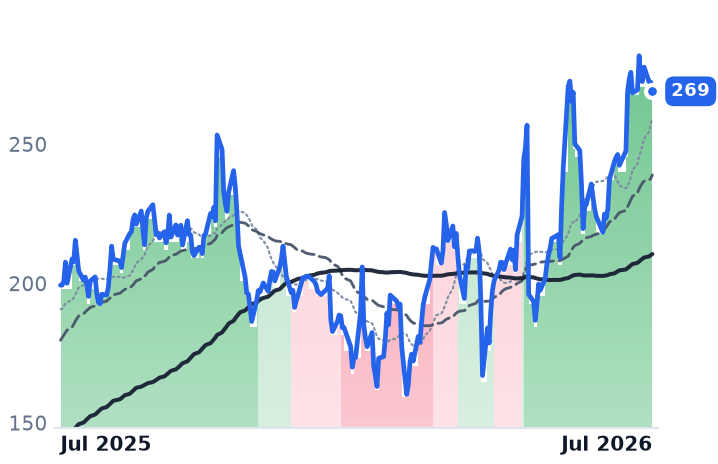
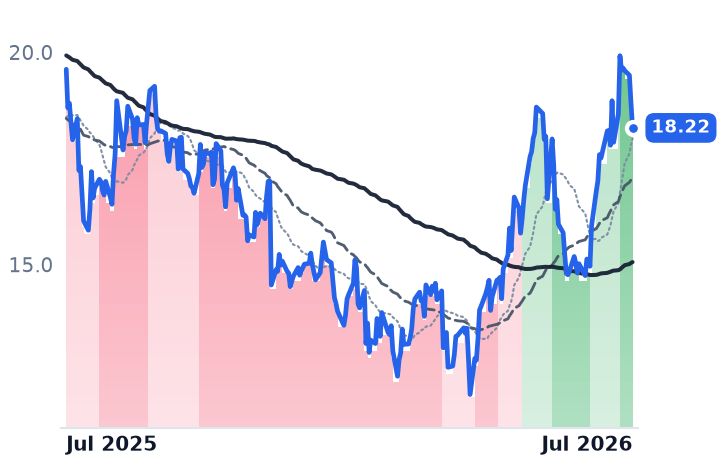
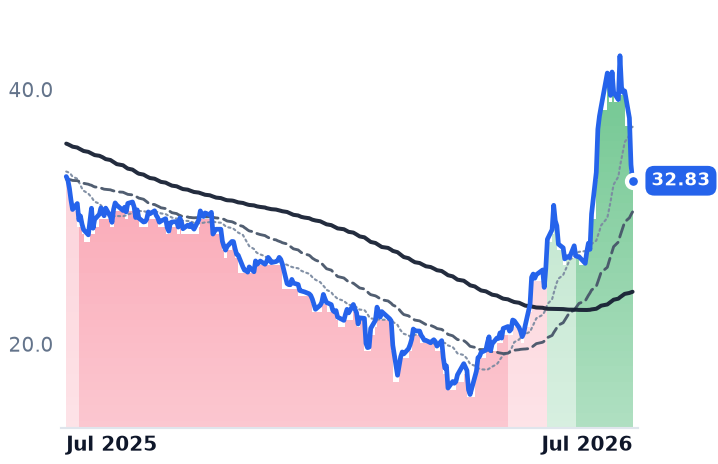
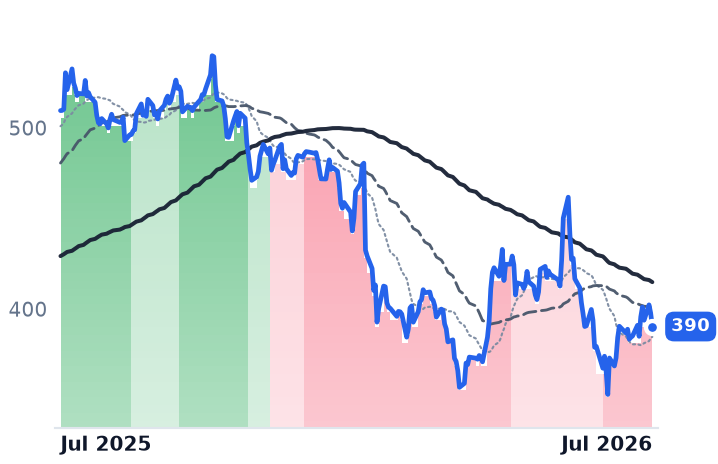
CRWD's apparent -58.6% three-month drawdown is a 4-for-1 split artifact in unadjusted local price history. Split-adjusted, CRWD is up ~69% over three months, and PANW (+93.6%), FTNT (+87.3%) and OKTA (+79.8%) sit in strongly bullish bands — Zscaler is the cohort's lone genuine breakdown, and it is late-stage, not leading-edge.
| Ticker | Company | Segment | Trend · 13mo | 30D | 1Y |
|---|---|---|---|---|---|
CRWD | CrowdStrike | Cybersecurity & Threat Protection | 🟢 Cont. Bull | +1.4% | −60.1% |
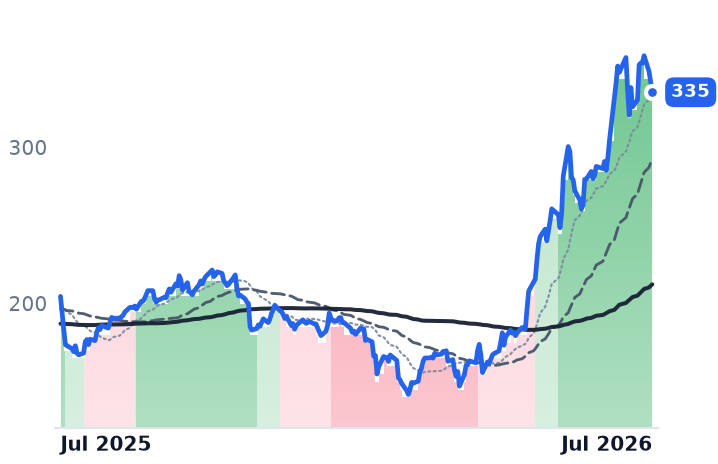
PANW | Palo Alto Networks | Cybersecurity & Threat Protection | 🌱 Emerging Bull | +1.0% | +64.0% |
FTNT | Fortinet | Network Security Appliances | 🌱 Emerging Bull | −0.2% | +47.8% |
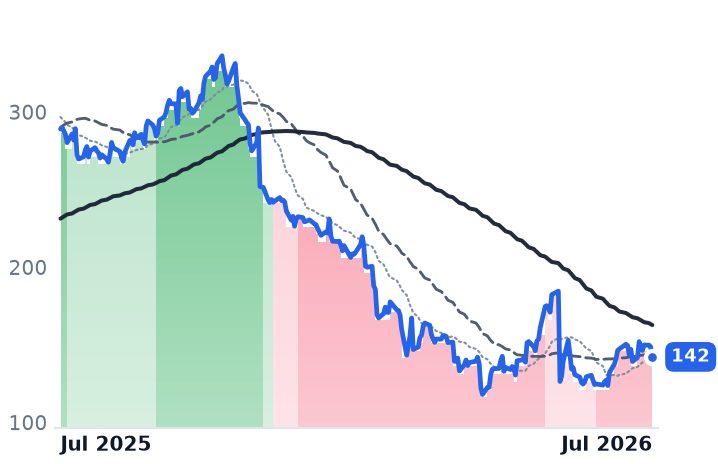
ZS | Zscaler | AI & Data Intelligence | 🔴 Cont. Bear | +3.4% | −50.8% |
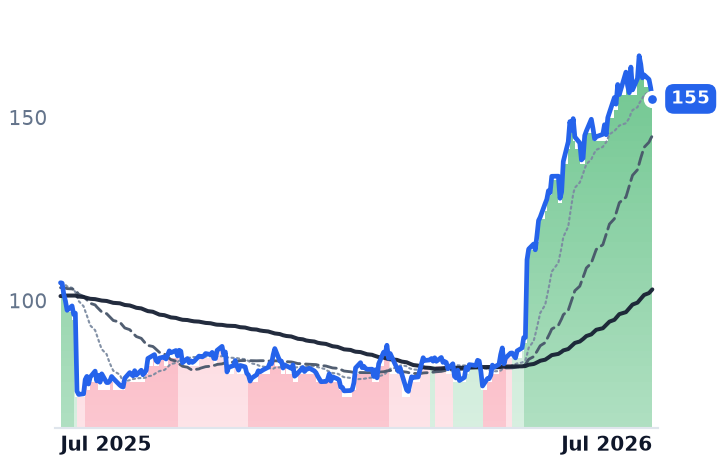
OKTA | Okta | Identity & Access Management | 🌱 Emerging Bull | +4.1% | +39.7% |
NET | Cloudflare | Network & Application Delivery | 🟢 Cont. Bull | +10.3% | +34.9% |
S | SentinelOne | Cybersecurity & Threat Protection | 🌱 Emerging Bull | +8.9% | −7.0% |
TENB | Tenable | Cybersecurity & Threat Protection | 🌱 Emerging Bull | −2.0% | −1.0% |
MSFT | Microsoft | Cloud Infrastructure & Platforms | 🔴 Cont. Bear | +5.9% | −23.4% |
12-month price & trend
| Ticker | Mkt cap | P/E | P/E fwd | P/S | P/S fwd | P/GP | P/GP fwd | EV/EBITDA | FCF yld |
|---|---|---|---|---|---|---|---|---|---|
CRWD | $220.9B | n/m | 176.2x | 43.4x | 37.2x | 57.8x | 49.5x | 648.9x | 0.7% |
PANW | $313.2B | 322.9x | 93.4x | 29.5x | 22.6x | 41.0x | 31.5x | 137.3x | 1.4% |
FTNT | $117.4B | 55.9x | 46.8x | 15.6x | 14.5x | 19.4x | 18.1x | 39.7x | 2.7% |
| Ticker | Mkt cap | P/E | P/E fwd | P/S | P/S fwd | P/GP | P/GP fwd | EV/EBITDA | FCF yld |
|---|---|---|---|---|---|---|---|---|---|
ZS | $29.7B | n/m | 40.1x | 9.4x | 7.6x | 12.2x | 9.9x | 251.1x | 3.2% |
OKTA | $23.8B | 102.3x | 37.2x | 7.9x | 7.4x | 10.3x | 9.6x | 65.1x | 3.8% |
NET | $109.0B | n/m | 256.6x | 43.4x | 38.8x | 59.8x | 53.5x | — | 0.3% |
| Ticker | Mkt cap | P/E | P/E fwd | P/S | P/S fwd | P/GP | P/GP fwd | EV/EBITDA | FCF yld |
|---|---|---|---|---|---|---|---|---|---|
S | $7.2B | n/m | 61.3x | 6.9x | 6.0x | 9.3x | 8.1x | n/m | 0.6% |
TENB | $2.4B | n/m | 11.0x | 2.3x | 2.2x | 3.0x | 2.8x | 23.3x | 11.1% |
MSFT | $3.7T | 27.5x | 25.2x | 11.1x | 9.4x | 16.3x | 13.9x | 18.2x | 1.8% |
Consensus projections
| Ticker | FY2026E | FY2027E | FY2028E | |
|---|---|---|---|---|
CRWD | Revenue | +22.2% | +23.7% | +21.8% |
| EPS | −1.2% | +32.6% | +26.5% | |
PANW | Revenue | +24.3% | +21.1% | +14.1% |
| EPS | +15.3% | +9.0% | +17.6% | |
FTNT | Revenue | +19.8% | +11.3% | +10.9% |
| EPS | +27.0% | +9.4% | +13.3% | |
ZS | Revenue | +25.2% | +16.9% | +16.7% |
| EPS | +29.0% | +11.2% | +17.6% | |
OKTA | Revenue | +12.0% | +10.0% | +9.5% |
| EPS | +24.3% | +11.7% | +10.8% | |
NET | Revenue | +31.0% | +27.9% | +27.4% |
| EPS | +31.0% | +32.8% | +38.3% | |
S | Revenue | +22.4% | +19.9% | +17.6% |
| EPS | +723.4% | +83.7% | +43.0% | |
TENB | Revenue | +8.4% | +7.1% | +6.9% |
| EPS | +27.0% | +10.5% | +10.1% | |
MSFT | Revenue | +18.0% | +18.2% | +19.6% |
| EPS | +26.7% | +15.4% | +18.5% |
Forward fiscal years only. Blank means no analyst coverage for that year.
The artifact
The premise fails at the data layer. CrowdStrike's board approved a 4-for-1 forward stock split on June 3, 2026, with a June 25 record date and split-adjusted trading from July 2. The local prices table restates CRWD onto the post-split basis beginning 2026-06-29 (close $185.73) while leaving prior history unadjusted (2026-06-26 close $701.09), and adj_close equals close on every row — so the -73.5% one-day "drop" on 19.76M shares is a boundary, not a sell-off. Independent reporting confirms CRWD actually rose ~7% that session to $747.84 pre-split — $185.73 × 4 = $742.91.
Corrected, CRWD is up ~69% over three months ($111.35 split-adjusted on 2026-04-22 to $188.42 on 2026-07-22), ~12% over 30 days and ~67% over 180 days. Its 2026-07-22 close sits only ~10.6% below the post-split record of $210.73 set July 14. Its mildly bearish band reading is itself distorted by the same unadjusted gap feeding the SMA inputs.
The cohort is going the other way
Three-month changes to 2026-07-22: PANW +93.6%, FTNT +87.3%, OKTA +79.8%, TENB +68.5%, NET +31.2%, S +30.9%. PANW, FTNT, OKTA, NET, S and TENB all print strongly bullish (score +3). The fundamentals corroborate: CrowdStrike posted record Q1 FY27 net-new ARR of $256M, up 32%, with FY27 net-new-ARR growth guidance raised 520bps; Palo Alto reported Q3 FY26 revenue +31% and NGS ARR +60% to $8.1B; Okta beat and raised, gapping +30.1% on 2026-05-29. Sell-side is raising, not cutting — Wells Fargo lifted Okta's target 50% to $150 and Fortinet's 71% to $120 in mid-July, and the group re-rated again on the June CPI print, with CRWD +11% and PANW +7% on July 14.
Where the real breakdown sits
Zscaler is the only strongly bearish. It traces to one dateable event: a -31.5% crash on 2026-05-27 on record 31.47M shares, driven by an FY27 ARR growth guide of 16-17%, an FCF-margin cut to 22.8-23.3% from 26.5-27%, and two sales-leader exits. ZS has since recovered to $142.26 but remains -58% below its 52-week high — washed out, not early.
The macro drivers also invert. MSFT itself is in strongly bearish and down over 3, 6 and 12 months, and Microsoft's Agent 365 bundling at $15/user/month inside a $99 enterprise suite is a per-seat price raise, not security deflation. UBS pegs cybersecurity spend growing 13% in 2026 to $240B. Data hygiene notes: CYBR has no rows (absorbed into PANW's $25B acquisition, closed February 2026) and QLYS is stale since 2026-05-19.