

India small/mid breadth was real — but it began in April, and MPS was last
Prompt v1.0
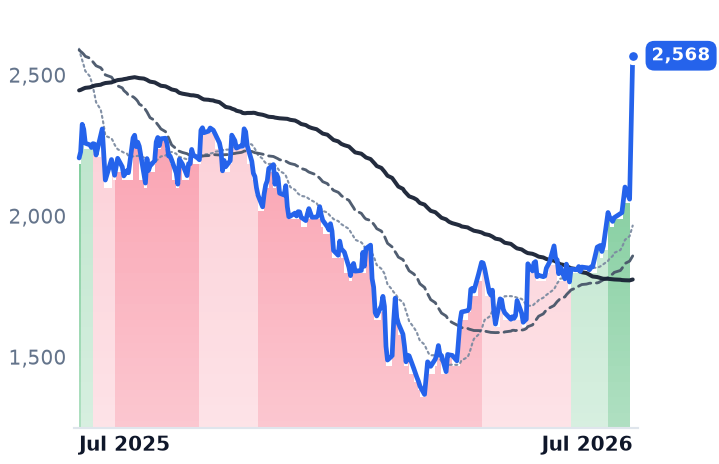
Eight of nine India watchlist names flipped out of bear bands between 22 April and 4 June 2026, and seven are up 29%+ over 90 days — so the breadth thesis holds. But MPS Ltd was the laggard, not the leader, and its +24.7% two-session gap on an earnings beat was idiosyncratic. The named corroborators — HUDCO, NBCC, GMDCLTD — are the three that didn't participate.
| Ticker | Company | Segment | Trend · 13mo | 30D | 1Y |
|---|---|---|---|---|---|
MPSLTD.BO | MPS | Publishing | 🔴 Cont. Bear | +35.9% | +16.4% |
SKMEGGPROD.BO | SKM Egg Products Export (India) | Packaged Foods | 🟢 Cont. Bull | +2.9% | +111.2% |
PANAMAPET.BO | Panama Petrochem | Oil & Gas Refining & Marketing | 🌱 Emerging Bull | +14.0% | +34.2% |
PARAS.BO | Paras Defence and Space Technologies | Aerospace & Defense | 🌱 Emerging Bull | +3.3% | +73.7% |
PANACEABIO.NS | Panacea Biotec | Biotechnology | 🌱 Emerging Bull | −16.6% | +14.5% |
NRBBEARING.BO | NRB Bearings | Auto - Parts | 🟢 Cont. Bull | −8.9% | +45.8% |
CMPDI.BO | Central Mine Planning & Design Institute | — | 🌱 Emerging Bull | +6.4% | +68.5% |
NBCC.BO | NBCC (India) | Engineering & Construction | ⚠️ Emerging Bear | −9.2% | −12.1% |
HUDCO.BO | Housing and Urban Development | — | 🌱 Emerging Bull | −4.8% | −5.1% |
GMDCLTD.BO | Gujarat Mineral Development | Coal | 🟢 Cont. Bull | −3.0% | +39.6% |
INDA | iShares MSCI India ETF | Asset Management | 🔴 Cont. Bear | −2.0% | −9.4% |
INDY | iShares India 50 ETF | Asset Management | 🔴 Cont. Bear | −2.1% | −11.7% |
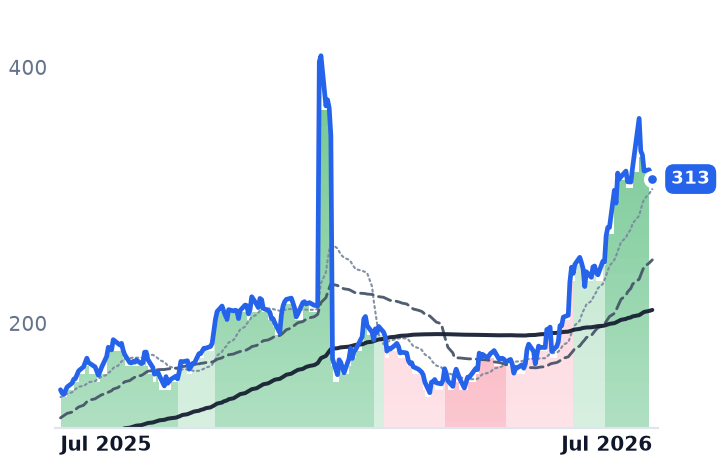
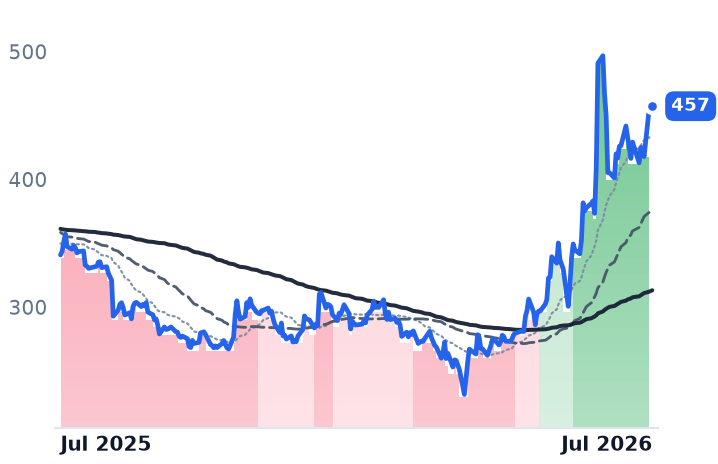
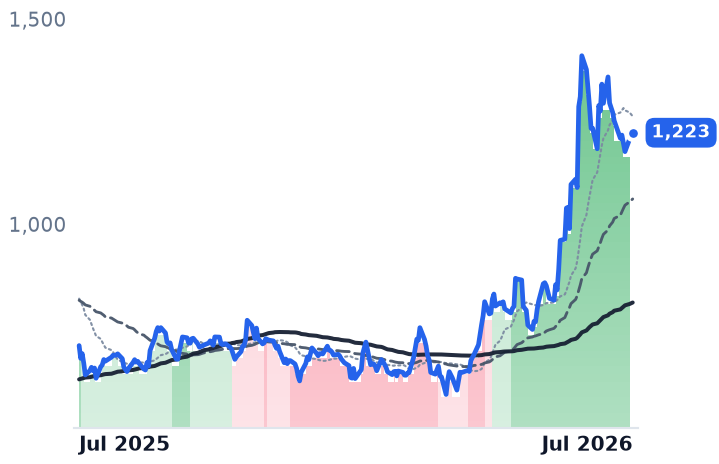
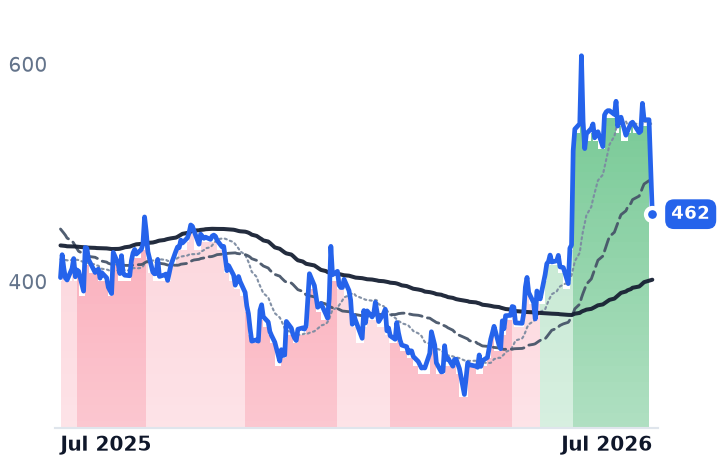
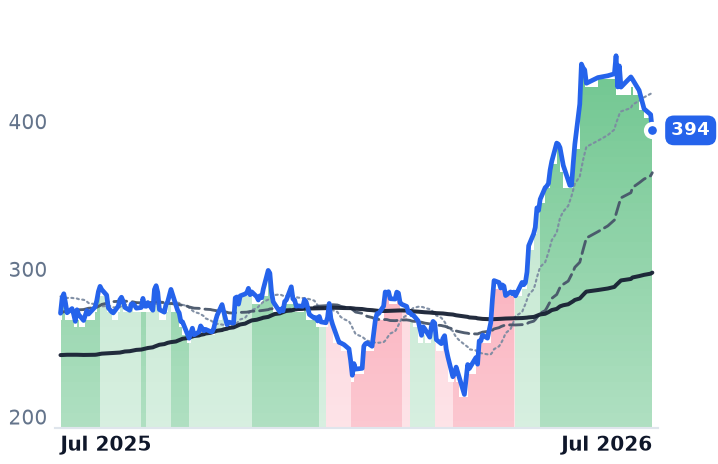
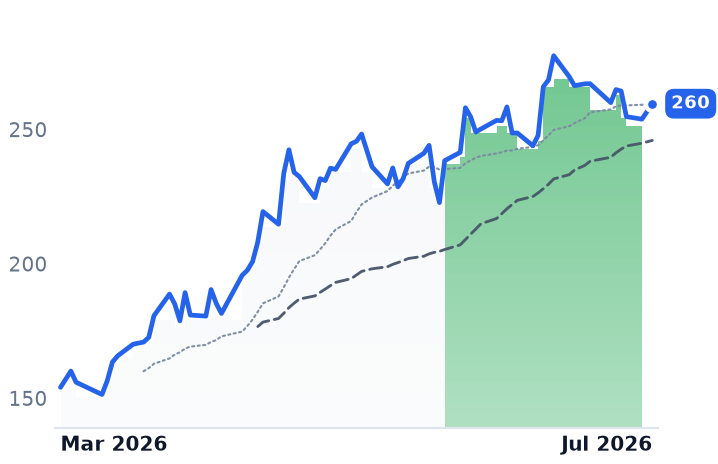
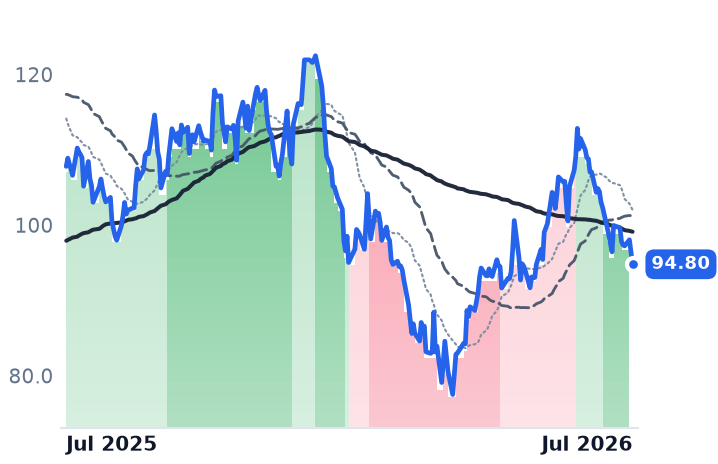
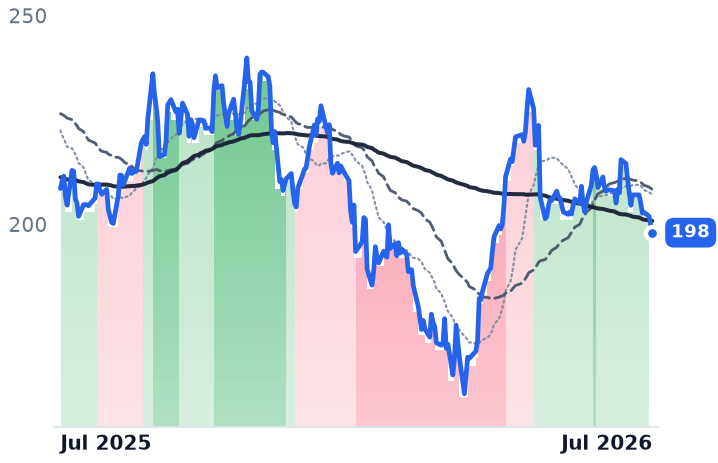
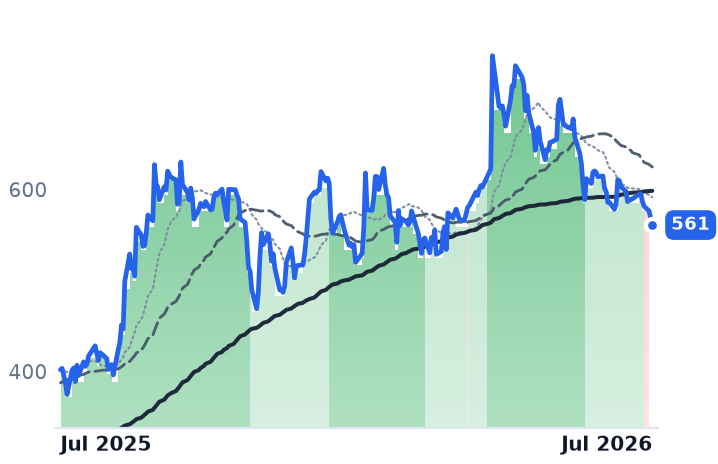
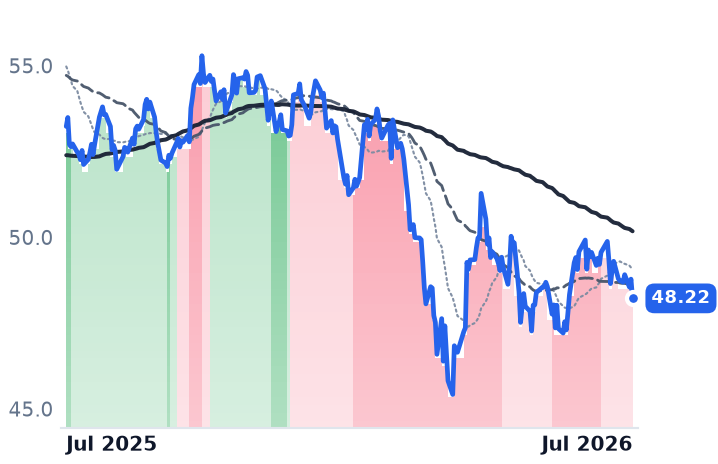
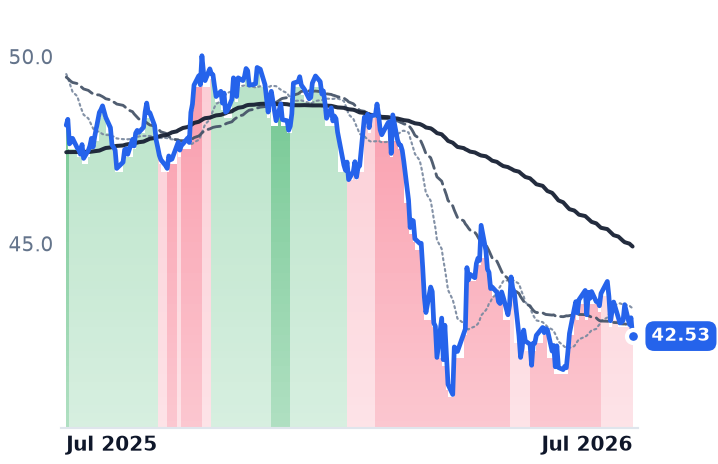
12-month price & trend
| Ticker | Mkt cap | P/E | P/E fwd | P/S | P/S fwd | P/GP | P/GP fwd | EV/EBITDA | FCF yld |
|---|---|---|---|---|---|---|---|---|---|
MPSLTD.BO | $31.1B | 17.9x | 16.3x | 4.2x | 3.4x | 5.2x | 4.2x | 12.9x | 3.2% |
SKMEGGPROD.BO | $13.0B | 12.5x | — | 1.7x | — | 5.9x | — | 8.0x | -1.2% |
PANAMAPET.BO | $18.0B | 9.7x | 27.8x | 0.6x | 1.4x | 3.9x | 8.7x | 6.7x | 1.6% |
| Ticker | Mkt cap | P/E | P/E fwd | P/S | P/S fwd | P/GP | P/GP fwd | EV/EBITDA | FCF yld |
|---|---|---|---|---|---|---|---|---|---|
PARAS.BO | $63.1B | 85.9x | 57.6x | 15.3x | 11.5x | 32.0x | 24.0x | 56.3x | -0.6% |
PANACEABIO.NS | $23.5B | n/m | — | 3.9x | — | 7.8x | — | 81.7x | -1.1% |
NRBBEARING.BO | $33.6B | 23.6x | 23.1x | 2.5x | 2.5x | 5.5x | 5.5x | 13.8x | 2.4% |
| Ticker | Mkt cap | P/E | P/E fwd | P/S | P/S fwd | P/GP | P/GP fwd | EV/EBITDA | FCF yld |
|---|---|---|---|---|---|---|---|---|---|
CMPDI.BO | — | — | — | — | — | — | — | — | — |
NBCC.BO | $257.8B | 39.4x | 29.4x | 2.0x | 1.5x | 22.5x | 17.3x | 26.3x | -4.3% |
HUDCO.BO | — | — | — | — | — | — | — | — | — |
| Ticker | Mkt cap | P/E | P/E fwd | P/S | P/S fwd | P/GP | P/GP fwd | EV/EBITDA | FCF yld |
|---|---|---|---|---|---|---|---|---|---|
GMDCLTD.BO | $211.1B | 21.3x | 29.0x | 8.0x | 5.9x | 21.8x | 16.1x | 15.1x | 0.0% |
INDA | $9.5B | — | — | — | — | — | — | — | — |
INDY | $585.3M | — | — | — | — | — | — | — | — |
Consensus projections
| Ticker | FY2026E | FY2027E | FY2028E | |
|---|---|---|---|---|
MPSLTD.BO | Revenue | +5.5% | +17.7% | +14.1% |
| EPS | +14.0% | +16.8% | +18.4% | |
PANAMAPET.BO | Revenue | +6.2% | +58.1% | +21.7% |
| EPS | −66.7% | +61.0% | +12.6% | |
PARAS.BO | Revenue | +31.0% | +23.5% | +20.1% |
| EPS | +46.6% | +27.1% | +22.1% | |
NRBBEARING.BO | Revenue | +10.5% | +13.6% | +11.6% |
| EPS | +32.7% | +15.4% | +14.7% | |
NBCC.BO | Revenue | +36.2% | +21.2% | +22.7% |
| EPS | +11.4% | +32.7% | +21.5% | |
GMDCLTD.BO | Revenue | −6.7% | +32.1% | +20.4% |
| EPS | +1.4% | +9.0% | +22.3% |
Forward fiscal years only. Blank means no analyst coverage for that year.
The inflection is real, and it is dateable
Trend bands across the India watchlist cluster tightly: PARAS.BO exited bear on 22 April 2026, NRBBEARING.BO on 30 April, HUDCO.BO on 11 May, PANAMAPET.BO and PANACEABIO.NS mid-May, SKMEGGPROD.BO on 4 June. Over the trailing 90 days to 22 July, seven of ten names gained more than 29% — SKMEGGPROD +81.9%, PANAMAPET +65.2%, MPSLTD +55.0%, PARAS +47.4%, CMPDI +37.1%, NRBBEARING +35.6%, PANACEABIO +29.6%.
The macro trigger is documented, not inferred. The BSE Smallcap index surged 20.1% and the Midcap 14.8% in April 2026 — the sharpest month in 12 years — after a 10.2% March drawdown tied to the US-Iran conflict left smallcap P/Es at 24x-25x. That rebound was funded by domestic institutions deploying ~₹1.9 trillion while FIIs pulled over $20 billion, with foreign selling concentrated in large caps. Context: more than 80% of listed Indian companies above ₹1,000 crore market cap were 20%+ below all-time highs heading into that reset.
Three ways the framing breaks
First, MPS was the last to turn (strongly bullish only from 6 July) and gained just +21.0% from 28 April to 20 July — the weakest advancer. Its move was a gap, not a grind: ₹2,059.80 on 20 July, opening +12.2% on 22 July and closing at the day high of ₹2,568.35 on 96,087 shares versus typical volume of 200-3,000. The drivers were company-specific: Q1 FY27 revenue of ₹224cr and PAT of ₹50.40cr, up ~43% YoY, NCLT approval to amalgamate promoter holdco ADI BPO, and HDFC Securities naming it 'Stock Pick of the Week'. MPS closed at its exact 52-week high; every peer sits 8.5%-28.6% below. At ₹2,568 its trailing multiple re-rates from ~17.9x to ~25x.
Second, the nominated corroborators are the non-participants: NBCC +1.5%, HUDCO -3.2%, GMDCLTD -17.8% over 90 days, with GMDCLTD freshly flipped to mildly bearish on 17 July.
Third, the macro leg is stale. The RBI held at 5.25% on 5 June with a neutral stance and a raised FY27 inflation forecast of 5.1%. July's ₹15,157 crore FPI inflow sits against ₹2.6 trillion of YTD selling. The first-phase India-US trade agreement remains unsigned at the 'last 1 per cent', even after the February joint statement cut reciprocal tariffs from 25% to 18%. GST 2.0's two-slab reset is a 2025-26 tailwind already in prices.
Where the runway went
Valuation has caught up: Nifty Smallcap 250 trades at 36.1x versus a seven-year median near 30x, and the Nifty Midcap 150 sits ~1.4% below its 52-week high. Breadth is decaying — only three of ten names are positive over 30 days — and small caps led declines on 23 July. USD proxies never confirmed: INDA is -2.4% over 90 days and -11.7% over 12 months.