

Nuclear's fuel-vs-developer split is a lag, not a divergence
Prompt v1.0
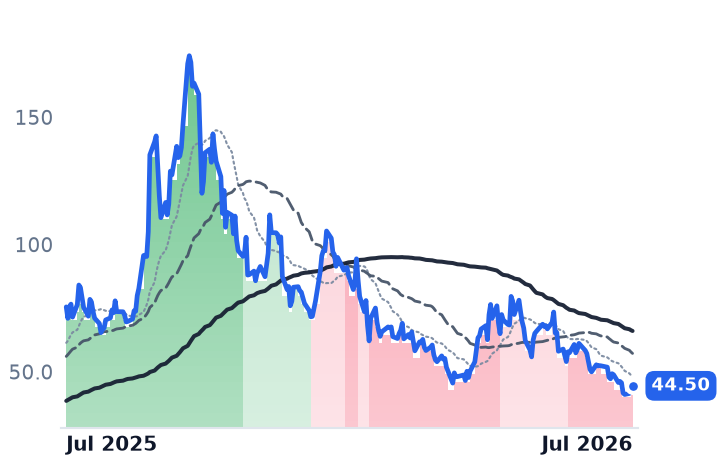
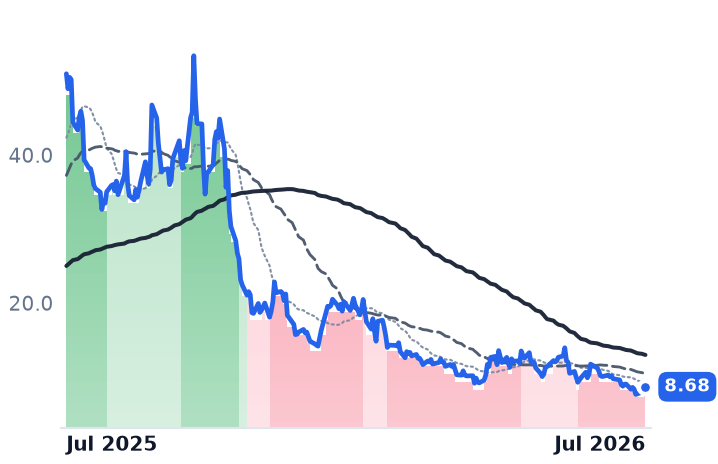
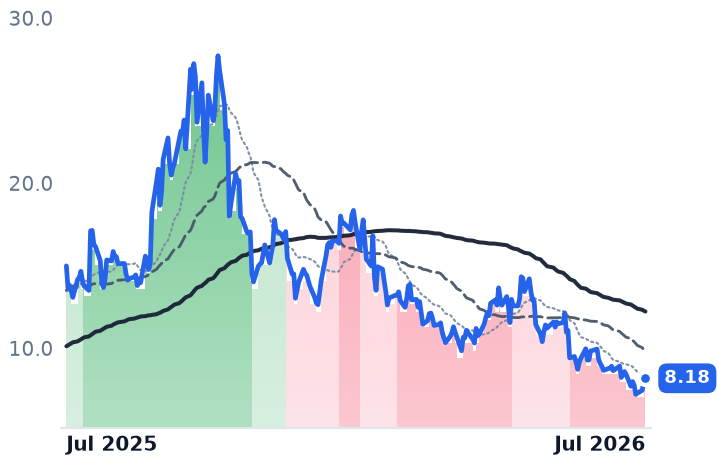
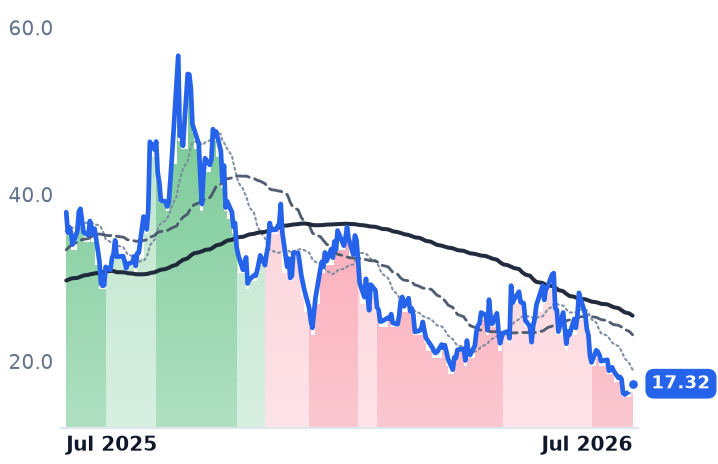
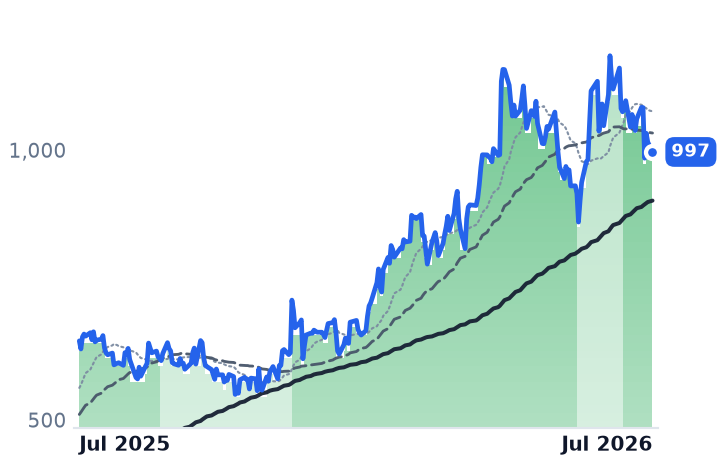
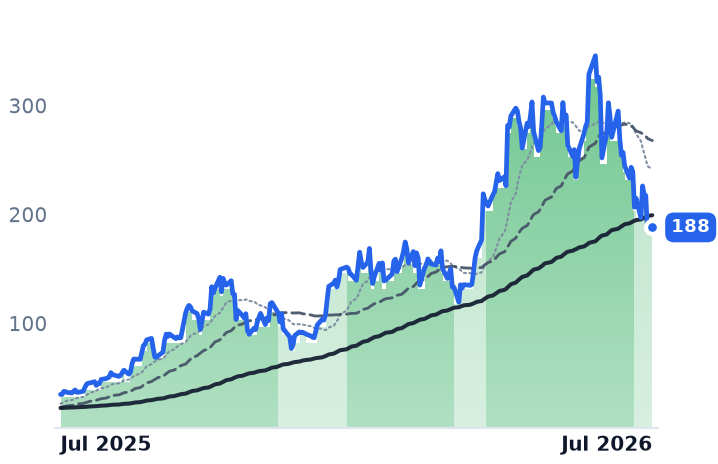
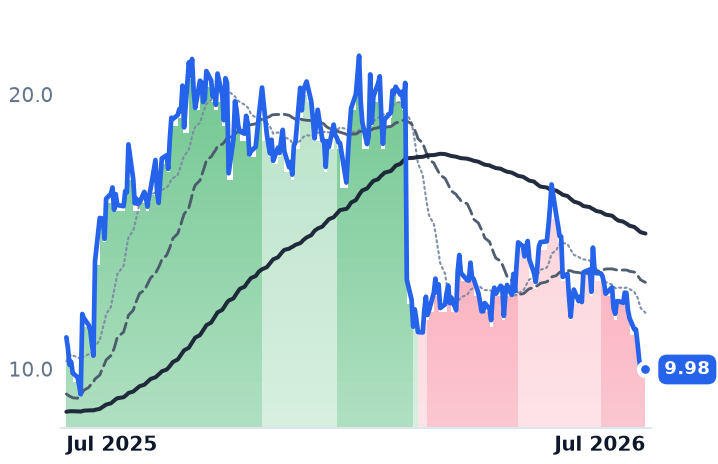
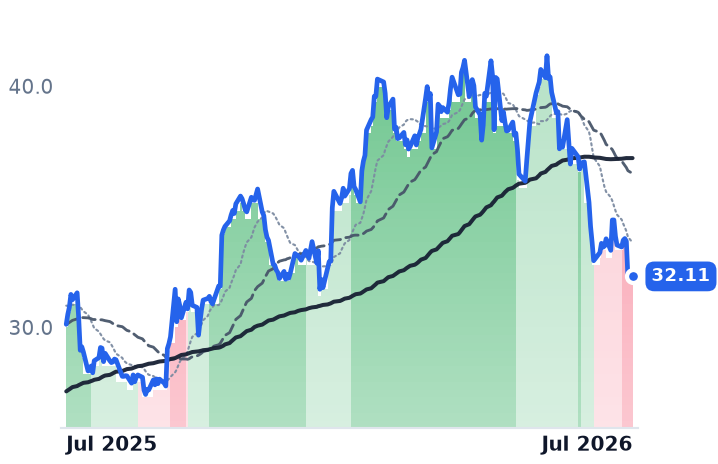
The "fuel layer green while developers bleed" read doesn't survive a same-date test — all 13 nuclear-complex names sit in strongly bearish bands as of 7/22, and the fuel layer simply flipped three to five weeks after the developers. What's left is a quality gap, not a trend gap.
| Ticker | Company | Segment | Trend · 13mo | 30D | 1Y |
|---|---|---|---|---|---|
CCJ | Cameco | Uranium | ⚠️ Emerging Bear | −13.6% | +13.1% |
LEU | Centrus Energy | Uranium | ⚠️ Emerging Bear | +8.8% | −27.2% |
URA | Global X - Uranium ETF | Asset Management | ⚠️ Emerging Bear | −6.7% | +4.7% |
BWXT | BWX Technologies | Naval & Shipbuilding | ⚠️ Emerging Bear | −6.7% | +18.3% |
UEC | Uranium Energy | Uranium | ⚠️ Emerging Bear | −10.2% | +8.2% |
UUUU | Energy Fuels | Uranium | ⚠️ Emerging Bear | −15.6% | +22.6% |
NXE | NexGen Energy | Uranium | ⚠️ Emerging Bear | −2.7% | +32.2% |
DNN | Denison Mines | Uranium | ⚠️ Emerging Bear | −2.2% | +37.4% |
OKLO | Oklo | Emerging & Specialized Energy | ⚠️ Emerging Bear | −15.7% | −41.1% |
SMR | NuScale Power | Advanced Nuclear | 🔴 Cont. Bear | −15.4% | −83.0% |
LTBR | Lightbridge | Electrical Equipment & Parts | ⚠️ Emerging Bear | −6.7% | −45.4% |
NNE | Nano Nuclear Energy | Power & Propulsion Systems | 🔴 Cont. Bear | −18.8% | −54.3% |
EU | enCore Energy | Uranium | ⚠️ Emerging Bear | −9.0% | −60.3% |
CEG | Constellation Energy | Diversified Renewable Generators | ⚠️ Emerging Bear | +6.0% | −16.0% |
VST | Vistra | Integrated Retail & Generation | 🔴 Cont. Bear | +2.7% | −14.5% |
TLN | Talen Energy | Wholesale Power Producers | 🟢 Cont. Bull | −5.5% | +5.2% |
GEV | GE Vernova | GE Vernova Integrated | 🟢 Cont. Bull | −9.6% | +54.1% |
BE | Bloom Energy | Fuel Cell & Hydrogen | 🟢 Cont. Bull | −31.6% | +441.1% |
RUN | Sunrun | Residential Solar Installers | ⚠️ Emerging Bear | −26.0% | −10.5% |
CWEN | Clearway Energy | Wind & Solar Developers | ⚠️ Emerging Bear | −8.7% | +6.6% |
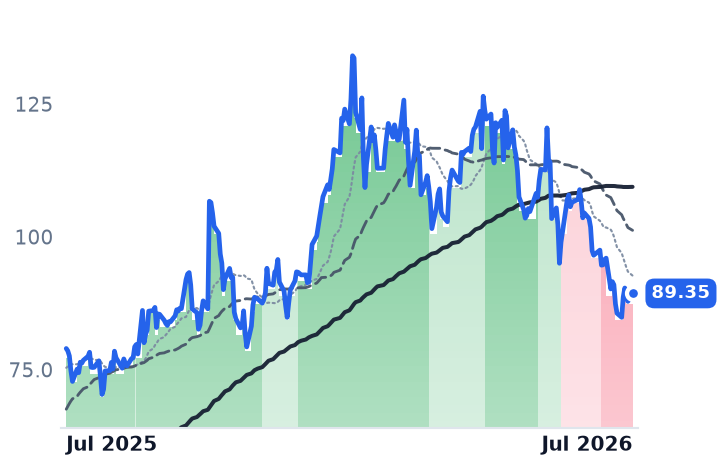
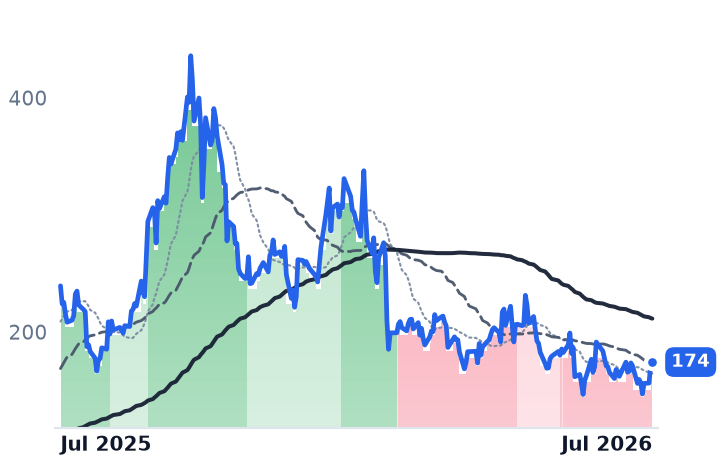
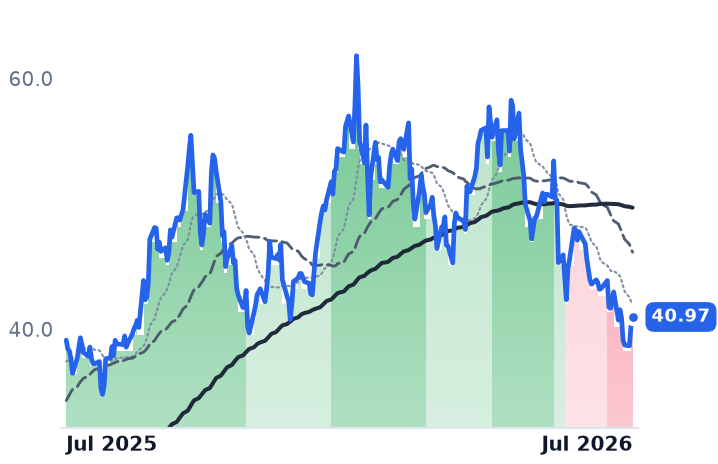
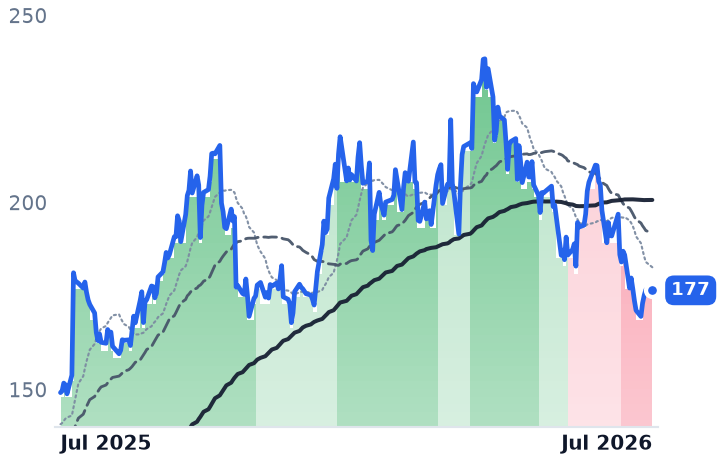
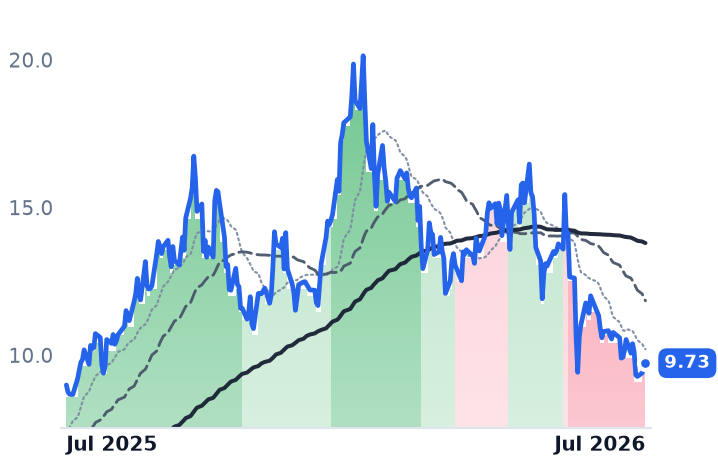
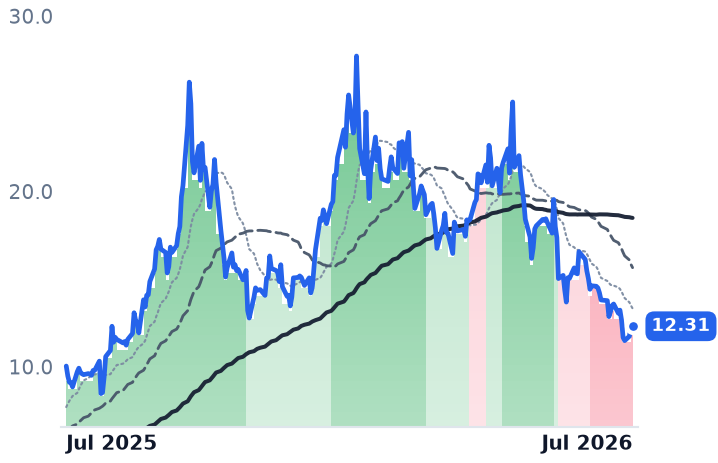
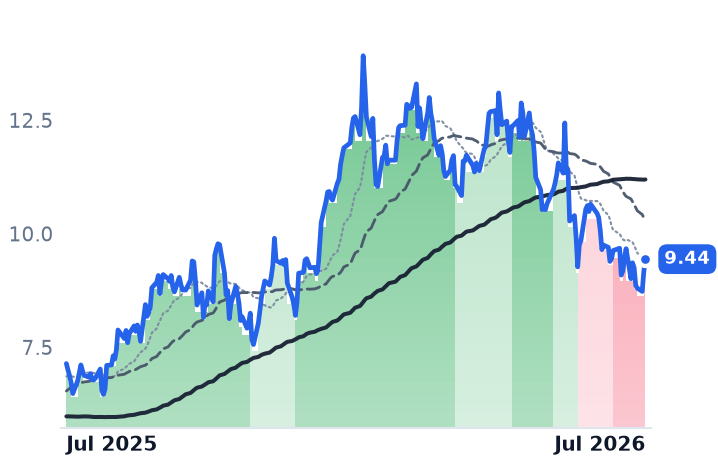
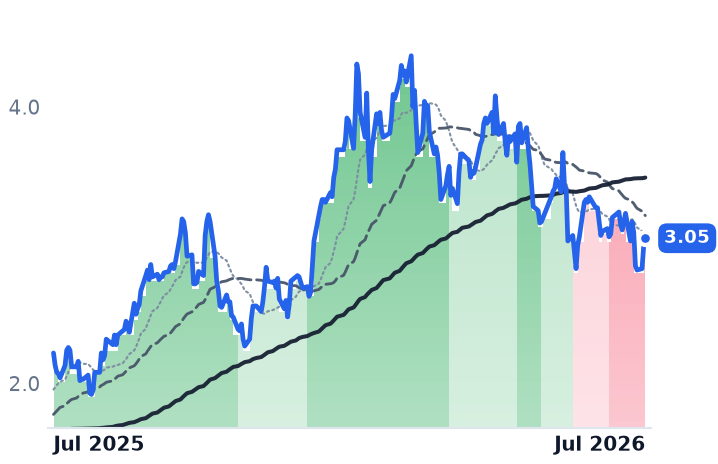
12-month price & trend
| Ticker | Mkt cap | P/E | P/E fwd | P/S | P/S fwd | P/GP | P/GP fwd | EV/EBITDA | FCF yld |
|---|---|---|---|---|---|---|---|---|---|
CCJ | $42.6B | 165.8x | 59.6x | 17.0x | 12.1x | 61.6x | 43.8x | 68.3x | 0.9% |
LEU | $3.6B | 75.8x | 74.3x | 7.6x | 7.9x | 32.7x | 33.8x | 40.1x | -6.2% |
URA | $3.9B | — | — | — | — | — | — | — | — |
| Ticker | Mkt cap | P/E | P/E fwd | P/S | P/S fwd | P/GP | P/GP fwd | EV/EBITDA | FCF yld |
|---|---|---|---|---|---|---|---|---|---|
BWXT | $15.9B | 44.6x | 36.5x | 4.5x | 4.2x | 20.5x | 19.0x | 31.2x | 2.0% |
UEC | $5.5B | n/m | — | 274.6x | 55.3x | 648.9x | 130.6x | n/m | -2.2% |
UUUU | $3.7B | n/m | — | 35.0x | 25.0x | 80.8x | 57.9x | n/m | -3.0% |
| Ticker | Mkt cap | P/E | P/E fwd | P/S | P/S fwd | P/GP | P/GP fwd | EV/EBITDA | FCF yld |
|---|---|---|---|---|---|---|---|---|---|
NXE | $6.9B | n/m | — | n/m | — | — | — | n/m | -2.5% |
DNN | $2.9B | n/m | — | 988.4x | 120.1x | — | — | n/m | -4.1% |
OKLO | $7.7B | n/m | — | — | — | — | — | n/m | -3.6% |
| Ticker | Mkt cap | P/E | P/E fwd | P/S | P/S fwd | P/GP | P/GP fwd | EV/EBITDA | FCF yld |
|---|---|---|---|---|---|---|---|---|---|
SMR | $2.8B | n/m | — | 261.9x | 91.1x | — | 432.7x | n/m | -27.7% |
LTBR | $297.0M | n/m | — | n/m | — | — | — | n/m | -5.7% |
NNE | $1.1B | n/m | — | — | 887.7x | — | — | n/m | -3.7% |
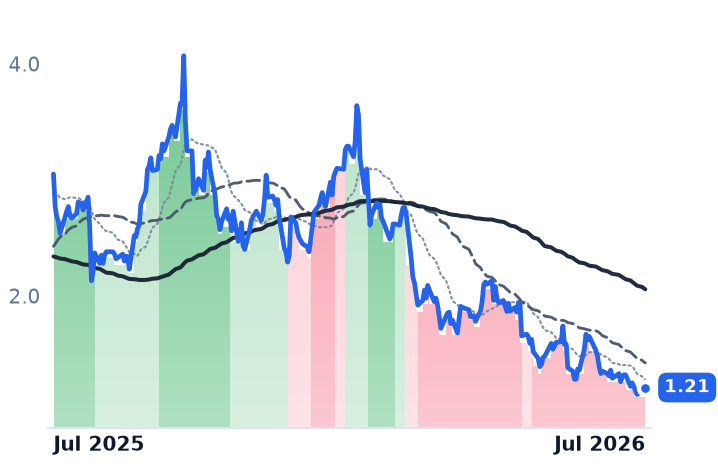
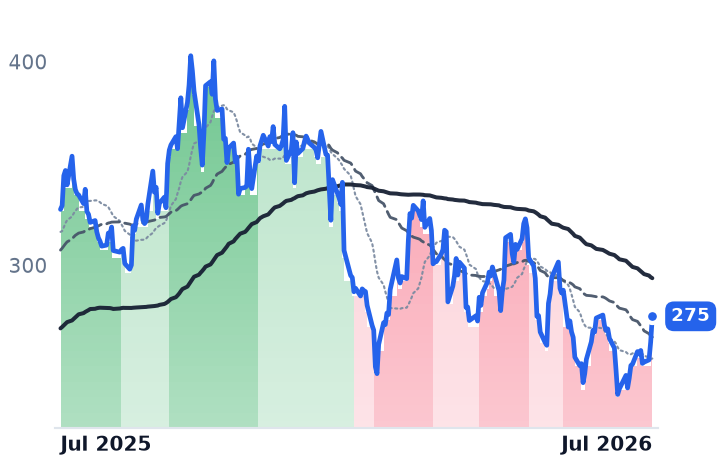
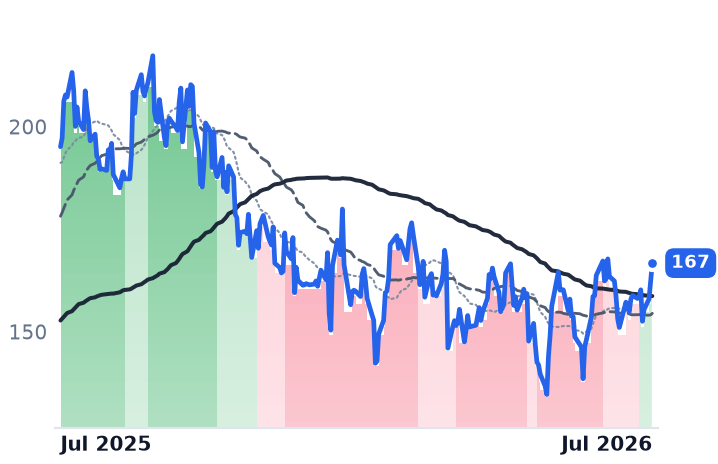
| Ticker | Mkt cap | P/E | P/E fwd | P/S | P/S fwd | P/GP | P/GP fwd | EV/EBITDA | FCF yld |
|---|---|---|---|---|---|---|---|---|---|
EU | $363.2M | n/m | — | 8.8x | 4.1x | 39.1x | 18.2x | n/m | -12.1% |
CEG | $101.4B | 27.5x | 24.1x | 3.2x | 3.1x | 3.4x | 3.2x | 14.7x | 0.3% |
VST | $47.4B | 23.5x | 15.5x | 3.0x | 2.0x | 22.9x | 15.7x | 10.3x | 2.9% |
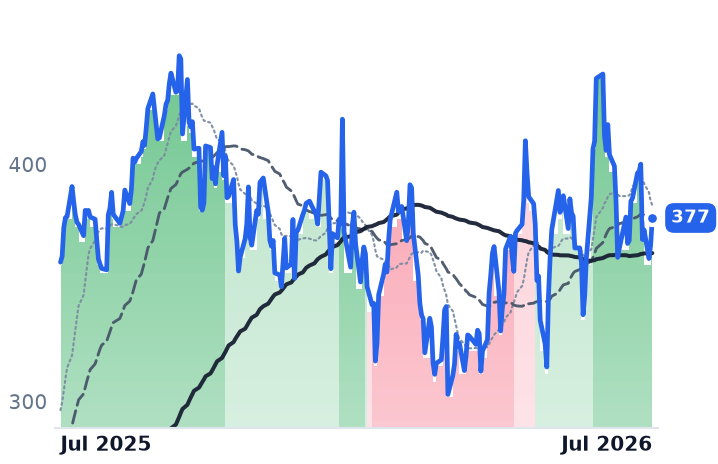
| Ticker | Mkt cap | P/E | P/E fwd | P/S | P/S fwd | P/GP | P/GP fwd | EV/EBITDA | FCF yld |
|---|---|---|---|---|---|---|---|---|---|
TLN | $16.2B | n/m | 16.9x | 4.6x | 3.6x | 10.3x | 8.1x | 32.2x | 3.1% |
GEV | $268.1B | 28.6x | 32.8x | 6.5x | 5.8x | 32.1x | 28.8x | 29.9x | 4.6% |
BE | $67.7B | 275.0x | 87.8x | 21.7x | 16.7x | 69.6x | 53.5x | 194.0x | 0.9% |
| Ticker | Mkt cap | P/E | P/E fwd | P/S | P/S fwd | P/GP | P/GP fwd | EV/EBITDA | FCF yld |
|---|---|---|---|---|---|---|---|---|---|
RUN | $2.3B | 4.0x | 8.1x | 0.7x | 0.8x | 2.4x | 2.5x | 22.0x | -32.1% |
CWEN | $6.5B | 793.3x | — | 4.4x | 3.9x | 8.5x | 7.5x | 14.3x | 9.0% |
Consensus projections
| Ticker | FY2026E | FY2027E | FY2028E | |
|---|---|---|---|---|
CCJ | Revenue | +2.8% | +10.6% | +9.5% |
| EPS | +14.2% | +60.9% | +20.5% | |
LEU | Revenue | +2.5% | +5.4% | −12.9% |
| EPS | −42.9% | +7.1% | −26.3% | |
BWXT | Revenue | +20.2% | +9.9% | +7.5% |
| EPS | +24.1% | +11.5% | +11.3% | |
UEC | Revenue | −59.3% | +272.6% | +157.9% |
| EPS | +58.7% | −79.8% | −647.6% | |
UUUU | Revenue | +152.8% | +63.3% | +59.0% |
| EPS | −52.3% | −188.4% | +252.4% | |
NXE | Revenue | −68.7% | +131.4% | +32282.1% |
| EPS | −9.1% | −31.8% | +23.4% | |
DNN | Revenue | +394.2% | −27.3% | +1699.7% |
| EPS | −30.5% | −73.1% | −363.0% | |
OKLO | Revenue | — | +364.3% | +700.0% |
| EPS | +20.2% | +14.2% | +12.2% | |
SMR | Revenue | −26.7% | +434.9% | +101.2% |
| EPS | −74.7% | +33.4% | −18.3% | |
NNE | Revenue | +1684.0% | +356.5% | +39.0% |
| EPS | −23.4% | +55.2% | +34.3% | |
EU | Revenue | +101.0% | +20.6% | +72.5% |
| EPS | −66.0% | −114.4% | +1843.9% | |
CEG | Revenue | +35.3% | +4.1% | +5.2% |
| EPS | +25.2% | +13.1% | +28.6% | |
VST | Revenue | +20.8% | +8.9% | +4.9% |
| EPS | +89.5% | +20.6% | +16.1% | |
TLN | Revenue | +85.4% | +16.2% | +4.4% |
| EPS | +258.6% | +48.7% | +19.6% | |
GEV | Revenue | +23.4% | +14.6% | +15.3% |
| EPS | +322.4% | −19.0% | +40.3% | |
BE | Revenue | +112.4% | +65.1% | +46.0% |
| EPS | +374.5% | +83.5% | +60.7% | |
RUN | Revenue | +26.6% | +7.7% | +13.7% |
| EPS | −11.7% | −61.6% | +54.2% | |
CWEN | Revenue | +17.0% | +11.6% | +12.6% |
| EPS | −164.1% | −148.8% | +63.8% |
Forward fiscal years only. Blank means no analyst coverage for that year.
The five-day split is a calendar artifact
Priced to a common 2026-07-22 close, the fuel/services bucket (CCJ, LEU, URA, BWXT, UEC, UUUU, NXE, DNN) averaged +0.5% over five sessions — and the developer bucket (OKLO, SMR, LTBR, NNE, EU) also averaged +0.5%. Identical. The apparent divergence came from stale data: CCJ, BWXT, BE, RUN and CWEN carry prices through 7/27 while the rest of the cohort stops at 7/22. Within the broader power complex, the actual five-day outperformers were the IPPs — CEG +6.5% and VST +4.1% — not the fuel names.
The bands say one cohort, not two
All 13 nuclear-complex names are in strongly bearish trend bands as of 7/22, with zero exceptions. The fuel layer followed the developers down rather than resisting them: LTBR flipped 6/5, SMR 6/10, OKLO 6/11 — then UEC 6/4, UUUU 6/25, DNN 6/30, NXE 7/2, URA 7/6, CCJ 7/7, BWXT 7/8. CCJ, URA, UUUU, NXE and DNN were all strongly bullish on 1/22 and mildly bullish on 4/22. That is a clean six-month de-rating, not an early-leg uptrend. Over 90 days the fuel bucket is -29.0% versus -38.6% for developers — a real ~10-point gap, but "losing less" inside a confirmed downtrend. The 7/16 cohort selloff took UEC down alongside OKLO and SMR, which is the tell.
The macro leg is mixed, not one-way
The long-term uranium contract price broke past $90/lb in January for the first time since 2008, but spot cooled to roughly $85.75/lb after a Q2 high. Kazatomprom guided 2026 output up ~9%. The Russian LEU import ban's waivers all terminate by January 1, 2028 — a hard cutoff ~18 months out — but DOE's first production task orders went $900M each to Centrus, General Matter and Orano, and Urenco is adding 2.1 million SWU at Eunice, New Mexico — competition, not a monopoly. Hyperscaler demand is dated and real — Meta alone signed for up to 6.6 GW with Oklo, Vistra and TerraPower — yet OKLO is still -41.8% over 90 days.
What actually separates the two layers
Fundamentals, not price trend. BWXT raised FY26 guidance to $650-665M adjusted EBITDA and $4.60-4.75 EPS; Cameco held annual guidance in Q1 with Westinghouse narrowing to a $46M loss and reports Q2 before the open on July 31. OKLO and SMR are pre-revenue. On 12 months the fuel layer is still positive (CCJ +12.2%, BWXT +19.3%, DNN +41.2%) while SMR is -80.5%. But every fuel name trades below its 200-day: CCJ -14.6%, URA -17.5%, LEU -26.5%. The prior Desk calls on CCJ at $120.14 and URA at $57.23 are now marked at $89.35 and $40.97.