

Defense Bifurcation: The Real Story Behind Primes Sliding and Space Names Ripping
Prompt v1.0
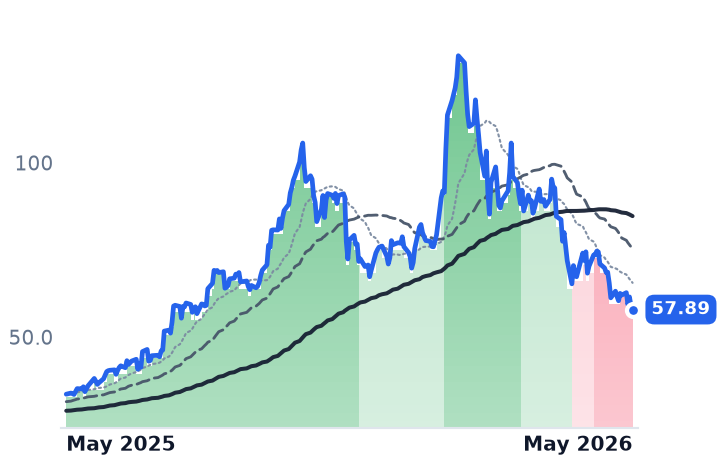
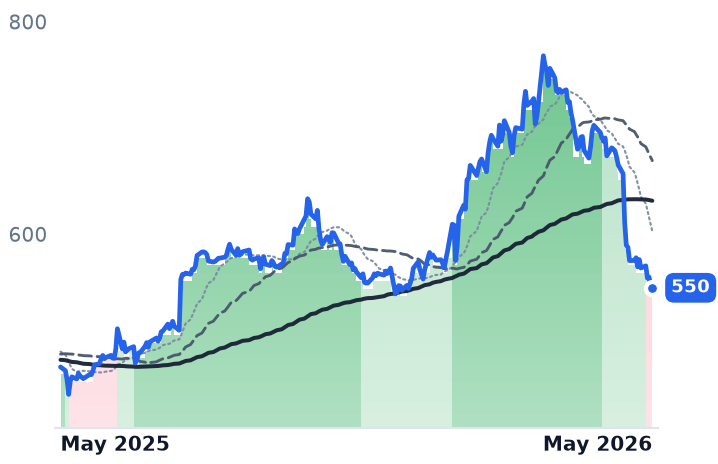
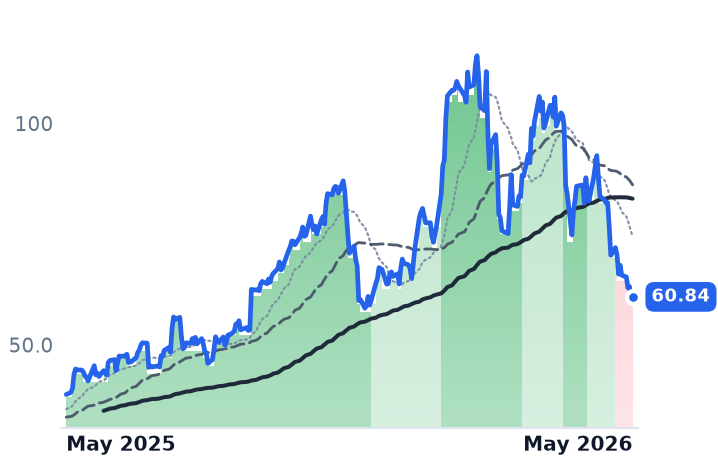
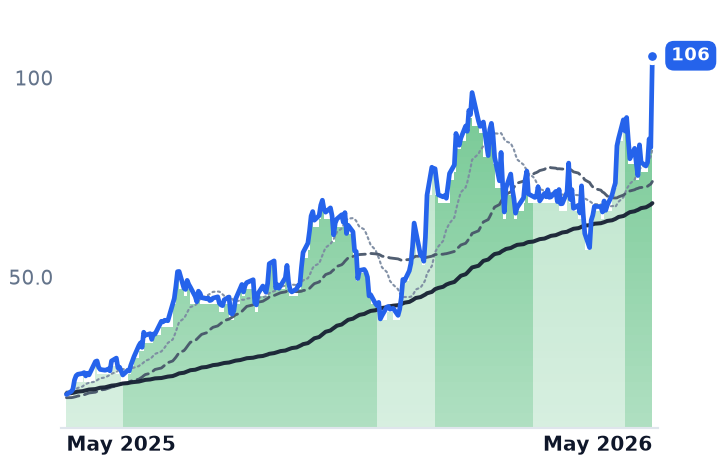
KTOS (-41% in 3m) and NOC (-21% from peak) are in sustained drawdowns while RKLB (+39%), PL (+62%), and SATL (+117%) surge — but the driver is NOT budget-share rotation. The bifurcation reflects multiple compression from peak valuations (KTOS) and capex overhang fears (NOC), while both companies posted Q1 earnings beats with raised guidance and record backlogs. The clean 'legacy primes losing to commercial space' narrative is muddier than it appears.
| Ticker | Company | Segment | Trend · 13mo | 30D | 1Y |
|---|---|---|---|---|---|
KTOS | Kratos Defense & Security Solutions | Missiles, Weapons & Fire Control | ⚠️ Emerging Bear | −15.3% | +72.2% |
NOC | Northrop Grumman | Large Diversified Primes | 🟢 Cont. Bull | −20.4% | +15.7% |
KRMN | Karman | Missiles, Weapons & Fire Control | 🟢 Cont. Bull | −27.8% | +56.8% |
RKLB | Rocket Lab USA | Unmanned Systems & ISR | 🟢 Cont. Bull | +58.1% | +414.6% |
PL | Planet Labs PBC | Unmanned Systems & ISR | 🟢 Cont. Bull | +14.1% | +996.6% |
SATL | Satellogic | Specialty Manufacturing & Components | 🌱 Emerging Bull | +5.1% | +77.3% |
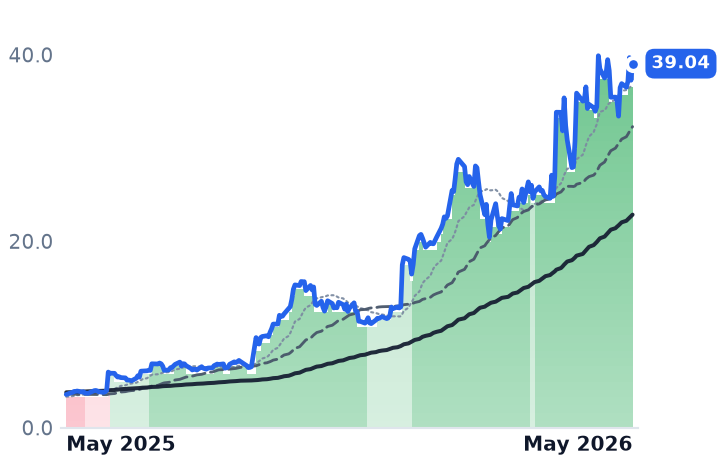
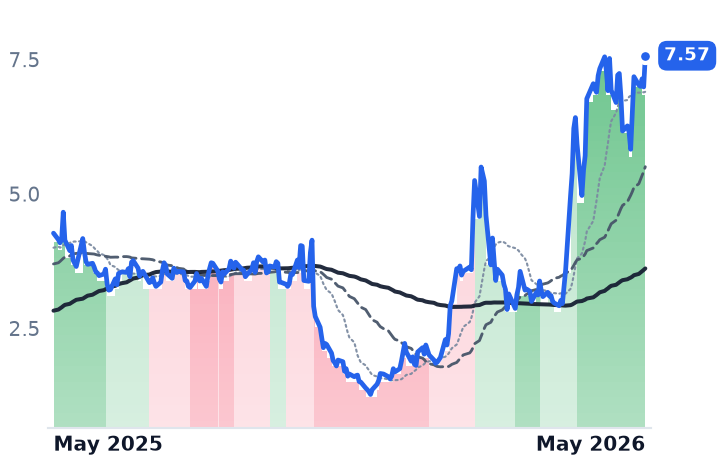
12-month price & trend
| Ticker | Mkt cap | P/E | P/E fwd | P/S | P/S fwd | P/GP | P/GP fwd | EV/EBITDA | FCF yld |
|---|---|---|---|---|---|---|---|---|---|
KTOS | $9.8B | 313.2x | 68.0x | 6.9x | 5.6x | 31.7x | 25.9x | 83.6x | -1.4% |
NOC | $76.8B | 16.8x | 19.3x | 1.8x | 1.7x | 8.8x | 8.5x | 12.2x | 4.3% |
KRMN | $8.3B | 277.7x | 101.1x | 15.9x | 11.4x | 41.5x | 29.7x | 66.1x | -0.4% |
| Ticker | Mkt cap | P/E | P/E fwd | P/S | P/S fwd | P/GP | P/GP fwd | EV/EBITDA | FCF yld |
|---|---|---|---|---|---|---|---|---|---|
RKLB | $72.2B | n/m | — | 106.3x | 79.7x | 290.7x | 218.0x | n/m | -0.4% |
PL | $8.2B | n/m | — | 24.5x | 18.8x | 44.1x | 34.0x | n/m | 0.6% |
SATL | $798.4M | n/m | — | 25.0x | 18.2x | 31.7x | 23.0x | n/m | -5.3% |
Consensus projections
| Ticker | FY2026E | FY2027E | FY2028E | |
|---|---|---|---|---|
KTOS | Revenue | +30.5% | +23.7% | +20.9% |
| EPS | +44.0% | +40.0% | +29.9% | |
NOC | Revenue | +5.1% | +6.7% | +6.1% |
| EPS | +7.2% | +7.9% | +8.6% | |
KRMN | Revenue | +55.3% | +28.0% | +25.9% |
| EPS | +71.4% | +51.4% | +31.2% | |
RKLB | Revenue | +51.0% | +39.0% | +27.0% |
| EPS | −41.8% | −100.1% | +68844.3% | |
PL | Revenue | +21.9% | +46.2% | +30.7% |
| EPS | −56.0% | +25.8% | −78.2% | |
SATL | Revenue | +186.7% | +39.1% | +47.4% |
| EPS | +192.5% | −93.6% | −25.0% |
Forward fiscal years only. Blank means no analyst coverage for that year.
What's Actually Happening
The price action is real and dramatic. KTOS dropped from $98.81 to $57.89 over three months — a -41% slide classified as a gradual-intensity drawdown. NOC fell from a peak near $768 in early March to $549, a peak-to-trough decline of roughly -28%, with the sharpest single leg being a -6.5% print on April 21 post-earnings. KRMN shed -37.6% over the same window. Meanwhile, RKLB surged +39%, PL +62%, and SATL +117%.
The divergence is striking on the surface. The hypothesis that this reflects structural budget-share rotation from legacy primes to commercial space — while narratively compelling — doesn't hold up under the fundamental evidence.
Why the Primes Are Sliding
NOC's slide is a capex shock, not a program crisis. The company actually beat Q1 2026 estimates: $9.88B revenue (+4% YoY, +5% organic), EPS of $6.14 vs. $6.08 expected, and a record $96B backlog. Q1 operating income surged 72% YoY to $989M with operating margin at a recent high of 10%. What rattled investors was a $200M increase in 2026 CapEx guidance (now $1.85B) and a $1.8B free cash outflow tied to the B-21 Raider production ramp — the kind of front-loaded investment that compresses near-term FCF while building long-term capacity.
Morgan Stanley maintained its Overweight rating post-earnings, trimming its target only modestly from $765 to $745, viewing the selloff as a buying opportunity tied to a transitory capex cycle. Sell-side consensus sits at a $743 average target across 10 Buy and 5 Hold ratings — implying roughly 35% upside from the current $549 price. NOC's B-21 program is nearing 10% of company revenue with a 25% production-rate increase now agreed with the Air Force; Sentinel is 6-7% of revenue with Milestone B targeted by end-2026. No structural cancellations — just CapEx timing.
KTOS's decline is pure multiple compression. The stock ran to 134-200x forward PE in late 2025/early 2026, a valuation that left no margin for error. The Q1 2026 print was strong: $371M revenue (+23% YoY, beating the $344.6M estimate), adjusted EPS $0.16 vs. $0.13 expected, a record $2B backlog, 1.6x book-to-bill (3x for the satellite business), and a $14B opportunity pipeline. Full-year 2026 guidance of $1.7B-$1.76B revenue was raised after the beat.
Yet the stock still fell 5.3% on May 7 post-earnings, as investors zeroed in on $47.3M of negative free cash flow and a gross margin collapse from ~24% in Q1 2025 to 9.4% in Q1 2026 — a mix-shift effect from early-stage production contracts, not structural deterioration. Valkyrie's LRIP Phase 1 negotiations are ongoing, targeting 40 aircraft/year production by early 2028; KTOS also won the MUX TACAIR Marine Corps CCA award alongside Northrop Grumman.
Where Commercial Space Is Actually Winning
RKLB reported Q1 2026 record revenue of $200.35M (+64% YoY), with backlog growing 20% sequentially to $2.2B and Q2 guidance of $225-$240M — all materially above consensus. RKLB was selected alongside Raytheon for the Golden Dome Space-Based Interceptor program, won a $190M 20-launch HASTE hypersonic test deal, and signed the largest launch contract in company history. The stock surged +34% on May 8 — its best single day ever.
But here's the nuance that matters: this is additive defense spending (Golden Dome, SDA), not zero-sum displacement of B-21, Sentinel, or Valkyrie budgets. And critically, KTOS itself won a $447M Space Force prime contract for Resilient Missile Warning and Tracking — with Northrop Grumman as a team member. The 'legacy vs. commercial' binary is blurring: KTOS and RKLB are competing on adjacent programs from the same $1.5T FY27 defense budget expansion, not cannibalizing each other's share.
The valuation gap is extreme but increasingly reflects growth-rate differences rather than budget-allocation winners. RKLB trades at 74.8x trailing P/S vs. NOC's 1.84x and KTOS's 7.5x — the chasm is real, but RKLB is also burning cash (FCF -$77.4M in Q1 2026) and remains deeply unprofitable.
The Bifurcation Is Real — The Interpretation Isn't
The divergence in price action across legacy primes vs. commercial space names is empirically confirmed and sustained across multiple months and multiple tickers. But the mechanism is different from what the 'budget-share rotation' framing implies. NOC's drawdown is a capex-timing repricing of a fundamentally healthy program portfolio. KTOS's drawdown is a reversion from unsustainable peak multiples on a business that is operationally accelerating. RKLB and peers are capturing genuinely new government wallet — Golden Dome, SDA, hypersonics testing — that didn't exist at scale 18 months ago.
Jefferies initiated KTOS with a Buy at an $85 target in early April, citing the KGS hypersonics franchise and Valkyrie ramp — implying ~47% upside from current levels. KTOS's hypersonic franchise is targeting $400M revenue in 2026 and $700M in 2027, with a $1B+ sole-source verbal award pending. At 74x forward PE, it remains expensive — but the fundamental trajectory (1.6x book-to-bill, raised guidance, record backlog) is pointing the other direction from the stock.
The structural question isn't whether commercial space is winning — it clearly is. The question is whether that win is coming at the expense of legacy primes or alongside them. The evidence, for now, suggests the latter.