

AI2 Construction Second Tier: FIX/IESC/MTZ Already Re-Rated; GVA Is the Remaining Gradual Mover
Prompt v1.0
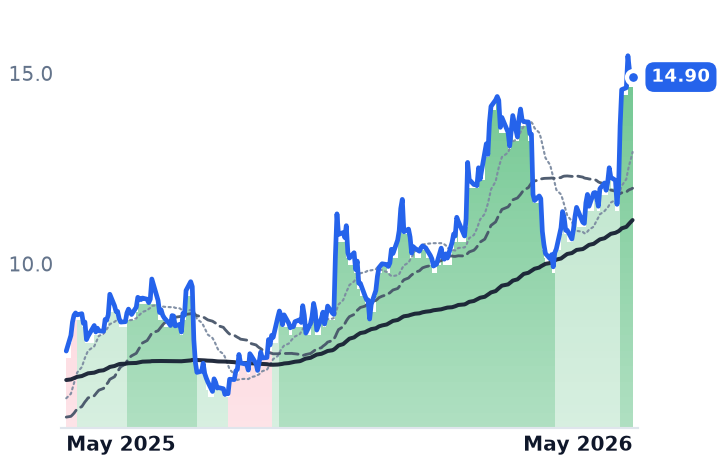
FIX, IESC, and MTZ have surged 65–76% over 90 days on confirmed hyperscaler backlog disclosures — far beyond the 'gradual' pattern originally sought. GVA (+22% over 90 days) is the clearest remaining measured uptrend with nascent but real data-center exposure (~10% of revenue), while TPC pulled back on a revenue miss and ROAD/MTRX/AMRC/NWPX/ORN lack sufficient price data to confirm signals.
| Ticker | Company | Segment | Trend · 13mo | 30D | 1Y |
|---|---|---|---|---|---|
FIX | Comfort Systems USA | MEP & Building Systems | 🟢 Cont. Bull | +24.0% | +350.2% |
IESC | IES | MEP & Building Systems | 🟢 Cont. Bull | +24.4% | +171.4% |
MTZ | MasTec | Electrical & Power Infrastructure | 🟢 Cont. Bull | +15.9% | +179.5% |
GVA | Granite Construction Incorporated | Infrastructure & Civil Construction | 🟢 Cont. Bull | +11.1% | +72.8% |
TPC | Tutor Perini | Infrastructure & Civil Construction | 🟢 Cont. Bull | +1.7% | +153.7% |
AMRC | Ameresco | Energy & Power Project Solutions | ⚠️ Emerging Bear | +15.2% | +124.3% |
MTRX | MTRX | — | 🔴 Cont. Bear | — | — |
ROAD | Construction Partners | Infrastructure & Civil Construction | 🟢 Cont. Bull | +19.4% | +46.7% |
NWPX | NWPX Infrastructure | Infrastructure Pipe Systems | 🟢 Cont. Bull | +34.3% | +193.4% |
ORN | Orion | Infrastructure & Civil Construction | 🟢 Cont. Bull | +26.1% | +93.3% |
12-month price & trend
| Ticker | Mkt cap | P/E | P/E fwd | P/S | P/S fwd | P/GP | P/GP fwd | EV/EBITDA | FCF yld |
|---|---|---|---|---|---|---|---|---|---|
FIX | $70.2B | 57.4x | 46.3x | 6.9x | 5.9x | 27.6x | 23.5x | 40.1x | 2.0% |
IESC | $13.6B | 35.7x | 34.6x | 3.7x | 3.4x | 14.6x | 13.2x | 28.0x | 2.3% |
MTZ | $21.1B | 41.4x | 28.6x | 1.3x | 1.2x | 11.4x | 10.0x | 21.9x | 1.2% |
| Ticker | Mkt cap | P/E | P/E fwd | P/S | P/S fwd | P/GP | P/GP fwd | EV/EBITDA | FCF yld |
|---|---|---|---|---|---|---|---|---|---|
GVA | $6.1B | 32.6x | 23.2x | 1.3x | 1.2x | 8.2x | 7.2x | 14.9x | 5.0% |
TPC | $4.2B | 53.6x | 23.1x | 0.7x | 0.7x | 6.3x | 5.7x | 12.9x | 16.8% |
AMRC | $1.7B | 55.5x | 29.5x | 0.9x | 0.8x | 5.7x | 5.3x | 15.6x | -14.3% |
| Ticker | Mkt cap | P/E | P/E fwd | P/S | P/S fwd | P/GP | P/GP fwd | EV/EBITDA | FCF yld |
|---|---|---|---|---|---|---|---|---|---|
MTRX | — | — | — | — | — | — | — | — | — |
ROAD | $6.7B | 52.0x | 39.4x | 2.0x | 1.8x | 13.0x | 11.8x | 19.0x | 2.9% |
NWPX | $1.1B | 25.3x | 22.5x | 1.9x | 1.8x | 9.6x | 8.8x | 14.9x | 6.7% |
| Ticker | Mkt cap | P/E | P/E fwd | P/S | P/S fwd | P/GP | P/GP fwd | EV/EBITDA | FCF yld |
|---|---|---|---|---|---|---|---|---|---|
ORN | $608.8M | 70.2x | 38.2x | 0.7x | 0.6x | 5.6x | 5.3x | 17.2x | -0.3% |
Consensus projections
| Ticker | FY2026E | FY2027E | FY2028E | |
|---|---|---|---|---|
FIX | Revenue | +35.4% | +17.8% | +15.0% |
| EPS | +63.8% | +21.8% | +26.1% | |
IESC | Revenue | +21.1% | +17.4% | +14.2% |
| EPS | +49.8% | +12.7% | +15.4% | |
MTZ | Revenue | +30.5% | +20.3% | +14.5% |
| EPS | +43.0% | +34.8% | +28.0% | |
GVA | Revenue | +19.3% | +6.7% | +5.7% |
| EPS | +40.3% | +20.4% | +12.6% | |
TPC | Revenue | +17.0% | +10.3% | +2.7% |
| EPS | +121.7% | +53.3% | +52.6% | |
AMRC | Revenue | +10.2% | +8.6% | +11.5% |
| EPS | +39.6% | +49.6% | +28.1% | |
ROAD | Revenue | +28.4% | +10.8% | −0.1% |
| EPS | +40.9% | +25.9% | −1.9% | |
NWPX | Revenue | +14.8% | −3.7% | +1.4% |
| EPS | +49.8% | −2.1% | −0.8% | |
ORN | Revenue | +11.5% | +9.0% | — |
| EPS | +81.9% | +70.0% | — |
Forward fiscal years only. Blank means no analyst coverage for that year.
The cohort has bifurcated sharply
The AI2 Construction/MEP second-tier scan was hunting for gradual 12–30% uptrends with runway. What the data reveals instead is a two-speed market: the top three names have already moved violently, and the remaining tracked names either tell a mixed story or lack local price data entirely.
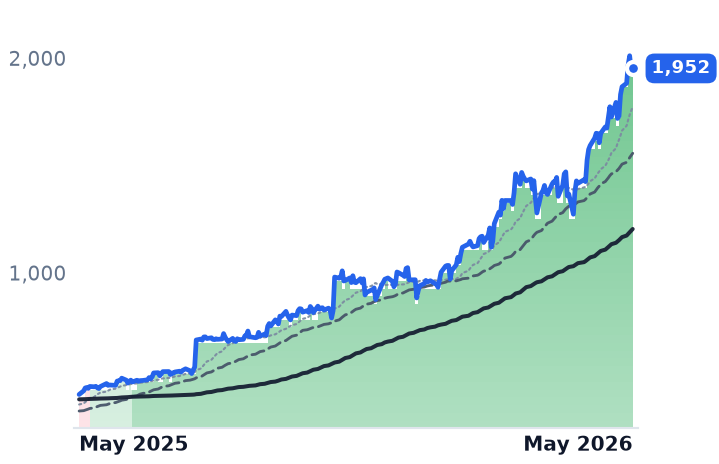
FIX (Comfort Systems) is up approximately 74% over 90 days — from roughly $1,120 to $1,952 — and ~28% over 30 days alone. This is no longer a gradual re-rating candidate. Q1 2026 same-store revenue rose 51%, gross margin hit a record 26.3%, and backlog reached $12.5B (doubled year-over-year), with advanced technology and data-center work now accounting for ~56% of revenue. FIX is scaling modular data center prefabrication capacity to 4 million sq ft by end-2026, creating a durable labor-scarcity moat as hyperscaler customers sign multi-year capacity commitments. The stock is firmly in re-rating territory, not gradual-uptrend territory.
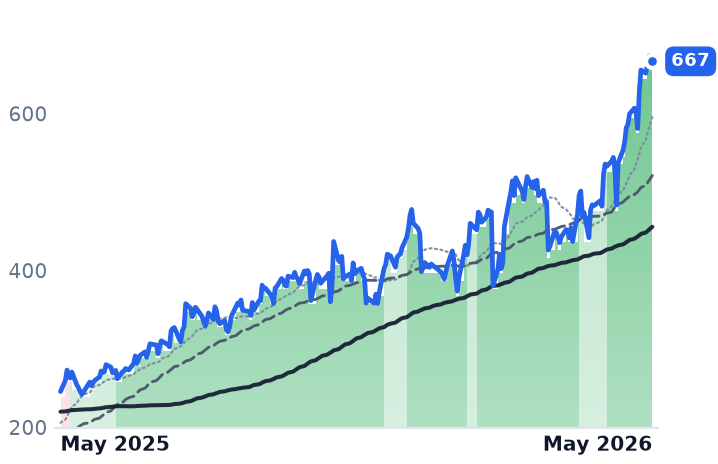
IESC (IES Holdings) has surged ~66% over 90 days. Q2 FY2026 results showed revenue up 17% to $974M and net income jumping 56% to $109.9M (diluted EPS $5.44), with backlog reaching $3.9B — up 62% since fiscal 2025 year-end. The Communications segment grew 35% to $367.7M driven by data center activity; Infrastructure Solutions surged 64% partly aided by the January 2026 Gulf Island Fabrication acquisition. One cautionary flag: IESC insiders have made 78 open-market sales and zero purchases over the past six months, with Executive Chairman Jeffrey Gendell alone selling 190,253 shares — a signal worth watching at current valuations.
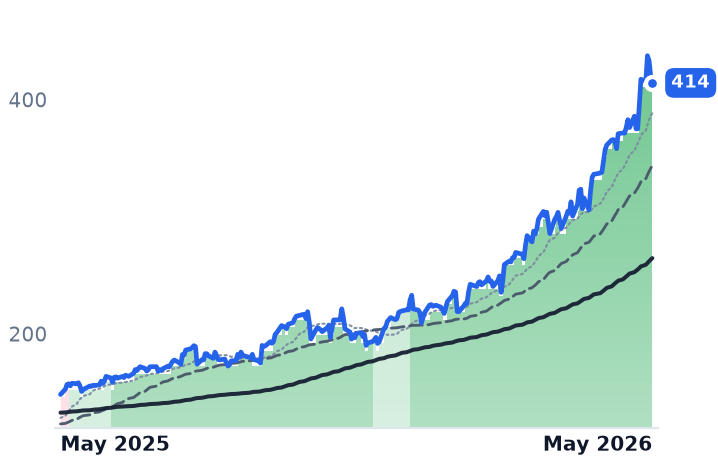
MTZ (MasTec) is up ~76% over 90 days. Q1 2026 delivered revenue +34% to $3.83B, adjusted EBITDA +73%, and adjusted EPS +174% to $1.39, with a record $20.3B backlog and a 1.4x book-to-bill. Management confirmed its first turnkey data center GC award is 'progressing very well' and cited data center development as 'a big part' of Clean Energy & Infrastructure opportunities, with site work, power infrastructure, and ongoing expansion all in scope. The Power Delivery segment posted revenue +16% and EBITDA +40% with a 1.6x book-to-bill. CEO Jose Mas noted on the Q1 call that MTZ is exploring an MEP acquisition to complete its turnkey data center solution, and that customers are increasingly seeking sole-sourced contracts. Datacenter awards represent $1B of MasTec's backlog; Clear Street raised its price target to $330 on higher-than-expected guidance and backlog visibility through 2027 — though the stock has since traded well above that target.
GVA: The last measured mover with confirmed (partial) AI exposure
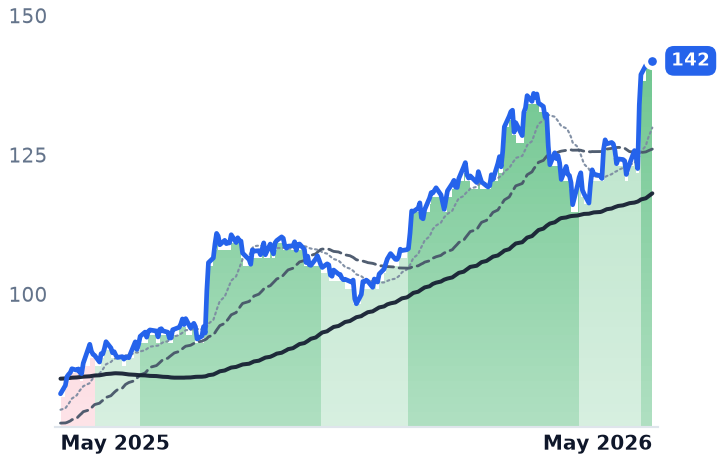
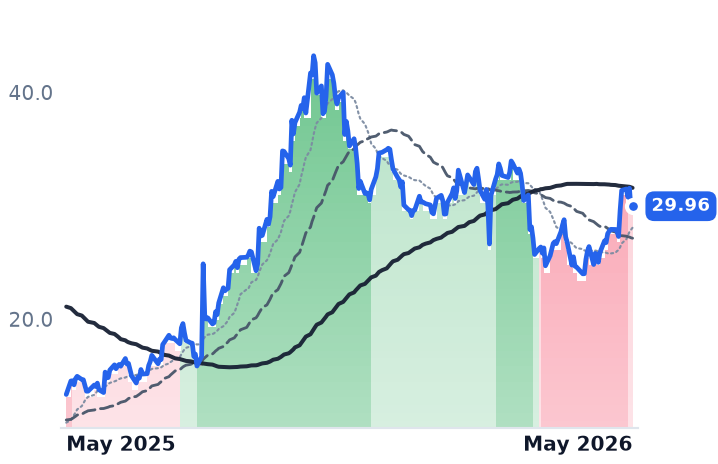
GVA (Granite Construction) is the one name that still fits the original thesis geometry. It is up ~22% over 90 days and ~17% over 30 days — a sustained, non-parabolic move. Q1 2026 revenue rose 30% to $912M, the Committed and Awarded Projects backlog hit a record $7.2B (+$1.4B YoY), and FY2026 revenue guidance was raised to $5.2–5.4B. Data center-related work is approaching 10% of total revenue, and the Kenny Seng Construction acquisition expands federal infrastructure and data center exposure.
The nuance: GVA's $7.2B CAP includes $640M of U.S. Customs and Border Protection tactical infrastructure projects expected to be substantially realized in 2026–2027, meaning border/highway work — not AI data centers — remains the dominant mix driver. GuruFocus flags the stock as potentially 44.1% overvalued post-Q1, and insider activity shows net selling of $6.7M over the past three months with no reported buying. GVA trades at a P/E discount to peers (~32x vs. sector average ~43x), but the AI re-rating story is a secondary growth driver here, not the primary one.
TPC and the untracked names
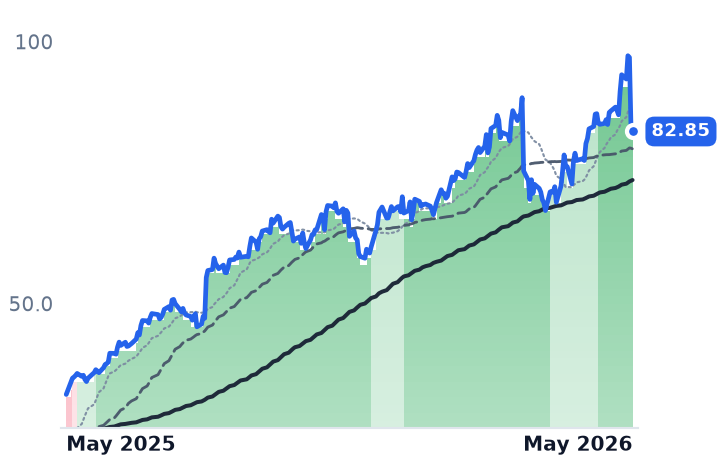
TPC (Tutor Perini) briefly joined the 22%-over-90d club before a post-earnings pullback to ~$82.85 from a peak near $97. Q1 2026 showed revenue +11.5% to $1.39B, adjusted EPS +58%, and record operating cash flow of $146.9M (+542% YoY); the $19.8B backlog underpins FY2026 guidance of $4.90–$5.30 adjusted EPS. However, TPC's backlog is driven by mass transit, building, and defense megaprojects, with no direct hyperscaler campus award disclosed, and a $175M unfavorable legal ruling in April 2026 related to the W/Element Hotel in Philadelphia represents a legacy execution overhang.
For AMRC, Q1 2026 showed 14% revenue growth and 20% backlog growth with 2026 guidance of $2.0–2.2B revenue and $270–295M EBITDA, though analyst price target dispersion is wide. MTRX is a micro-cap (~$360M) with limited confirmed AI data center revenue per available profiles. ROAD, NWPX, and ORN return no local price data and cannot be ranked on signal criteria.
The structural backdrop
Hyperscaler AI capex from the Big Five is guided at a combined ~$725B for 2026 — roughly 77% above 2025 — and mechanical/electrical scope per AI campus runs 1.5–2x that of cloud-era data centers due to liquid-cooling and rack-density requirements. Skilled MEP labor supply, not demand, is the binding constraint. Cost per delivered megawatt has jumped from ~$7M in 2020 to $11–20M for liquid-cooled AI sites, with MEP subcontractors in Northern Virginia and Dallas booked 18–24 months forward. That structural demand tailwind is real — the question for this cohort is simply how much is already priced in.