

AI2 Power Distribution: Mid-Tier Movers With Intact Runway
Prompt v1.0
Beyond the already-flagged leaders, MYRG, EME, GEV, and ETN stand out as the AI2 power/electrical cohort's best-supported mid-tier opportunities — each combining 30–90 day sustained price moves with record backlogs, raised guidance, and confirmed hyperscaler demand. POWL's 65% run and 55x forward PE warrant caution, while HUBB and ATKR remain mired in commodity/regulatory drag.
| Ticker | Company | Segment | Trend · 13mo | 30D | 1Y |
|---|---|---|---|---|---|
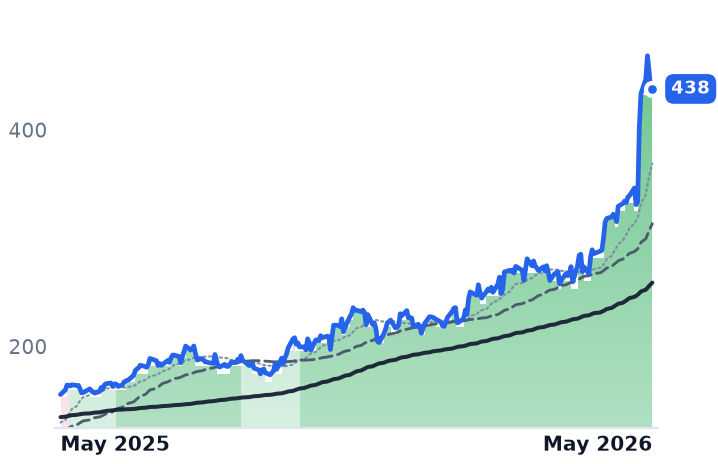
MYRG | MYR | Electrical & Power Infrastructure | 🟢 Cont. Bull | +39.0% | +181.4% |
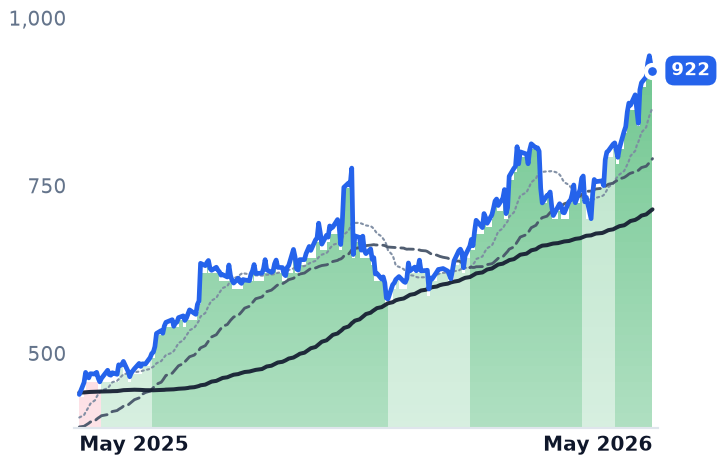
EME | EMCOR | Electrical & Power Infrastructure | 🟢 Cont. Bull | +15.2% | +110.1% |
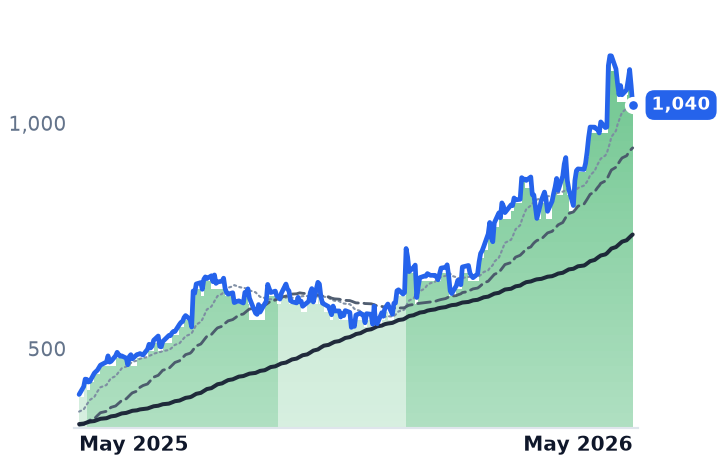
GEV | GE Vernova | GE Vernova Integrated | 🟢 Cont. Bull | +7.5% | +161.1% |
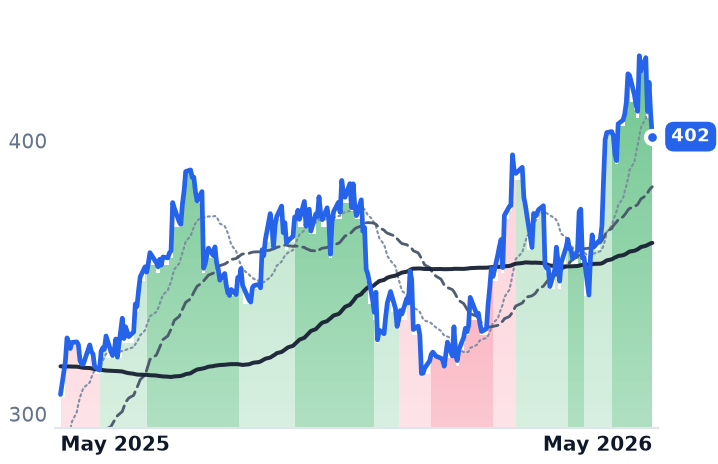
ETN | Eaton | Power & Propulsion Systems | 🟢 Cont. Bull | +0.3% | +30.7% |
POWL | Powell Industries | Electrical Distribution & Switchgear | 🟢 Cont. Bull | +34.0% | +433.1% |
HUBB | Hubbell Incorporated | Electrical Distribution & Switchgear | 🟢 Cont. Bull | −7.9% | +39.8% |
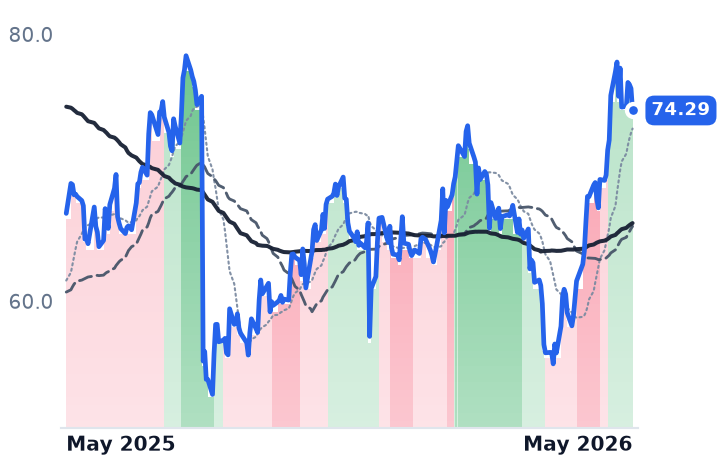
ATKR | Atkore | Electrical Infrastructure Products | 🌱 Emerging Bull | +9.5% | +11.6% |
MTZ | MasTec | Electrical & Power Infrastructure | 🟢 Cont. Bull | +15.9% | +179.5% |
IESC | IES | MEP & Building Systems | 🟢 Cont. Bull | +24.4% | +171.4% |
NVT | nVent Electric | Data Center Power & Thermal | 🟢 Cont. Bull | +32.3% | +178.6% |
PWR | Quanta Services | Electrical & Power Infrastructure | 🟢 Cont. Bull | +28.0% | +128.8% |
12-month price & trend
| Ticker | Mkt cap | P/E | P/E fwd | P/S | P/S fwd | P/GP | P/GP fwd | EV/EBITDA | FCF yld |
|---|---|---|---|---|---|---|---|---|---|
MYRG | $5.2B | 31.3x | 28.3x | 1.3x | 1.2x | 10.4x | 9.8x | 18.4x | 4.3% |
EME | $40.7B | 30.8x | 31.1x | 2.3x | 2.1x | 11.7x | 11.0x | 19.8x | 2.7% |
GEV | $268.1B | 28.6x | 32.8x | 6.5x | 5.8x | 32.1x | 28.8x | 29.9x | 4.6% |
| Ticker | Mkt cap | P/E | P/E fwd | P/S | P/S fwd | P/GP | P/GP fwd | EV/EBITDA | FCF yld |
|---|---|---|---|---|---|---|---|---|---|
ETN | $178.2B | 46.6x | 34.1x | 5.9x | 5.5x | 16.5x | 15.3x | 32.9x | 2.5% |
POWL | $7.6B | 39.7x | 38.6x | 6.6x | 6.4x | 21.8x | 21.2x | 28.0x | 3.2% |
HUBB | $27.4B | 30.6x | 25.5x | 4.4x | 4.0x | 12.5x | 11.4x | 22.0x | 3.3% |
| Ticker | Mkt cap | P/E | P/E fwd | P/S | P/S fwd | P/GP | P/GP fwd | EV/EBITDA | FCF yld |
|---|---|---|---|---|---|---|---|---|---|
ATKR | $3.2B | n/m | 16.8x | 1.1x | 1.1x | 5.5x | 5.4x | n/m | 1.8% |
MTZ | $21.1B | 41.4x | 28.6x | 1.3x | 1.2x | 11.4x | 10.0x | 21.9x | 1.2% |
IESC | $13.6B | 35.7x | 34.6x | 3.7x | 3.4x | 14.6x | 13.2x | 28.0x | 2.3% |
| Ticker | Mkt cap | P/E | P/E fwd | P/S | P/S fwd | P/GP | P/GP fwd | EV/EBITDA | FCF yld |
|---|---|---|---|---|---|---|---|---|---|
NVT | $27.3B | 55.8x | 37.0x | 6.3x | 5.5x | 17.1x | 14.9x | 31.3x | 1.4% |
PWR | $100.3B | 75.5x | 42.9x | 3.1x | 2.7x | 21.2x | 18.5x | 35.1x | 2.4% |
Consensus projections
| Ticker | FY2026E | FY2027E | FY2028E | |
|---|---|---|---|---|
MYRG | Revenue | +19.4% | +14.0% | +9.1% |
| EPS | +66.3% | +18.1% | +22.2% | |
EME | Revenue | +13.3% | +7.5% | +6.9% |
| EPS | +15.8% | +11.2% | +13.6% | |
GEV | Revenue | +23.4% | +14.6% | +15.3% |
| EPS | +322.4% | −19.0% | +40.3% | |
ETN | Revenue | +18.5% | +10.9% | +8.9% |
| EPS | +11.6% | +18.3% | +16.9% | |
POWL | Revenue | +8.7% | +22.0% | +13.1% |
| EPS | +12.4% | +21.8% | +31.6% | |
HUBB | Revenue | +16.4% | +9.3% | +6.3% |
| EPS | +11.9% | +11.5% | +11.1% | |
ATKR | Revenue | +5.7% | +2.9% | +7.7% |
| EPS | −15.1% | +12.6% | +14.7% | |
MTZ | Revenue | +30.5% | +20.3% | +14.5% |
| EPS | +43.0% | +34.8% | +28.0% | |
IESC | Revenue | +21.1% | +17.4% | +14.2% |
| EPS | +49.8% | +12.7% | +15.4% | |
NVT | Revenue | +29.7% | +14.7% | +13.2% |
| EPS | +36.9% | +22.2% | +16.5% | |
PWR | Revenue | +34.0% | +15.2% | +13.1% |
| EPS | +46.4% | +16.9% | +17.3% |
Forward fiscal years only. Blank means no analyst coverage for that year.
What's happening
The AI2: Power & Electrical Infrastructure cohort has bifurcated sharply. The already-covered headline names (STRL, PENG, FLEX, AAON, FLNC) have had their moment. The more interesting question now is which mid-tier transformer, switchgear, and substation-EPC names have durable runway from current prices — and the evidence pack surfaces four distinct tiers.
The standout gradual movers
MYRG (MYR Group) is the sharpest confirmation of the hypothesis. The stock gained ~63% over 90 days (from ~$268 to ~$438 as of May 8, 2026), but the price action is anchored in fundamentals rather than sentiment alone. Q1 2026 results showed revenue of $1.0B (+20% YoY), net income doubling to $46.8M, EBITDA of a record $82M, and EPS of $2.99 that beat the $2.06 estimate by 45%. Total backlog hit a record $2.84B (+7.7% YoY), with ~$2.54B converting within 12 months. Management raised full-year 2026 guidance to ~12% revenue growth, citing data center construction starts up nearly 100% YoY. A 5-year design-build MSA with Xcel Energy valued at over $500M anchors the revenue base independently of spot wins.
EME (EMCOR) is the steadier compounder. The stock climbed ~19% over 90 days (from ~$776 to ~$922), with the move building consistently rather than spiking. Q1 2026 results showed record revenue of $4.63B (+19.7% YoY, +16.8% organic), with electrical construction revenues up 33% and network/communications (data centers) up nearly 50%. RPO/backlog hit a record $15.62B — up 32.9% YoY — driven by AI/cloud data center work in Network & Communications (up 60% YoY). Full-year 2026 guidance was raised to $18.5B–$19.25B revenue and EPS of $28.25–$29.75, with ~78% of RPO converting within 12 months.
Equipment-side: GEV leads, POWL flags caution
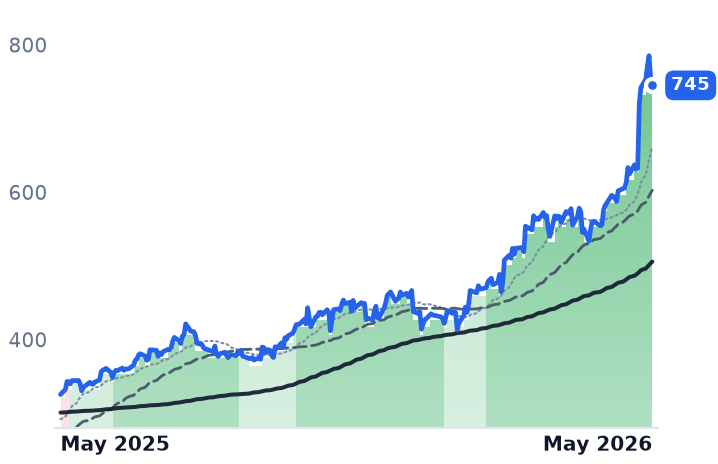
GEV (GE Vernova) gained ~32% over 90 days (from ~$791 to ~$1,040), with a further +11% in the last 30 days alone. The Electrification backlog now stands at $39B (+75% YoY), and data center Electrification orders in Q1 2026 alone exceeded the full-year 2025 total at ~$2.4B. GEV raised FY2026 revenue guidance to $44.5B–$45.5B and free cash flow guidance to $6.5B–$7.5B (up from $5.0B–$5.5B). It now expects to reach a $200B backlog by 2027, pulled forward from 2028. The Prolec GE acquisition added five transformer factories and a backlog that has grown 25% since the acquisition was announced.
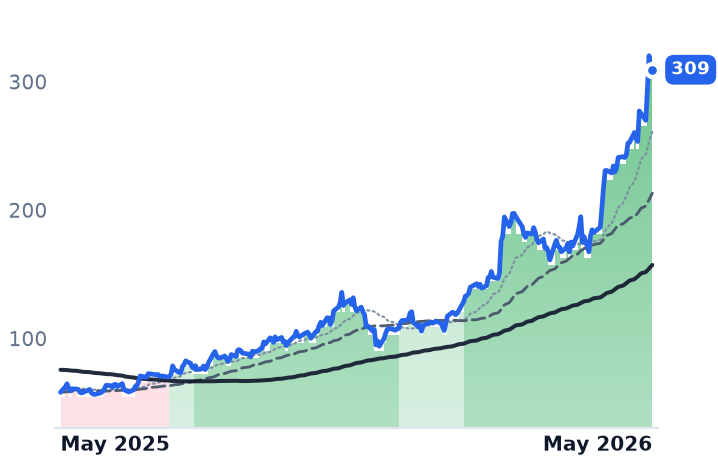
POWL (Powell Industries) surged ~65% over 90 days (from ~$187 to ~$309), accelerating to +42% in the last 30 days alone after a post-quarter $400M+ data center award — the largest in company history. The Q2 FY2026 book-to-bill was 1.7x with $490M in new orders (+97% YoY). Visibility extends "well into fiscal 2028." However, the trailing PE is ~59.5x and forward PE ~55.7x, placing POWL firmly in the post-blowoff caution zone despite the structural order tailwinds.
ETN (Eaton) is the largest-cap name and slowest mover (+6.5% over 90 days), but Q1 2026 results confirmed record revenue of $7.5B (+17% YoY), data center orders up 240% in Electrical Americas, and total electrical backlog up 48% YoY. ETN's Electrical Global backlog surged 73% YoY — the steepest rate across all segments. Eaton has committed $340M to a new South Carolina transformer facility targeting 2027 production, per Power Magazine's transformer supply analysis. The lagging price (+6.5%) relative to the backlog surge (+48–73%) may reflect temporary margin headwinds from capacity ramp costs (~130 bps front-loaded in 2026), not deteriorating fundamentals.
The structural backstop
The multi-year transformer and switchgear supply crunch is the unifying thesis. More than half of planned 2026 U.S. data centers face delays not from funding gaps but from critical equipment shortages with 3–5 year lead times. Wood Mackenzie warns the shortage will worsen despite ~$1.8B in announced North American capacity expansions, as demand from data centers, EV charging, and industrial reshoring continues to outstrip supply additions. Hyperscalers — Alphabet, Amazon, Meta, and Microsoft — have guided for more than $650B in combined AI infrastructure capex in 2026, providing the demand backstop through at least 2027–2028.
Disconfirming signals
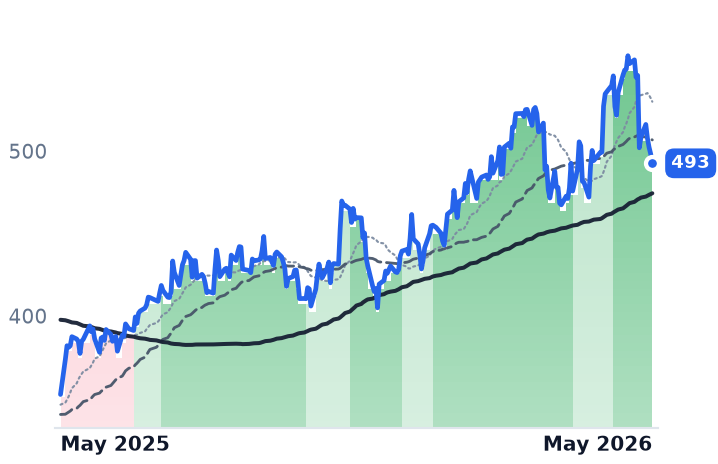
HUBB declined ~2% over 90 days (from ~$503 to ~$493), with a volatile pattern — recovering from a $467 trough to $527 before selling off again — inconsistent with a confirmed sustained uptrend. ATKR gained only ~13% over 90 days, constrained by its commoditized conduit/raceway exposure to copper and PVC pricing pressure. Both names confirm the hypothesis's prediction that regulated-utility caps and commodity-cycle drag would separate the field.
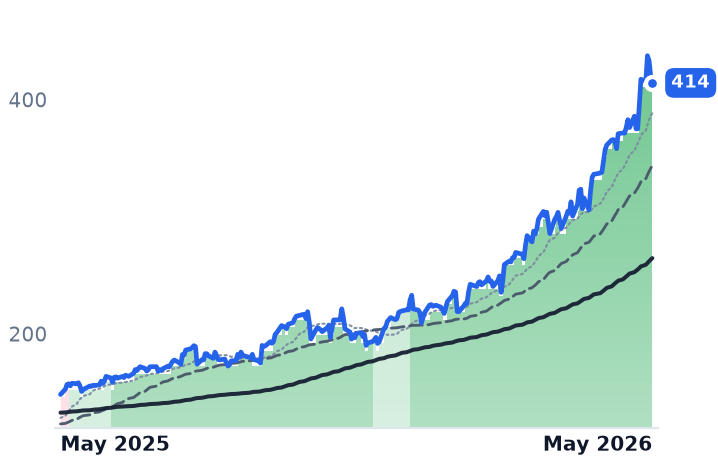
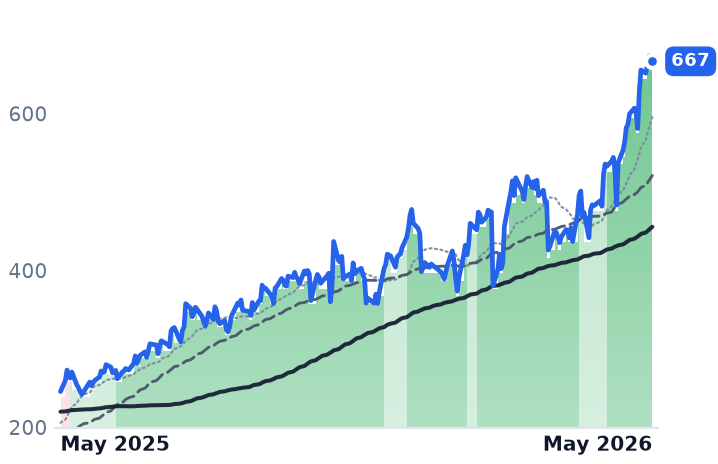
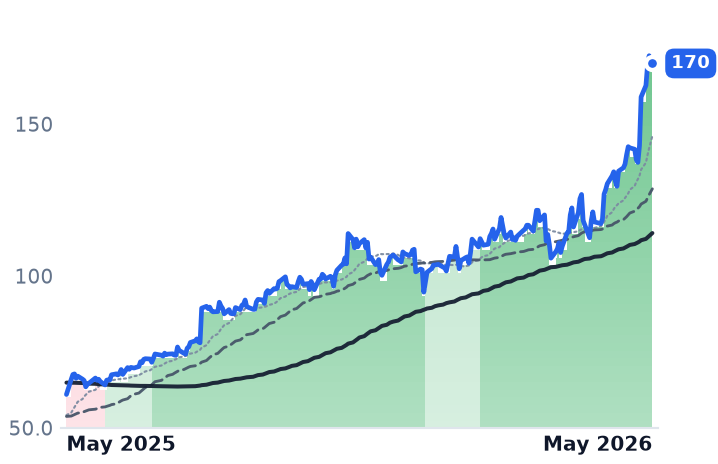
Also worth noting for coverage purposes: MTZ rose ~58% over 90 days (from ~$261 to ~$414), IESC gained ~36% (from ~$490 to ~$667), and NVT (nVent Electric) surged ~52% (from ~$112 to ~$170 in enclosures/data center electrical protection) — each a potentially undercovered mid-tier mover worth watching.