

Space/Defense Bifurcation: Valuation Re-Rating, Not Budget-Share Shift
Prompt v1.0
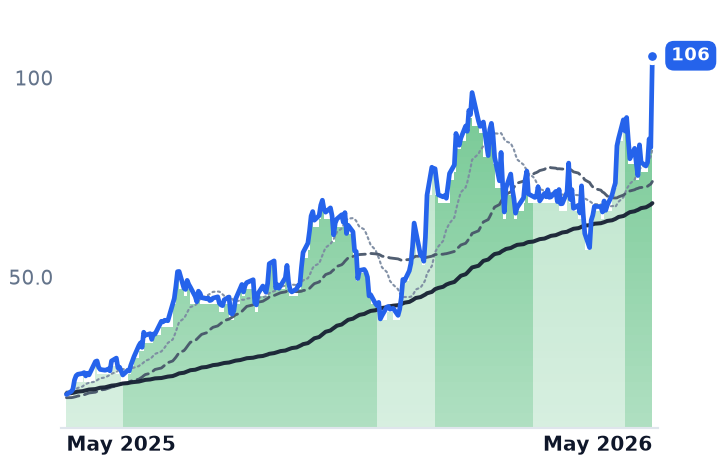
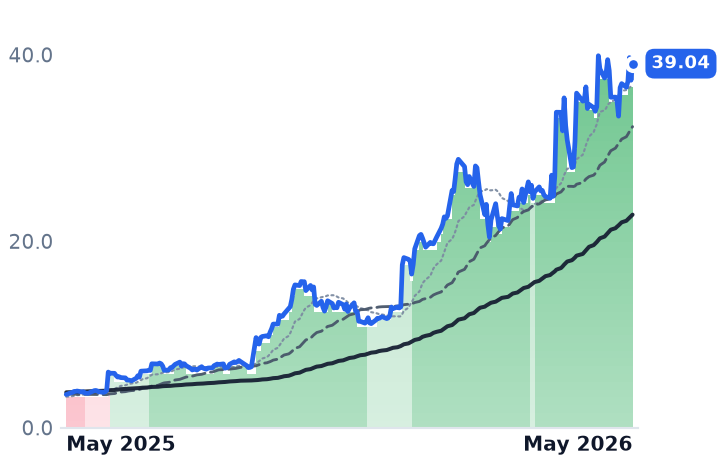
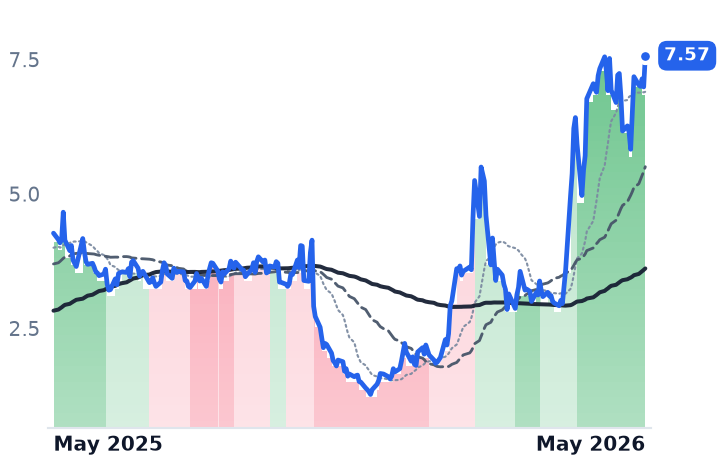
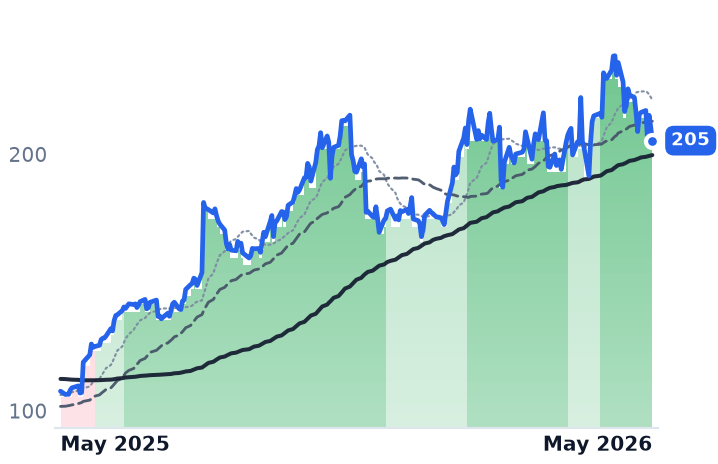
The dramatic divergence between legacy defense primes/subcontractors (KTOS -41%, NOC -20%, KRMN -38%) and commercial space leaders (RKLB, PL, SATL) is real — but it's a valuation re-rating story, not evidence of a structural budget-share transfer. The laggards' fundamentals remain intact, while the leaders carry elevated multiples and meaningful execution risk of their own.
| Ticker | Company | Segment | Trend · 13mo | 30D | 1Y |
|---|---|---|---|---|---|
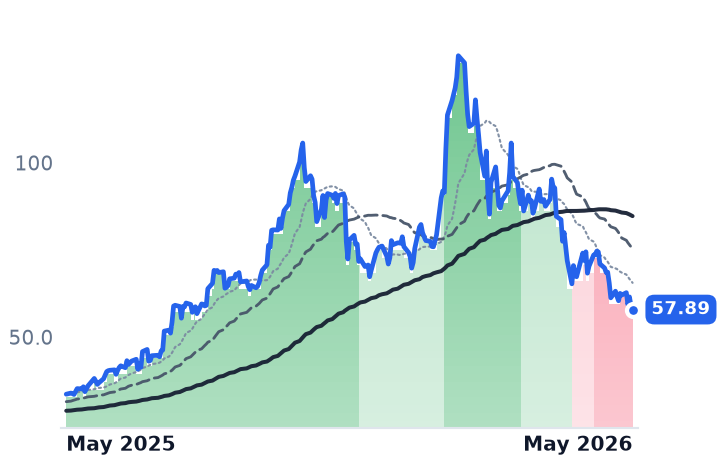
KTOS | Kratos Defense & Security Solutions | Missiles, Weapons & Fire Control | ⚠️ Emerging Bear | −15.3% | +72.2% |
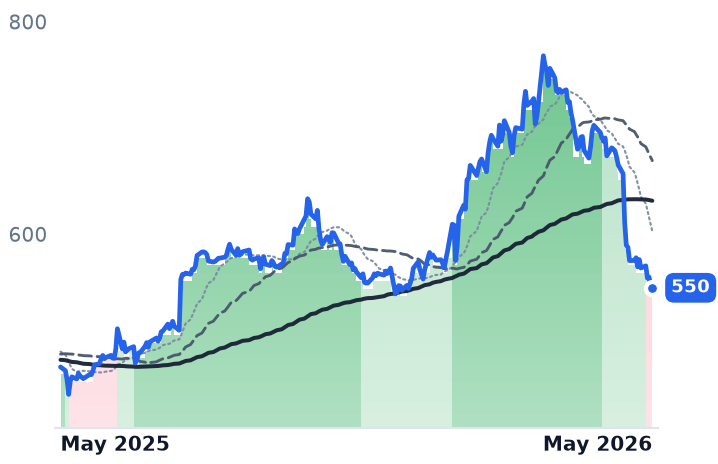
NOC | Northrop Grumman | Large Diversified Primes | 🟢 Cont. Bull | −20.4% | +15.7% |
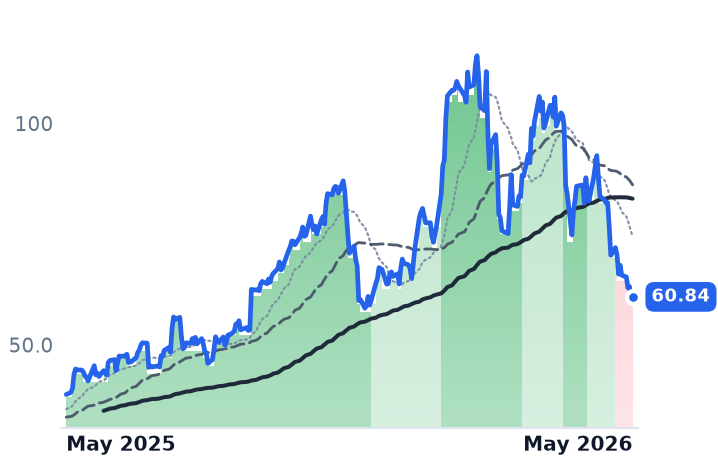
KRMN | Karman | Missiles, Weapons & Fire Control | 🟢 Cont. Bull | −27.8% | +56.8% |
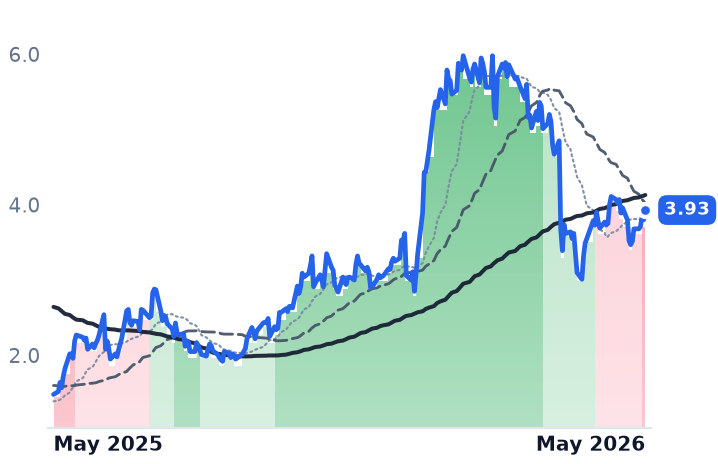
CMTL | Comtech Telecommunications | Communication Equipment | ⚠️ Emerging Bear | +4.0% | +165.5% |
RKLB | Rocket Lab USA | Unmanned Systems & ISR | 🟢 Cont. Bull | +58.1% | +414.6% |
PL | Planet Labs PBC | Unmanned Systems & ISR | 🟢 Cont. Bull | +14.1% | +996.6% |
SATL | Satellogic | Specialty Manufacturing & Components | 🌱 Emerging Bull | +5.1% | +77.3% |
BWXT | BWX Technologies | Naval & Shipbuilding | 🟢 Cont. Bull | −10.8% | +90.7% |
LHX | L3Harris Technologies | Avionics & Electronic Systems | 🟢 Cont. Bull | −16.3% | +38.9% |
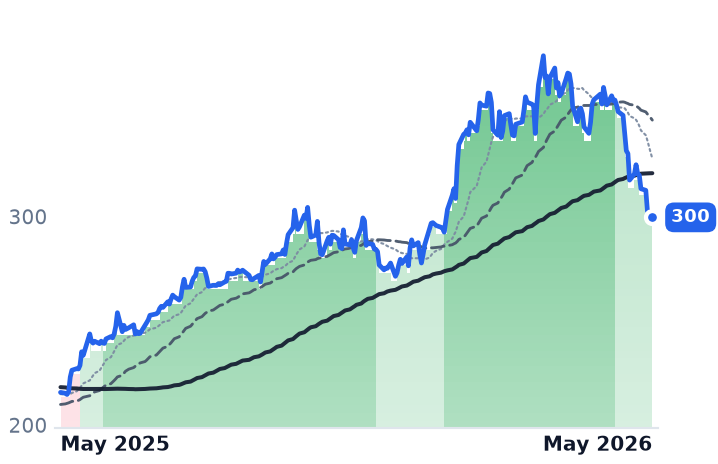
12-month price & trend
| Ticker | Mkt cap | P/E | P/E fwd | P/S | P/S fwd | P/GP | P/GP fwd | EV/EBITDA | FCF yld |
|---|---|---|---|---|---|---|---|---|---|
KTOS | $9.8B | 313.2x | 68.0x | 6.9x | 5.6x | 31.7x | 25.9x | 83.6x | -1.4% |
NOC | $76.8B | 16.8x | 19.3x | 1.8x | 1.7x | 8.8x | 8.5x | 12.2x | 4.3% |
KRMN | $8.3B | 277.7x | 101.1x | 15.9x | 11.4x | 41.5x | 29.7x | 66.1x | -0.4% |
| Ticker | Mkt cap | P/E | P/E fwd | P/S | P/S fwd | P/GP | P/GP fwd | EV/EBITDA | FCF yld |
|---|---|---|---|---|---|---|---|---|---|
CMTL | $116.3M | 9.5x | — | 0.2x | 0.3x | 0.8x | 0.9x | n/m | 12.5% |
RKLB | $72.2B | n/m | — | 106.3x | 79.7x | 290.7x | 218.0x | n/m | -0.4% |
PL | $8.2B | n/m | — | 24.5x | 18.8x | 44.1x | 34.0x | n/m | 0.6% |
| Ticker | Mkt cap | P/E | P/E fwd | P/S | P/S fwd | P/GP | P/GP fwd | EV/EBITDA | FCF yld |
|---|---|---|---|---|---|---|---|---|---|
SATL | $798.4M | n/m | — | 25.0x | 18.2x | 31.7x | 23.0x | n/m | -5.3% |
BWXT | $15.9B | 44.6x | 36.5x | 4.5x | 4.2x | 20.5x | 19.0x | 31.2x | 2.0% |
LHX | $56.5B | 32.7x | 26.1x | 2.5x | 2.4x | 10.3x | 9.8x | 16.1x | 4.6% |
Consensus projections
| Ticker | FY2026E | FY2027E | FY2028E | |
|---|---|---|---|---|
KTOS | Revenue | +30.5% | +23.7% | +20.9% |
| EPS | +44.0% | +40.0% | +29.9% | |
NOC | Revenue | +5.1% | +6.7% | +6.1% |
| EPS | +7.2% | +7.9% | +8.6% | |
KRMN | Revenue | +55.3% | +28.0% | +25.9% |
| EPS | +71.4% | +51.4% | +31.2% | |
CMTL | Revenue | −8.8% | +4.6% | — |
| EPS | −67.3% | −16.7% | — | |
RKLB | Revenue | +51.0% | +39.0% | +27.0% |
| EPS | −41.8% | −100.1% | +68844.3% | |
PL | Revenue | +21.9% | +46.2% | +30.7% |
| EPS | −56.0% | +25.8% | −78.2% | |
SATL | Revenue | +186.7% | +39.1% | +47.4% |
| EPS | +192.5% | −93.6% | −25.0% | |
BWXT | Revenue | +20.2% | +9.9% | +7.5% |
| EPS | +24.1% | +11.5% | +11.3% | |
LHX | Revenue | +3.2% | +7.2% | +8.0% |
| EPS | −18.5% | +9.1% | +16.9% |
Forward fiscal years only. Blank means no analyst coverage for that year.
What's Happening
On the surface, the space and defense complex looks cracked down the middle. A cohort of legacy primes and subcontractors has shed 20–41% over the past one to three months, while a group of commercial launch and earth-observation names has posted triple-digit gains over the same stretch. The natural read is that DoD budget pressure or commercial disruption is systematically stripping share from incumbents. The evidence says otherwise.
Laggard Cohort: Idiosyncratic Drivers, Solid Backlogs
Each drawdown in the "laggard" group traces to a company-specific catalyst:
- KTOS fell roughly 41% from its three-month high — but this is mean-reversion after an extreme run (52-week range: $32–$134). Crucially, KTOS actually reported a record $2B backlog with a 1.6x Q1 book-to-bill ratio and raised its FY26 guidance. The problem was valuation, not the business.
- NOC dropped ~20% in a single month following a surprise $200M CapEx hike tied to B-21 production acceleration — a capacity investment, not a program loss. The underlying quarter beat estimates and NOC's backlog stands at a record $96B.
- KRMN slid ~38% over three months amid a CEO transition, a 10-K filing delay, a government-shutdown-related slowdown in contract timing, and a severe valuation reset from IPO-era multiples (price-to-earnings north of 450x). No program losses were reported.
- CMTL is a micro-cap with structural challenges specific to its own business model, largely orthogonal to the broader defense/space macro.
There is no single shared catalyst — no sweeping DoD budget cut, no NGAD cancellation, no Sentinel restructure — tying these declines together into a thematic basket.
Leader Cohort: Genuine Momentum, But Elevated Risk
The commercial-launch and geospatial side of the ledger does have fundamental support:
- RKLB posted a Q1 2026 revenue record above $200M (57% year-over-year growth), guided Q2 to $225–240M well above consensus, and carries a $2.2B backlog anchored by the $816M SDA Tracking Layer Tranche 3 award, a new HASTE deal with Anduril, and a Space-Based Interceptor selection alongside Raytheon.
- PL surged roughly 997% over twelve months on a pivot to satellite services (including deals with Germany and JSAT), rising defense contract activity, and its first-ever quarter of free cash flow profitability.
But the leader cohort is not without risk. RKLB's Neutron development recently suffered a tank failure, and the company still generates no meaningful free cash flow at scale. Multiples across the commercial-launch names embed optimistic revenue ramp assumptions that leave limited margin for execution slippage.
Why It Matters
The bifurcation is real, but its character matters enormously for how to interpret it. This is a valuation re-rating — growth multiples compressing back toward execution-phase realities for the laggards, while narrative premiums expand for the leaders — rather than a structural shift in budget share from legacy primes to commercial operators.
That distinction has two implications worth watching. First, the laggards' underlying contract pipelines and backlogs remain intact, which changes the risk profile of further downside from current prices. Second, the leaders are not immune to the same re-rating dynamic if execution stumbles; at current multiples, the gap between narrative and delivery is thin.
The sector split that looks like a competitive rout may instead be the setup for the next rotation — direction uncertain, but the valuation gap between the two cohorts is now historically wide.